SlideShare una empresa de Scribd logo
1 de 4
2013/05/07
1
STATISTICS
X-Kit Textbook
Chapter 8 (Making sense of Sample Data)
Precalculus Textbook
Appendix B: Concepts in Statistics
Par B.1 (Representing Data)
ORGANISE& SUMMARISERAW DATA
Raw Data
Discrete Data
Ungrouped
Frequency
Table
Grouped (low
frequency)
Continuous
Data
Grouped
Frequency
Table
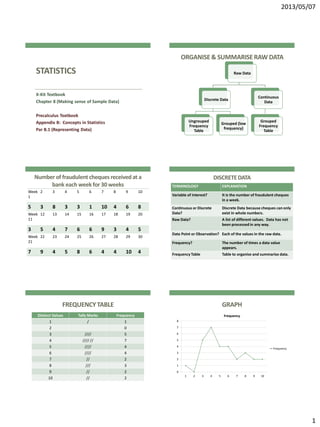
Number of fraudulent cheques receivedat a
bank each week for 30 weeks
Week
1
2 3 4 5 6 7 8 9 10
5 3 8 3 3 1 10 4 6 8
Week
11
12 13 14 15 16 17 18 19 20
3 5 4 7 6 6 9 3 4 5
Week
21
22 23 24 25 26 27 28 29 30
7 9 4 5 8 6 4 4 10 4
DISCRETEDATA
TERMINOLOGY EXPLANATION
Variable of Interest? It is the number of fraudulent cheques
in a week.
Continuous or Discrete
Data?
Discrete Data because cheques can only
exist in whole numbers.
Raw Data? A list of different values. Data has not
been processed in any way.
Data Point or Observation? Each of the values in the raw data.
Frequency? The number of times a data value
appears.
Frequency Table Table to organise and summarise data.
FREQUENCYTABLE
Distinct Values Tally Marks Frequency
1 / 1
2 0
3 //// 5
4 //// // 7
5 //// 4
6 //// 4
7 // 2
8 /// 3
9 // 2
10 // 2
GRAPH
0
1
2
3
4
5
6
7
8
1 2 3 4 5 6 7 8 9 10
Frequency
Frequency
2013/05/07
2
Truck Data: weights(in tonnes) of 20 fully
loaded trucks
Truck
1
2 3 4 5 6 7 8 9 10
Weight
4.54
3.81 4.29 5.16 2.51 4.63 4.75 3.98 5.04 2.80
Truck
11
12 13 14 15 16 17 18 19 20
Weight
2.52
5.88 2.95 3.59 3.87 4.17 3.30 5.48 4.26 3.53
CONTINUOUSDATA
TERMINOLOGY EXPLANATION
Variable of Interest? The weight of a loaded truck.
Continuous or Discrete
Data?
Continuous Data, you can get any
number of values between two
given values.
Frequency Table Table to organise and summarise
data.
Grouped Frequency Table
FREQUENCYTABLE
Class Intervals Tally Marks Frequency
𝟐. 𝟓 ≤ 𝒙 ≤ 𝟑. 𝟎 //// 4
𝟑. 𝟎 ≤ 𝒙 ≤ 𝟑. 𝟓 / 1
𝟑. 𝟓 ≤ 𝒙 ≤ 𝟒. 𝟎 //// 5
𝟒. 𝟎 ≤ 𝒙 ≤ 𝟒. 𝟓 /// 3
𝟒. 𝟓 ≤ 𝒙 ≤ 𝟓. 𝟎 /// 3
𝟓. 𝟎 ≤ 𝒙 ≤ 𝟓. 𝟓 // 2
𝟓. 𝟓 ≤ 𝒙 ≤ 𝟔. 𝟎 // 2
GRAPH
0
1
2
3
4
5
6
0 - 2.5 2.5 - 3.0 3.0 - 3.5 3.5 - 4.0 4.0 - 4.5 4.5 - 5.0 5.0 - 5.5 5.5 - 6.0
Frequency
Frequency
PRESENTATIONOF DATA
Frequency
Table
Pictogram
Bar
Graphs
Histogram
Pie
Chart
Line
Graphs
Stem-and-
Leaf
Ogive
FREQUENCYTABLE
Class Intervals Frequency Cumulative
Frequency
𝟐. 𝟓 ≤ 𝒙 ≤ 𝟑. 𝟎 4 4
𝟑. 𝟎 ≤ 𝒙 ≤ 𝟑. 𝟓 1 5
𝟑. 𝟓 ≤ 𝒙 ≤ 𝟒. 𝟎 5 10
𝟒. 𝟎 ≤ 𝒙 ≤ 𝟒. 𝟓 3 13
𝟒. 𝟓 ≤ 𝒙 ≤ 𝟓. 𝟎 3 16
𝟓. 𝟎 ≤ 𝒙 ≤ 𝟓. 𝟓 3 19
𝟓. 𝟓 ≤ 𝒙 ≤ 𝟔. 𝟎 1 20
2013/05/07
3
OGIVE
0
5
10
15
20
25
2.5 3 3.5 4 4.5 5 5.5 6
Cumulative Frequency
Pictogram: Net Worthof America'sRichest Billionaires
Pie Chart: Average Annual Expenses in a U.S. Household
EXAMPLE
In a class with 30 pupils there are 12 with
blue eyes; 9 with brown eyes; 4 with dark
brown eyes and 5 with green eyes.
1. Draw a pie chart showing this
information.
2. Calculate the fraction and percentage
represented by each eye colour.
EXAMPLE: SOLUTION
Colour of
Eyes
Frequency Angle at Centre Percentage
Blue 12 𝟏𝟐
𝟑𝟎
× 𝟑𝟔𝟎°
= 𝟏𝟒𝟒°
𝟏𝟐
𝟑𝟎
× 𝟏𝟎𝟎 = 𝟒𝟎%
Brown 9 𝟗
𝟑𝟎
× 𝟑𝟔𝟎°
= 𝟏𝟎𝟖°
𝟗
𝟑𝟎
× 𝟏𝟎𝟎 = 𝟑𝟎%
Dark Brown 4 𝟒
𝟑𝟎
× 𝟑𝟔𝟎°
= 𝟒𝟖°
𝟒
𝟑𝟎
× 𝟏𝟎𝟎 = 𝟏𝟑, 𝟑%
Green 5 𝟓
𝟑𝟎
× 𝟑𝟔𝟎°
= 𝟔𝟎°
𝟓
𝟑𝟎
× 𝟏𝟎𝟎 = 𝟏𝟔, 𝟕%
Total 30 𝟑𝟔𝟎° 𝟏𝟎𝟎%
PIE CHART
Blue
Brown
Dark Brown
Green
2013/05/07
4
Bar Graph: Expected U.S. PopulationAged 100 and Over DoubleBar Graph: Fuel Efficiency
LineGraph: Effectof Inflationon the Valueof a $100,000
LifeInsurance Policy
DoubleLineGraph: Populationsof Californiaand Texas
Stem-and-Leaf Plot
Represent the data below in a stem-and-leaf plot:
152; 165; 143; 139; 138;
144; 150; 158; 161; 157;
143; 156; 162; 165; 139;
158; 151; 167; 166; 160;
170; 132; 145; 151; 148;
147; 171; 155; 146; 141.
Stem-and-Leaf Plot
STEM LEAVES
13 9; 8; 9; 2
14 3; 4; 3; 5; 8; 7; 6; 1
15 2; 0; 8; 7; 6; 8; 1; 1; 5
16 5; 1; 2; 5; 7; 6; 0
17 0; 1

Más contenido relacionado

Destacado

Dampak dari Penggunaan Internet
Dampak dari Penggunaan InternetDampak dari Penggunaan Internet
Dampak dari Penggunaan Internetdio persada
 
Admin e business solution
Admin e business solutionAdmin e business solution
Admin e business solutionOmar Hamed
 
Chapter 8 addisional content
Chapter 8 addisional contentChapter 8 addisional content
Chapter 8 addisional contentbathabilev
 
Professional learning networks
Professional learning networksProfessional learning networks
Professional learning networksbathabilev
 
Advancing achievement in mathematics (1)
Advancing achievement in mathematics (1)Advancing achievement in mathematics (1)
Advancing achievement in mathematics (1)memcl29
 

Destacado (9)

Dampak dari Penggunaan Internet
Dampak dari Penggunaan InternetDampak dari Penggunaan Internet
Dampak dari Penggunaan Internet
 
Pitch 2
Pitch 2 Pitch 2
Pitch 2
 
Pitch
Pitch Pitch
Pitch
 
pdfjoiner
pdfjoinerpdfjoiner
pdfjoiner
 
Admin e business solution
Admin e business solutionAdmin e business solution
Admin e business solution
 
Chapter 8 addisional content
Chapter 8 addisional contentChapter 8 addisional content
Chapter 8 addisional content
 
Professional learning networks
Professional learning networksProfessional learning networks
Professional learning networks
 
Evaluation question 1
Evaluation question 1Evaluation question 1
Evaluation question 1
 
Advancing achievement in mathematics (1)
Advancing achievement in mathematics (1)Advancing achievement in mathematics (1)
Advancing achievement in mathematics (1)
 

Similar a Chapter 8 making sense of sample data

maft0a2_Statistics_lecture2_2021.pptx
maft0a2_Statistics_lecture2_2021.pptxmaft0a2_Statistics_lecture2_2021.pptx
maft0a2_Statistics_lecture2_2021.pptxTshegofatso Mphake
 
Willie Evangelista - Presentation of data
Willie Evangelista -  Presentation of data Willie Evangelista -  Presentation of data
Willie Evangelista - Presentation of data Willie Evangelista
 
Presentationofdata 120111034007-phpapp02
Presentationofdata 120111034007-phpapp02Presentationofdata 120111034007-phpapp02
Presentationofdata 120111034007-phpapp02Alex Robianes Hernandez
 
20- Tabular & Graphical Presentation of data(UG2017-18).ppt
20- Tabular & Graphical Presentation of data(UG2017-18).ppt20- Tabular & Graphical Presentation of data(UG2017-18).ppt
20- Tabular & Graphical Presentation of data(UG2017-18).pptaibakimito
 
20- Tabular & Graphical Presentation of data(UG2017-18).ppt
20- Tabular & Graphical Presentation of data(UG2017-18).ppt20- Tabular & Graphical Presentation of data(UG2017-18).ppt
20- Tabular & Graphical Presentation of data(UG2017-18).pptRAJESHKUMAR428748
 
Stat 200 week 6 homework problems9.1.2 many high school student
Stat 200 week 6 homework problems9.1.2 many high school studentStat 200 week 6 homework problems9.1.2 many high school student
Stat 200 week 6 homework problems9.1.2 many high school studentrock73
 
Type of data @ web mining discussion
Type of data @ web mining discussionType of data @ web mining discussion
Type of data @ web mining discussionCherryBerry2
 
Type of data @ Web Mining Discussion
Type of data @ Web Mining DiscussionType of data @ Web Mining Discussion
Type of data @ Web Mining DiscussionCherryBerry2
 
Frequency Tables, Frequency Distributions, and Graphic Presentation
Frequency Tables, Frequency Distributions, and Graphic PresentationFrequency Tables, Frequency Distributions, and Graphic Presentation
Frequency Tables, Frequency Distributions, and Graphic PresentationConflagratioNal Jahid
 
Algebra unit 9.2
Algebra unit 9.2Algebra unit 9.2
Algebra unit 9.2Mark Ryder
 
2 biostatistics presenting data
2  biostatistics presenting data2  biostatistics presenting data
2 biostatistics presenting dataDr. Nazar Jaf
 
Penggambaran Data dengan Grafik
Penggambaran Data dengan GrafikPenggambaran Data dengan Grafik
Penggambaran Data dengan Grafikanom0164
 
03 ch ken black solution
03 ch ken black solution03 ch ken black solution
03 ch ken black solutionKrunal Shah
 
frequency distribution
 frequency distribution frequency distribution
frequency distributionUnsa Shakir
 
Graphs that Enlighten and Graphs that Deceive
Graphs that Enlighten and Graphs that DeceiveGraphs that Enlighten and Graphs that Deceive
Graphs that Enlighten and Graphs that DeceiveLong Beach City College
 
Basic Stat Notes
Basic Stat NotesBasic Stat Notes
Basic Stat Notesroopcool
 
Teoria y problemas de tabla de frecuencias tf221 ccesa007
Teoria y problemas de tabla de frecuencias  tf221  ccesa007Teoria y problemas de tabla de frecuencias  tf221  ccesa007
Teoria y problemas de tabla de frecuencias tf221 ccesa007Demetrio Ccesa Rayme
 

Similar a Chapter 8 making sense of sample data (20)

maft0a2_Statistics_lecture2_2021.pptx
maft0a2_Statistics_lecture2_2021.pptxmaft0a2_Statistics_lecture2_2021.pptx
maft0a2_Statistics_lecture2_2021.pptx
 
Willie Evangelista - Presentation of data
Willie Evangelista -  Presentation of data Willie Evangelista -  Presentation of data
Willie Evangelista - Presentation of data
 
Presentationofdata 120111034007-phpapp02
Presentationofdata 120111034007-phpapp02Presentationofdata 120111034007-phpapp02
Presentationofdata 120111034007-phpapp02
 
20- Tabular & Graphical Presentation of data(UG2017-18).ppt
20- Tabular & Graphical Presentation of data(UG2017-18).ppt20- Tabular & Graphical Presentation of data(UG2017-18).ppt
20- Tabular & Graphical Presentation of data(UG2017-18).ppt
 
20- Tabular & Graphical Presentation of data(UG2017-18).ppt
20- Tabular & Graphical Presentation of data(UG2017-18).ppt20- Tabular & Graphical Presentation of data(UG2017-18).ppt
20- Tabular & Graphical Presentation of data(UG2017-18).ppt
 
Stat 200 week 6 homework problems9.1.2 many high school student
Stat 200 week 6 homework problems9.1.2 many high school studentStat 200 week 6 homework problems9.1.2 many high school student
Stat 200 week 6 homework problems9.1.2 many high school student
 
Type of data @ web mining discussion
Type of data @ web mining discussionType of data @ web mining discussion
Type of data @ web mining discussion
 
Type of data @ Web Mining Discussion
Type of data @ Web Mining DiscussionType of data @ Web Mining Discussion
Type of data @ Web Mining Discussion
 
Frequency Tables, Frequency Distributions, and Graphic Presentation
Frequency Tables, Frequency Distributions, and Graphic PresentationFrequency Tables, Frequency Distributions, and Graphic Presentation
Frequency Tables, Frequency Distributions, and Graphic Presentation
 
statistic.ppt
statistic.pptstatistic.ppt
statistic.ppt
 
Algebra unit 9.2
Algebra unit 9.2Algebra unit 9.2
Algebra unit 9.2
 
2 biostatistics presenting data
2  biostatistics presenting data2  biostatistics presenting data
2 biostatistics presenting data
 
Penggambaran Data dengan Grafik
Penggambaran Data dengan GrafikPenggambaran Data dengan Grafik
Penggambaran Data dengan Grafik
 
03 ch ken black solution
03 ch ken black solution03 ch ken black solution
03 ch ken black solution
 
Data presentation
Data presentationData presentation
Data presentation
 
frequency distribution
 frequency distribution frequency distribution
frequency distribution
 
Graphs that Enlighten and Graphs that Deceive
Graphs that Enlighten and Graphs that DeceiveGraphs that Enlighten and Graphs that Deceive
Graphs that Enlighten and Graphs that Deceive
 
Basic Stat Notes
Basic Stat NotesBasic Stat Notes
Basic Stat Notes
 
Freq & Histo
Freq & HistoFreq & Histo
Freq & Histo
 
Teoria y problemas de tabla de frecuencias tf221 ccesa007
Teoria y problemas de tabla de frecuencias  tf221  ccesa007Teoria y problemas de tabla de frecuencias  tf221  ccesa007
Teoria y problemas de tabla de frecuencias tf221 ccesa007
 

Último

Strategies for Unlocking Knowledge Management in Microsoft 365 in the Copilot...
Strategies for Unlocking Knowledge Management in Microsoft 365 in the Copilot...Strategies for Unlocking Knowledge Management in Microsoft 365 in the Copilot...
Strategies for Unlocking Knowledge Management in Microsoft 365 in the Copilot...Drew Madelung
 
Automating Google Workspace (GWS) & more with Apps Script
Automating Google Workspace (GWS) & more with Apps ScriptAutomating Google Workspace (GWS) & more with Apps Script
Automating Google Workspace (GWS) & more with Apps Scriptwesley chun
 
GenCyber Cyber Security Day Presentation
GenCyber Cyber Security Day PresentationGenCyber Cyber Security Day Presentation
GenCyber Cyber Security Day PresentationMichael W. Hawkins
 
ProductAnonymous-April2024-WinProductDiscovery-MelissaKlemke
ProductAnonymous-April2024-WinProductDiscovery-MelissaKlemkeProductAnonymous-April2024-WinProductDiscovery-MelissaKlemke
ProductAnonymous-April2024-WinProductDiscovery-MelissaKlemkeProduct Anonymous
 
Strategize a Smooth Tenant-to-tenant Migration and Copilot Takeoff
Strategize a Smooth Tenant-to-tenant Migration and Copilot TakeoffStrategize a Smooth Tenant-to-tenant Migration and Copilot Takeoff
Strategize a Smooth Tenant-to-tenant Migration and Copilot Takeoffsammart93
 
The 7 Things I Know About Cyber Security After 25 Years | April 2024
The 7 Things I Know About Cyber Security After 25 Years | April 2024The 7 Things I Know About Cyber Security After 25 Years | April 2024
The 7 Things I Know About Cyber Security After 25 Years | April 2024Rafal Los
 
Scaling API-first – The story of a global engineering organization
Scaling API-first – The story of a global engineering organizationScaling API-first – The story of a global engineering organization
Scaling API-first – The story of a global engineering organizationRadu Cotescu
 
Understanding Discord NSFW Servers A Guide for Responsible Users.pdf
Understanding Discord NSFW Servers A Guide for Responsible Users.pdfUnderstanding Discord NSFW Servers A Guide for Responsible Users.pdf
Understanding Discord NSFW Servers A Guide for Responsible Users.pdfUK Journal
 
TrustArc Webinar - Stay Ahead of US State Data Privacy Law Developments
TrustArc Webinar - Stay Ahead of US State Data Privacy Law DevelopmentsTrustArc Webinar - Stay Ahead of US State Data Privacy Law Developments
TrustArc Webinar - Stay Ahead of US State Data Privacy Law DevelopmentsTrustArc
 
How to Troubleshoot Apps for the Modern Connected Worker
How to Troubleshoot Apps for the Modern Connected WorkerHow to Troubleshoot Apps for the Modern Connected Worker
How to Troubleshoot Apps for the Modern Connected WorkerThousandEyes
 
GenAI Risks & Security Meetup 01052024.pdf
GenAI Risks & Security Meetup 01052024.pdfGenAI Risks & Security Meetup 01052024.pdf
GenAI Risks & Security Meetup 01052024.pdflior mazor
 
Workshop - Best of Both Worlds_ Combine KG and Vector search for enhanced R...
Workshop - Best of Both Worlds_ Combine  KG and Vector search for  enhanced R...Workshop - Best of Both Worlds_ Combine  KG and Vector search for  enhanced R...
Workshop - Best of Both Worlds_ Combine KG and Vector search for enhanced R...Neo4j
 
Apidays Singapore 2024 - Building Digital Trust in a Digital Economy by Veron...
Apidays Singapore 2024 - Building Digital Trust in a Digital Economy by Veron...Apidays Singapore 2024 - Building Digital Trust in a Digital Economy by Veron...
Apidays Singapore 2024 - Building Digital Trust in a Digital Economy by Veron...apidays
 
[2024]Digital Global Overview Report 2024 Meltwater.pdf
[2024]Digital Global Overview Report 2024 Meltwater.pdf[2024]Digital Global Overview Report 2024 Meltwater.pdf
[2024]Digital Global Overview Report 2024 Meltwater.pdfhans926745
 
Data Cloud, More than a CDP by Matt Robison
Data Cloud, More than a CDP by Matt RobisonData Cloud, More than a CDP by Matt Robison
Data Cloud, More than a CDP by Matt RobisonAnna Loughnan Colquhoun
 
Tech Trends Report 2024 Future Today Institute.pdf
Tech Trends Report 2024 Future Today Institute.pdfTech Trends Report 2024 Future Today Institute.pdf
Tech Trends Report 2024 Future Today Institute.pdfhans926745
 
HTML Injection Attacks: Impact and Mitigation Strategies
HTML Injection Attacks: Impact and Mitigation StrategiesHTML Injection Attacks: Impact and Mitigation Strategies
HTML Injection Attacks: Impact and Mitigation StrategiesBoston Institute of Analytics
 
Partners Life - Insurer Innovation Award 2024
Partners Life - Insurer Innovation Award 2024Partners Life - Insurer Innovation Award 2024
Partners Life - Insurer Innovation Award 2024The Digital Insurer
 
Connector Corner: Accelerate revenue generation using UiPath API-centric busi...
Connector Corner: Accelerate revenue generation using UiPath API-centric busi...Connector Corner: Accelerate revenue generation using UiPath API-centric busi...
Connector Corner: Accelerate revenue generation using UiPath API-centric busi...DianaGray10
 
Handwritten Text Recognition for manuscripts and early printed texts
Handwritten Text Recognition for manuscripts and early printed textsHandwritten Text Recognition for manuscripts and early printed texts
Handwritten Text Recognition for manuscripts and early printed textsMaria Levchenko
 

Último (20)

Strategies for Unlocking Knowledge Management in Microsoft 365 in the Copilot...
Strategies for Unlocking Knowledge Management in Microsoft 365 in the Copilot...Strategies for Unlocking Knowledge Management in Microsoft 365 in the Copilot...
Strategies for Unlocking Knowledge Management in Microsoft 365 in the Copilot...
 
Automating Google Workspace (GWS) & more with Apps Script
Automating Google Workspace (GWS) & more with Apps ScriptAutomating Google Workspace (GWS) & more with Apps Script
Automating Google Workspace (GWS) & more with Apps Script
 
GenCyber Cyber Security Day Presentation
GenCyber Cyber Security Day PresentationGenCyber Cyber Security Day Presentation
GenCyber Cyber Security Day Presentation
 
ProductAnonymous-April2024-WinProductDiscovery-MelissaKlemke
ProductAnonymous-April2024-WinProductDiscovery-MelissaKlemkeProductAnonymous-April2024-WinProductDiscovery-MelissaKlemke
ProductAnonymous-April2024-WinProductDiscovery-MelissaKlemke
 
Strategize a Smooth Tenant-to-tenant Migration and Copilot Takeoff
Strategize a Smooth Tenant-to-tenant Migration and Copilot TakeoffStrategize a Smooth Tenant-to-tenant Migration and Copilot Takeoff
Strategize a Smooth Tenant-to-tenant Migration and Copilot Takeoff
 
The 7 Things I Know About Cyber Security After 25 Years | April 2024
The 7 Things I Know About Cyber Security After 25 Years | April 2024The 7 Things I Know About Cyber Security After 25 Years | April 2024
The 7 Things I Know About Cyber Security After 25 Years | April 2024
 
Scaling API-first – The story of a global engineering organization
Scaling API-first – The story of a global engineering organizationScaling API-first – The story of a global engineering organization
Scaling API-first – The story of a global engineering organization
 
Understanding Discord NSFW Servers A Guide for Responsible Users.pdf
Understanding Discord NSFW Servers A Guide for Responsible Users.pdfUnderstanding Discord NSFW Servers A Guide for Responsible Users.pdf
Understanding Discord NSFW Servers A Guide for Responsible Users.pdf
 
TrustArc Webinar - Stay Ahead of US State Data Privacy Law Developments
TrustArc Webinar - Stay Ahead of US State Data Privacy Law DevelopmentsTrustArc Webinar - Stay Ahead of US State Data Privacy Law Developments
TrustArc Webinar - Stay Ahead of US State Data Privacy Law Developments
 
How to Troubleshoot Apps for the Modern Connected Worker
How to Troubleshoot Apps for the Modern Connected WorkerHow to Troubleshoot Apps for the Modern Connected Worker
How to Troubleshoot Apps for the Modern Connected Worker
 
GenAI Risks & Security Meetup 01052024.pdf
GenAI Risks & Security Meetup 01052024.pdfGenAI Risks & Security Meetup 01052024.pdf
GenAI Risks & Security Meetup 01052024.pdf
 
Workshop - Best of Both Worlds_ Combine KG and Vector search for enhanced R...
Workshop - Best of Both Worlds_ Combine  KG and Vector search for  enhanced R...Workshop - Best of Both Worlds_ Combine  KG and Vector search for  enhanced R...
Workshop - Best of Both Worlds_ Combine KG and Vector search for enhanced R...
 
Apidays Singapore 2024 - Building Digital Trust in a Digital Economy by Veron...
Apidays Singapore 2024 - Building Digital Trust in a Digital Economy by Veron...Apidays Singapore 2024 - Building Digital Trust in a Digital Economy by Veron...
Apidays Singapore 2024 - Building Digital Trust in a Digital Economy by Veron...
 
[2024]Digital Global Overview Report 2024 Meltwater.pdf
[2024]Digital Global Overview Report 2024 Meltwater.pdf[2024]Digital Global Overview Report 2024 Meltwater.pdf
[2024]Digital Global Overview Report 2024 Meltwater.pdf
 
Data Cloud, More than a CDP by Matt Robison
Data Cloud, More than a CDP by Matt RobisonData Cloud, More than a CDP by Matt Robison
Data Cloud, More than a CDP by Matt Robison
 
Tech Trends Report 2024 Future Today Institute.pdf
Tech Trends Report 2024 Future Today Institute.pdfTech Trends Report 2024 Future Today Institute.pdf
Tech Trends Report 2024 Future Today Institute.pdf
 
HTML Injection Attacks: Impact and Mitigation Strategies
HTML Injection Attacks: Impact and Mitigation StrategiesHTML Injection Attacks: Impact and Mitigation Strategies
HTML Injection Attacks: Impact and Mitigation Strategies
 
Partners Life - Insurer Innovation Award 2024
Partners Life - Insurer Innovation Award 2024Partners Life - Insurer Innovation Award 2024
Partners Life - Insurer Innovation Award 2024
 
Connector Corner: Accelerate revenue generation using UiPath API-centric busi...
Connector Corner: Accelerate revenue generation using UiPath API-centric busi...Connector Corner: Accelerate revenue generation using UiPath API-centric busi...
Connector Corner: Accelerate revenue generation using UiPath API-centric busi...
 
Handwritten Text Recognition for manuscripts and early printed texts
Handwritten Text Recognition for manuscripts and early printed textsHandwritten Text Recognition for manuscripts and early printed texts
Handwritten Text Recognition for manuscripts and early printed texts
 

Chapter 8 making sense of sample data

  • 1. 2013/05/07 1 STATISTICS X-Kit Textbook Chapter 8 (Making sense of Sample Data) Precalculus Textbook Appendix B: Concepts in Statistics Par B.1 (Representing Data) ORGANISE& SUMMARISERAW DATA Raw Data Discrete Data Ungrouped Frequency Table Grouped (low frequency) Continuous Data Grouped Frequency Table Number of fraudulent cheques receivedat a bank each week for 30 weeks Week 1 2 3 4 5 6 7 8 9 10 5 3 8 3 3 1 10 4 6 8 Week 11 12 13 14 15 16 17 18 19 20 3 5 4 7 6 6 9 3 4 5 Week 21 22 23 24 25 26 27 28 29 30 7 9 4 5 8 6 4 4 10 4 DISCRETEDATA TERMINOLOGY EXPLANATION Variable of Interest? It is the number of fraudulent cheques in a week. Continuous or Discrete Data? Discrete Data because cheques can only exist in whole numbers. Raw Data? A list of different values. Data has not been processed in any way. Data Point or Observation? Each of the values in the raw data. Frequency? The number of times a data value appears. Frequency Table Table to organise and summarise data. FREQUENCYTABLE Distinct Values Tally Marks Frequency 1 / 1 2 0 3 //// 5 4 //// // 7 5 //// 4 6 //// 4 7 // 2 8 /// 3 9 // 2 10 // 2 GRAPH 0 1 2 3 4 5 6 7 8 1 2 3 4 5 6 7 8 9 10 Frequency Frequency
  • 2. 2013/05/07 2 Truck Data: weights(in tonnes) of 20 fully loaded trucks Truck 1 2 3 4 5 6 7 8 9 10 Weight 4.54 3.81 4.29 5.16 2.51 4.63 4.75 3.98 5.04 2.80 Truck 11 12 13 14 15 16 17 18 19 20 Weight 2.52 5.88 2.95 3.59 3.87 4.17 3.30 5.48 4.26 3.53 CONTINUOUSDATA TERMINOLOGY EXPLANATION Variable of Interest? The weight of a loaded truck. Continuous or Discrete Data? Continuous Data, you can get any number of values between two given values. Frequency Table Table to organise and summarise data. Grouped Frequency Table FREQUENCYTABLE Class Intervals Tally Marks Frequency 𝟐. 𝟓 ≤ 𝒙 ≤ 𝟑. 𝟎 //// 4 𝟑. 𝟎 ≤ 𝒙 ≤ 𝟑. 𝟓 / 1 𝟑. 𝟓 ≤ 𝒙 ≤ 𝟒. 𝟎 //// 5 𝟒. 𝟎 ≤ 𝒙 ≤ 𝟒. 𝟓 /// 3 𝟒. 𝟓 ≤ 𝒙 ≤ 𝟓. 𝟎 /// 3 𝟓. 𝟎 ≤ 𝒙 ≤ 𝟓. 𝟓 // 2 𝟓. 𝟓 ≤ 𝒙 ≤ 𝟔. 𝟎 // 2 GRAPH 0 1 2 3 4 5 6 0 - 2.5 2.5 - 3.0 3.0 - 3.5 3.5 - 4.0 4.0 - 4.5 4.5 - 5.0 5.0 - 5.5 5.5 - 6.0 Frequency Frequency PRESENTATIONOF DATA Frequency Table Pictogram Bar Graphs Histogram Pie Chart Line Graphs Stem-and- Leaf Ogive FREQUENCYTABLE Class Intervals Frequency Cumulative Frequency 𝟐. 𝟓 ≤ 𝒙 ≤ 𝟑. 𝟎 4 4 𝟑. 𝟎 ≤ 𝒙 ≤ 𝟑. 𝟓 1 5 𝟑. 𝟓 ≤ 𝒙 ≤ 𝟒. 𝟎 5 10 𝟒. 𝟎 ≤ 𝒙 ≤ 𝟒. 𝟓 3 13 𝟒. 𝟓 ≤ 𝒙 ≤ 𝟓. 𝟎 3 16 𝟓. 𝟎 ≤ 𝒙 ≤ 𝟓. 𝟓 3 19 𝟓. 𝟓 ≤ 𝒙 ≤ 𝟔. 𝟎 1 20
  • 3. 2013/05/07 3 OGIVE 0 5 10 15 20 25 2.5 3 3.5 4 4.5 5 5.5 6 Cumulative Frequency Cumulative Frequency Pictogram: Net Worthof America'sRichest Billionaires Pie Chart: Average Annual Expenses in a U.S. Household EXAMPLE In a class with 30 pupils there are 12 with blue eyes; 9 with brown eyes; 4 with dark brown eyes and 5 with green eyes. 1. Draw a pie chart showing this information. 2. Calculate the fraction and percentage represented by each eye colour. EXAMPLE: SOLUTION Colour of Eyes Frequency Angle at Centre Percentage Blue 12 𝟏𝟐 𝟑𝟎 × 𝟑𝟔𝟎° = 𝟏𝟒𝟒° 𝟏𝟐 𝟑𝟎 × 𝟏𝟎𝟎 = 𝟒𝟎% Brown 9 𝟗 𝟑𝟎 × 𝟑𝟔𝟎° = 𝟏𝟎𝟖° 𝟗 𝟑𝟎 × 𝟏𝟎𝟎 = 𝟑𝟎% Dark Brown 4 𝟒 𝟑𝟎 × 𝟑𝟔𝟎° = 𝟒𝟖° 𝟒 𝟑𝟎 × 𝟏𝟎𝟎 = 𝟏𝟑, 𝟑% Green 5 𝟓 𝟑𝟎 × 𝟑𝟔𝟎° = 𝟔𝟎° 𝟓 𝟑𝟎 × 𝟏𝟎𝟎 = 𝟏𝟔, 𝟕% Total 30 𝟑𝟔𝟎° 𝟏𝟎𝟎% PIE CHART Blue Brown Dark Brown Green
  • 4. 2013/05/07 4 Bar Graph: Expected U.S. PopulationAged 100 and Over DoubleBar Graph: Fuel Efficiency LineGraph: Effectof Inflationon the Valueof a $100,000 LifeInsurance Policy DoubleLineGraph: Populationsof Californiaand Texas Stem-and-Leaf Plot Represent the data below in a stem-and-leaf plot: 152; 165; 143; 139; 138; 144; 150; 158; 161; 157; 143; 156; 162; 165; 139; 158; 151; 167; 166; 160; 170; 132; 145; 151; 148; 147; 171; 155; 146; 141. Stem-and-Leaf Plot STEM LEAVES 13 9; 8; 9; 2 14 3; 4; 3; 5; 8; 7; 6; 1 15 2; 0; 8; 7; 6; 8; 1; 1; 5 16 5; 1; 2; 5; 7; 6; 0 17 0; 1