SlideShare una empresa de Scribd logo
1 de 15
0–29
8
6
4
2
0
Test Result in %
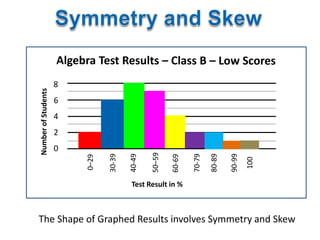
The Shape of Graphed Results involves Symmetry and Skew
0–29
8
6
4
2
0
Test Result in %
There are a small number of students who have done well, which makes
this Graph stretch out horizontally to the right.
Going to the Right is Positive, so it has “Positive Skew”
0–29
8
6
4
2
0
Test Result in %
The Kangaroo fits onto our graph with its tail going to the RIGHT.
Going to the Right is Positive, so it has “Positive Skew”
0–29
8
6
4
2
0
Test Result in %
This particular group has lots of Low scores and has not performed well.
The Mode will be to the left of the Median, and the Mean to the right.
Mode < Median < Mean
0–29
8
6
4
2
0
Test Result in %
There are a small number of students who have done poorly, which
makes this Graph stretch out horizontally to the left.
Going to the Left is Negative, so it has “Negative Skew”
0–29
8
6
4
2
0
Test Result in %
The Kangaroo fits onto our graph with its tail going to the LEFT.
Going to the Left is Negative, so it has “Negative Skew”
0–29
8
6
4
2
0
Test Result in %
This particular class has lots of High scores and has performed very well.
The Mode will be to the right of the Median, and the Mean to the left.
Mean < Median < Mode
0–29
8
6
4
2
0
Test Result in %
This particular class is fairly normal and has both low and high scores.
This graph stretches out evenly on both sides of the Mode at 60-69.
The Graph is “Symmetrical”
0–29
8
6
4
2
0
Test Result in %
Two identical Kangaroos show this graph is a mirror image type shape.
The Graph is “Symmetrical”
0–29
8
6
4
2
0
Test Result in %
This particular class is fairly normal and has both low and high scores.
The Mean, Median, and Mode will all be close together in the middle.
Mean ~ Median ~ Mode
The Kangaroo fits onto our graph with its tail going to the RIGHT.
Going to the Right is Positive, so it has “Positive Skew”
Stem Leaf
0 1 1 2 4 7 8
1 2 2 3 5 6 6 8 9
2 1 5 6 7 7 8 8 9 9 9
3 2 4 4 5 7 7 8
4 1 3 5 8
5 2 3 7
6 2 3 4
7 2 6
8 3
9 2
Look at the S&L Plot
sideways, and form a
rotated 90 degrees view
StemLeaf
0112478
122356689
21567788999
32445778
41358
5237
6234
726
83
92
The Kangaroo fits onto our graph with its tail going to the LEFT.
Going to the Left is Negative, so it has “Negative Skew”
Stem Leaf
0 1
1 2
2 1 5
3 2 4 8
4 1 3 5
5 2 3 7
6 2 3 4 5 6 6 7 7
7 2 2 5 5 6 7 7 7 8 8 9
8 1 3 4 4 5 6 6 7 7 7
9 2 3 4 5 6 6 7 8
StemLeaf
01
12
215
3248
4135
5237
623456677
722556777889
81344566777
923456678
Look at the S&L Plot sideways
to form a rotated 90 degrees view
Stem Leaf
0 1 2
1 2 4 6
2 1 5 6 6
3 2 4 8 8 9
4 1 3 5 6 7 7 8
5 2 3 4 5 6 6 9 9 9
6 2 3 4 5 6 6 7
7 2 2 5 5 6
8 1 3 4 7
9 2 3 5
Look from the side of
the S&L Plot and form a
rotated 90 degrees view
StemLeaf
012
1246
21566
324889
41356778
5234566999
62345667
722556
81347
9235
Two identical Kangaroos show this graph is a mirror image type shape.
The S&L Plot is “Symmetrical”
SYMMETRIC RIGHT LEFT
DATA SKEWED SKEWED
3 7 3 58 3 0
4 36 4 013345569 4 5
5 017 5 2446 5
6 1120 6 17 6 2
7 356789 7 7 17
8 0158 8 2 8 2445
9 43 9 5 9 012235569
10 0 10 0 10 000
http://passyworldofmathematics.wordpress.com/

Más contenido relacionado

La actualidad más candente

Malimu variance and standard deviation
Malimu variance and standard deviationMalimu variance and standard deviation
Malimu variance and standard deviation
Miharbi Ignasm
 
Pearson product moment correlation
Pearson product moment correlationPearson product moment correlation
Pearson product moment correlation
Denmar Marasigan
 

La actualidad más candente (20)

Malimu variance and standard deviation
Malimu variance and standard deviationMalimu variance and standard deviation
Malimu variance and standard deviation
 
Grouped Mean Median Mode
Grouped Mean Median ModeGrouped Mean Median Mode
Grouped Mean Median Mode
 
Graphing Calculator
Graphing CalculatorGraphing Calculator
Graphing Calculator
 
PIE CHART
PIE CHARTPIE CHART
PIE CHART
 
The Normal distribution
The Normal distributionThe Normal distribution
The Normal distribution
 
Normality test on SPSS
Normality test on SPSSNormality test on SPSS
Normality test on SPSS
 
Measures of Central Tendency.ppt
Measures of Central Tendency.pptMeasures of Central Tendency.ppt
Measures of Central Tendency.ppt
 
Real World Mathematics Formulas
Real World Mathematics FormulasReal World Mathematics Formulas
Real World Mathematics Formulas
 
Pearson product moment correlation
Pearson product moment correlationPearson product moment correlation
Pearson product moment correlation
 
What is a split plot anova
What is a split plot anovaWhat is a split plot anova
What is a split plot anova
 
Tutorial repeated measures ANOVA
Tutorial   repeated measures ANOVATutorial   repeated measures ANOVA
Tutorial repeated measures ANOVA
 
regression and correlation
regression and correlationregression and correlation
regression and correlation
 
Pearson Product Moment Correlation - Thiyagu
Pearson Product Moment Correlation - ThiyaguPearson Product Moment Correlation - Thiyagu
Pearson Product Moment Correlation - Thiyagu
 
Understanding data through presentation_contd
Understanding data through presentation_contdUnderstanding data through presentation_contd
Understanding data through presentation_contd
 
4-types-of-graphs.pptx
4-types-of-graphs.pptx4-types-of-graphs.pptx
4-types-of-graphs.pptx
 
Organizing and presenting data
Organizing and presenting dataOrganizing and presenting data
Organizing and presenting data
 
What is a partial correlation?
What is a partial correlation?What is a partial correlation?
What is a partial correlation?
 
Stats 3rd nine week chapter 5 review powerpoint
Stats 3rd nine week chapter 5 review powerpointStats 3rd nine week chapter 5 review powerpoint
Stats 3rd nine week chapter 5 review powerpoint
 
Solving inequalities
Solving inequalitiesSolving inequalities
Solving inequalities
 
Two-way Repeated Measures ANOVA
Two-way Repeated Measures ANOVATwo-way Repeated Measures ANOVA
Two-way Repeated Measures ANOVA
 

Destacado

Skewness & Kurtosis
Skewness & KurtosisSkewness & Kurtosis
Skewness & Kurtosis
Navin Bafna
 
3. frequency distribution
3. frequency distribution3. frequency distribution
3. frequency distribution
Ilham Bashir
 
Data Representations
Data RepresentationsData Representations
Data Representations
bujols
 
Stem & leaf plots + histograms
Stem & leaf plots + histogramsStem & leaf plots + histograms
Stem & leaf plots + histograms
ListeningDaisy
 
Sql delete, truncate, drop statements
Sql delete, truncate, drop statementsSql delete, truncate, drop statements
Sql delete, truncate, drop statements
Vivek Singh
 
Stem and leaf plot
Stem and leaf plotStem and leaf plot
Stem and leaf plot
bbeiers
 

Destacado (20)

Skewness
SkewnessSkewness
Skewness
 
Kurtosis
KurtosisKurtosis
Kurtosis
 
Skewness
SkewnessSkewness
Skewness
 
Skewness
SkewnessSkewness
Skewness
 
Skewness & Kurtosis
Skewness & KurtosisSkewness & Kurtosis
Skewness & Kurtosis
 
Finding the Mean from Grouped Frequency Table
Finding the Mean from Grouped Frequency TableFinding the Mean from Grouped Frequency Table
Finding the Mean from Grouped Frequency Table
 
Globalization is (not) God: Leadership Challenges for Civil Society Sectors
Globalization is (not) God: Leadership Challenges for Civil Society SectorsGlobalization is (not) God: Leadership Challenges for Civil Society Sectors
Globalization is (not) God: Leadership Challenges for Civil Society Sectors
 
Chapter03
Chapter03Chapter03
Chapter03
 
Ch4 notes for students
Ch4 notes for studentsCh4 notes for students
Ch4 notes for students
 
3. frequency distribution
3. frequency distribution3. frequency distribution
3. frequency distribution
 
Skewness
SkewnessSkewness
Skewness
 
Data Representations
Data RepresentationsData Representations
Data Representations
 
Stem & leaf plots + histograms
Stem & leaf plots + histogramsStem & leaf plots + histograms
Stem & leaf plots + histograms
 
Finding Interquartile Range from Stem-Leaf Plot 1
Finding Interquartile Range from Stem-Leaf Plot 1Finding Interquartile Range from Stem-Leaf Plot 1
Finding Interquartile Range from Stem-Leaf Plot 1
 
Kurtosis
KurtosisKurtosis
Kurtosis
 
Sql delete, truncate, drop statements
Sql delete, truncate, drop statementsSql delete, truncate, drop statements
Sql delete, truncate, drop statements
 
Stem and leaf plot
Stem and leaf plotStem and leaf plot
Stem and leaf plot
 
Finding Interquartile Range from Stem-Leaf Plot 2
Finding Interquartile Range from Stem-Leaf Plot 2Finding Interquartile Range from Stem-Leaf Plot 2
Finding Interquartile Range from Stem-Leaf Plot 2
 
Shape of distribution copy
Shape of distribution   copyShape of distribution   copy
Shape of distribution copy
 
Skew or kurtosis
Skew or kurtosisSkew or kurtosis
Skew or kurtosis
 

Más de Passy World

Congruent Triangles
Congruent TrianglesCongruent Triangles
Congruent Triangles
Passy World
 
Factorising Common Factors
Factorising Common FactorsFactorising Common Factors
Factorising Common Factors
Passy World
 
Expanding Binomial Brackets
Expanding Binomial BracketsExpanding Binomial Brackets
Expanding Binomial Brackets
Passy World
 
Significant Figures
Significant FiguresSignificant Figures
Significant Figures
Passy World
 
Scientific Notation
Scientific NotationScientific Notation
Scientific Notation
Passy World
 

Más de Passy World (20)

Why Exponents are Important
Why Exponents are ImportantWhy Exponents are Important
Why Exponents are Important
 
Exponents Rules
Exponents RulesExponents Rules
Exponents Rules
 
Equations with Fractions on Both Sides
Equations with Fractions on Both SidesEquations with Fractions on Both Sides
Equations with Fractions on Both Sides
 
Equations with Variables on Both Sides
Equations with Variables on Both SidesEquations with Variables on Both Sides
Equations with Variables on Both Sides
 
Gradient of Straight Lines
Gradient of Straight LinesGradient of Straight Lines
Gradient of Straight Lines
 
Midpoint Between Two Points
Midpoint Between Two PointsMidpoint Between Two Points
Midpoint Between Two Points
 
Linear Rules
Linear RulesLinear Rules
Linear Rules
 
Back to Back S&L Plots
Back to Back S&L PlotsBack to Back S&L Plots
Back to Back S&L Plots
 
The Tangent Ratio
The Tangent RatioThe Tangent Ratio
The Tangent Ratio
 
The Cosine Ratio
The Cosine RatioThe Cosine Ratio
The Cosine Ratio
 
The Sine Ratio
The Sine RatioThe Sine Ratio
The Sine Ratio
 
Labeling Trigonometry Triangles
Labeling Trigonometry TrianglesLabeling Trigonometry Triangles
Labeling Trigonometry Triangles
 
Similar Triangles II
Similar Triangles IISimilar Triangles II
Similar Triangles II
 
Similar Triangles
Similar TrianglesSimilar Triangles
Similar Triangles
 
Congruent Triangles
Congruent TrianglesCongruent Triangles
Congruent Triangles
 
Factorising Common Factors
Factorising Common FactorsFactorising Common Factors
Factorising Common Factors
 
Expanding Binomial Brackets
Expanding Binomial BracketsExpanding Binomial Brackets
Expanding Binomial Brackets
 
Rearranging Formulas
Rearranging FormulasRearranging Formulas
Rearranging Formulas
 
Significant Figures
Significant FiguresSignificant Figures
Significant Figures
 
Scientific Notation
Scientific NotationScientific Notation
Scientific Notation
 

Último

BASLIQ CURRENT LOOKBOOK LOOKBOOK(1) (1).pdf
BASLIQ CURRENT LOOKBOOK  LOOKBOOK(1) (1).pdfBASLIQ CURRENT LOOKBOOK  LOOKBOOK(1) (1).pdf
BASLIQ CURRENT LOOKBOOK LOOKBOOK(1) (1).pdf
SoniaTolstoy
 
Russian Escort Service in Delhi 11k Hotel Foreigner Russian Call Girls in Delhi
Russian Escort Service in Delhi 11k Hotel Foreigner Russian Call Girls in DelhiRussian Escort Service in Delhi 11k Hotel Foreigner Russian Call Girls in Delhi
Russian Escort Service in Delhi 11k Hotel Foreigner Russian Call Girls in Delhi
kauryashika82
 
Kisan Call Centre - To harness potential of ICT in Agriculture by answer farm...
Kisan Call Centre - To harness potential of ICT in Agriculture by answer farm...Kisan Call Centre - To harness potential of ICT in Agriculture by answer farm...
Kisan Call Centre - To harness potential of ICT in Agriculture by answer farm...
Krashi Coaching
 
1029 - Danh muc Sach Giao Khoa 10 . pdf
1029 -  Danh muc Sach Giao Khoa 10 . pdf1029 -  Danh muc Sach Giao Khoa 10 . pdf
1029 - Danh muc Sach Giao Khoa 10 . pdf
QucHHunhnh
 
The basics of sentences session 2pptx copy.pptx
The basics of sentences session 2pptx copy.pptxThe basics of sentences session 2pptx copy.pptx
The basics of sentences session 2pptx copy.pptx
heathfieldcps1
 

Último (20)

Unit-IV- Pharma. Marketing Channels.pptx
Unit-IV- Pharma. Marketing Channels.pptxUnit-IV- Pharma. Marketing Channels.pptx
Unit-IV- Pharma. Marketing Channels.pptx
 
BASLIQ CURRENT LOOKBOOK LOOKBOOK(1) (1).pdf
BASLIQ CURRENT LOOKBOOK  LOOKBOOK(1) (1).pdfBASLIQ CURRENT LOOKBOOK  LOOKBOOK(1) (1).pdf
BASLIQ CURRENT LOOKBOOK LOOKBOOK(1) (1).pdf
 
Student login on Anyboli platform.helpin
Student login on Anyboli platform.helpinStudent login on Anyboli platform.helpin
Student login on Anyboli platform.helpin
 
Class 11th Physics NEET formula sheet pdf
Class 11th Physics NEET formula sheet pdfClass 11th Physics NEET formula sheet pdf
Class 11th Physics NEET formula sheet pdf
 
social pharmacy d-pharm 1st year by Pragati K. Mahajan
social pharmacy d-pharm 1st year by Pragati K. Mahajansocial pharmacy d-pharm 1st year by Pragati K. Mahajan
social pharmacy d-pharm 1st year by Pragati K. Mahajan
 
Advance Mobile Application Development class 07
Advance Mobile Application Development class 07Advance Mobile Application Development class 07
Advance Mobile Application Development class 07
 
Holdier Curriculum Vitae (April 2024).pdf
Holdier Curriculum Vitae (April 2024).pdfHoldier Curriculum Vitae (April 2024).pdf
Holdier Curriculum Vitae (April 2024).pdf
 
Russian Escort Service in Delhi 11k Hotel Foreigner Russian Call Girls in Delhi
Russian Escort Service in Delhi 11k Hotel Foreigner Russian Call Girls in DelhiRussian Escort Service in Delhi 11k Hotel Foreigner Russian Call Girls in Delhi
Russian Escort Service in Delhi 11k Hotel Foreigner Russian Call Girls in Delhi
 
Advanced Views - Calendar View in Odoo 17
Advanced Views - Calendar View in Odoo 17Advanced Views - Calendar View in Odoo 17
Advanced Views - Calendar View in Odoo 17
 
Measures of Central Tendency: Mean, Median and Mode
Measures of Central Tendency: Mean, Median and ModeMeasures of Central Tendency: Mean, Median and Mode
Measures of Central Tendency: Mean, Median and Mode
 
Kisan Call Centre - To harness potential of ICT in Agriculture by answer farm...
Kisan Call Centre - To harness potential of ICT in Agriculture by answer farm...Kisan Call Centre - To harness potential of ICT in Agriculture by answer farm...
Kisan Call Centre - To harness potential of ICT in Agriculture by answer farm...
 
Sports & Fitness Value Added Course FY..
Sports & Fitness Value Added Course FY..Sports & Fitness Value Added Course FY..
Sports & Fitness Value Added Course FY..
 
INDIA QUIZ 2024 RLAC DELHI UNIVERSITY.pptx
INDIA QUIZ 2024 RLAC DELHI UNIVERSITY.pptxINDIA QUIZ 2024 RLAC DELHI UNIVERSITY.pptx
INDIA QUIZ 2024 RLAC DELHI UNIVERSITY.pptx
 
SOCIAL AND HISTORICAL CONTEXT - LFTVD.pptx
SOCIAL AND HISTORICAL CONTEXT - LFTVD.pptxSOCIAL AND HISTORICAL CONTEXT - LFTVD.pptx
SOCIAL AND HISTORICAL CONTEXT - LFTVD.pptx
 
1029 - Danh muc Sach Giao Khoa 10 . pdf
1029 -  Danh muc Sach Giao Khoa 10 . pdf1029 -  Danh muc Sach Giao Khoa 10 . pdf
1029 - Danh muc Sach Giao Khoa 10 . pdf
 
General AI for Medical Educators April 2024
General AI for Medical Educators April 2024General AI for Medical Educators April 2024
General AI for Medical Educators April 2024
 
Z Score,T Score, Percential Rank and Box Plot Graph
Z Score,T Score, Percential Rank and Box Plot GraphZ Score,T Score, Percential Rank and Box Plot Graph
Z Score,T Score, Percential Rank and Box Plot Graph
 
Código Creativo y Arte de Software | Unidad 1
Código Creativo y Arte de Software | Unidad 1Código Creativo y Arte de Software | Unidad 1
Código Creativo y Arte de Software | Unidad 1
 
The basics of sentences session 2pptx copy.pptx
The basics of sentences session 2pptx copy.pptxThe basics of sentences session 2pptx copy.pptx
The basics of sentences session 2pptx copy.pptx
 
Introduction to Nonprofit Accounting: The Basics
Introduction to Nonprofit Accounting: The BasicsIntroduction to Nonprofit Accounting: The Basics
Introduction to Nonprofit Accounting: The Basics
 

Symmetry and Skew

  • 1. 0–29 8 6 4 2 0 Test Result in % The Shape of Graphed Results involves Symmetry and Skew
  • 2. 0–29 8 6 4 2 0 Test Result in % There are a small number of students who have done well, which makes this Graph stretch out horizontally to the right. Going to the Right is Positive, so it has “Positive Skew”
  • 3. 0–29 8 6 4 2 0 Test Result in % The Kangaroo fits onto our graph with its tail going to the RIGHT. Going to the Right is Positive, so it has “Positive Skew”
  • 4. 0–29 8 6 4 2 0 Test Result in % This particular group has lots of Low scores and has not performed well. The Mode will be to the left of the Median, and the Mean to the right. Mode < Median < Mean
  • 5. 0–29 8 6 4 2 0 Test Result in % There are a small number of students who have done poorly, which makes this Graph stretch out horizontally to the left. Going to the Left is Negative, so it has “Negative Skew”
  • 6. 0–29 8 6 4 2 0 Test Result in % The Kangaroo fits onto our graph with its tail going to the LEFT. Going to the Left is Negative, so it has “Negative Skew”
  • 7. 0–29 8 6 4 2 0 Test Result in % This particular class has lots of High scores and has performed very well. The Mode will be to the right of the Median, and the Mean to the left. Mean < Median < Mode
  • 8. 0–29 8 6 4 2 0 Test Result in % This particular class is fairly normal and has both low and high scores. This graph stretches out evenly on both sides of the Mode at 60-69. The Graph is “Symmetrical”
  • 9. 0–29 8 6 4 2 0 Test Result in % Two identical Kangaroos show this graph is a mirror image type shape. The Graph is “Symmetrical”
  • 10. 0–29 8 6 4 2 0 Test Result in % This particular class is fairly normal and has both low and high scores. The Mean, Median, and Mode will all be close together in the middle. Mean ~ Median ~ Mode
  • 11. The Kangaroo fits onto our graph with its tail going to the RIGHT. Going to the Right is Positive, so it has “Positive Skew” Stem Leaf 0 1 1 2 4 7 8 1 2 2 3 5 6 6 8 9 2 1 5 6 7 7 8 8 9 9 9 3 2 4 4 5 7 7 8 4 1 3 5 8 5 2 3 7 6 2 3 4 7 2 6 8 3 9 2 Look at the S&L Plot sideways, and form a rotated 90 degrees view StemLeaf 0112478 122356689 21567788999 32445778 41358 5237 6234 726 83 92
  • 12. The Kangaroo fits onto our graph with its tail going to the LEFT. Going to the Left is Negative, so it has “Negative Skew” Stem Leaf 0 1 1 2 2 1 5 3 2 4 8 4 1 3 5 5 2 3 7 6 2 3 4 5 6 6 7 7 7 2 2 5 5 6 7 7 7 8 8 9 8 1 3 4 4 5 6 6 7 7 7 9 2 3 4 5 6 6 7 8 StemLeaf 01 12 215 3248 4135 5237 623456677 722556777889 81344566777 923456678 Look at the S&L Plot sideways to form a rotated 90 degrees view
  • 13. Stem Leaf 0 1 2 1 2 4 6 2 1 5 6 6 3 2 4 8 8 9 4 1 3 5 6 7 7 8 5 2 3 4 5 6 6 9 9 9 6 2 3 4 5 6 6 7 7 2 2 5 5 6 8 1 3 4 7 9 2 3 5 Look from the side of the S&L Plot and form a rotated 90 degrees view StemLeaf 012 1246 21566 324889 41356778 5234566999 62345667 722556 81347 9235 Two identical Kangaroos show this graph is a mirror image type shape. The S&L Plot is “Symmetrical”
  • 14. SYMMETRIC RIGHT LEFT DATA SKEWED SKEWED 3 7 3 58 3 0 4 36 4 013345569 4 5 5 017 5 2446 5 6 1120 6 17 6 2 7 356789 7 7 17 8 0158 8 2 8 2445 9 43 9 5 9 012235569 10 0 10 0 10 000