SlideShare una empresa de Scribd logo
1 de 9
Stem and Leaf Plot
Consists of
 Numbers on the left, called the stem
  (does not include the ones place)
 Numbers on the right, called the leaf
  (ones place)
Works well when
 the data contains more than 25 elements;
 the data is collected in a frequency table;
 the data values span many “tens” of
  values.
Stem and Leaf Plot

1, 5 , 5 , 8 , 8 , 8 , 10 , 12 , 12 , 13 , 14 ,
2 0 , 2 3 , 5 9 , 8 2 , 112
           stem             leaf
Advantages of
             Stem and Leaf Plots
   It can be used to quickly organize a large list of
    data values.
   It is convenient to use in determining median or
    mode of a data set quickly.
   Outliers, data clusters, or gaps are easily
    visible.
               Disadvantages of
              Stem and Leaf Plots
   A stem and leaf plot is not very informative for a small
    set of data.
Bar Graph
Consists of
 bars of the same width drawn either horizontally
  or vertically;
 bars whose length (or height) represents the
  frequencies of each value in a data set.
Works well when
 the data is numerical or categorical;
 the data is discrete;
 the data is collected using a frequency table.
Bar Graph Example
Advantages of Bar Graphs
   The mode is easily visible.
   A bar graph can be used with numerical or
    categorical data.


    Disadvantages of Bar Graphs
   A bar graph shows only the frequencies of the
    elements of a data set.
Histogram
Consists of
 e q u a l i n t e r v a l s marked on the
  horizontal axis;
 bars of equal width drawn for each interval
  (There is n o s p a c e between the bars.)

Works well when
 the data has a really big range
 there is one set of data
 the data is collected using a frequency table.
Histogram Example


   70-74 75-79 80-84 85-89 90-94 95-99
Advantages of Histograms
        A histogram provides a way to display the
         frequency of occurrences of data along an
         interval.


        Disadvantages of Histograms
       The use of intervals prevents the calculation of
        an exact measure of central tendency.

Más contenido relacionado

La actualidad más candente

Inferential statistics.ppt
Inferential statistics.pptInferential statistics.ppt
Inferential statistics.ppt
Nursing Path
 
null and alternative hypothesis.pptx
null and alternative hypothesis.pptxnull and alternative hypothesis.pptx
null and alternative hypothesis.pptx
CherrylPaderSagun
 
Descriptive statistics
Descriptive statisticsDescriptive statistics
Descriptive statistics
Aileen Balbido
 
Cumulative frequency
Cumulative frequencyCumulative frequency
Cumulative frequency
MrGarvey
 

La actualidad más candente (20)

Inferential statistics.ppt
Inferential statistics.pptInferential statistics.ppt
Inferential statistics.ppt
 
Descriptive statistics i
Descriptive statistics iDescriptive statistics i
Descriptive statistics i
 
Descriptive Statistics
Descriptive StatisticsDescriptive Statistics
Descriptive Statistics
 
Data Analysis and Statistics
Data Analysis and StatisticsData Analysis and Statistics
Data Analysis and Statistics
 
null and alternative hypothesis.pptx
null and alternative hypothesis.pptxnull and alternative hypothesis.pptx
null and alternative hypothesis.pptx
 
Measure of central tendency
Measure of central tendencyMeasure of central tendency
Measure of central tendency
 
Frequency Distribution
Frequency DistributionFrequency Distribution
Frequency Distribution
 
Introduction to Statistics
Introduction to StatisticsIntroduction to Statistics
Introduction to Statistics
 
Scatter Diagram
Scatter DiagramScatter Diagram
Scatter Diagram
 
Types of variables in statistics
Types of variables in statisticsTypes of variables in statistics
Types of variables in statistics
 
Descriptive statistics
Descriptive statisticsDescriptive statistics
Descriptive statistics
 
Measures of central tendency
Measures of central tendencyMeasures of central tendency
Measures of central tendency
 
Descriptive statistics
Descriptive statisticsDescriptive statistics
Descriptive statistics
 
Descriptive Statistics
Descriptive StatisticsDescriptive Statistics
Descriptive Statistics
 
Types of graphs
Types of graphsTypes of graphs
Types of graphs
 
Two-Way ANOVA Overview & SPSS interpretation
Two-Way ANOVA Overview & SPSS interpretationTwo-Way ANOVA Overview & SPSS interpretation
Two-Way ANOVA Overview & SPSS interpretation
 
Data organization
Data organizationData organization
Data organization
 
Cumulative frequency
Cumulative frequencyCumulative frequency
Cumulative frequency
 
Tabular and Graphical Representation of Data
Tabular and Graphical Representation of Data Tabular and Graphical Representation of Data
Tabular and Graphical Representation of Data
 
Skewness and kurtosis
Skewness and kurtosisSkewness and kurtosis
Skewness and kurtosis
 

Destacado (15)

Boxplot
BoxplotBoxplot
Boxplot
 
Harmonic Mean for Monitored Rate Data
Harmonic Mean for Monitored Rate DataHarmonic Mean for Monitored Rate Data
Harmonic Mean for Monitored Rate Data
 
stem and leaf diagrams
 stem and leaf diagrams stem and leaf diagrams
stem and leaf diagrams
 
Regression analysis
Regression analysisRegression analysis
Regression analysis
 
Stem and-leaf plots
Stem and-leaf plotsStem and-leaf plots
Stem and-leaf plots
 
2.3 stem and leaf displays
2.3 stem and leaf displays2.3 stem and leaf displays
2.3 stem and leaf displays
 
Statistical measures box plots
Statistical measures   box plotsStatistical measures   box plots
Statistical measures box plots
 
Stem and-leaf-diagram-ppt.-dfs
Stem and-leaf-diagram-ppt.-dfsStem and-leaf-diagram-ppt.-dfs
Stem and-leaf-diagram-ppt.-dfs
 
Bar Graph
Bar GraphBar Graph
Bar Graph
 
Regression analysis
Regression analysisRegression analysis
Regression analysis
 
Moments in statistics
Moments in statisticsMoments in statistics
Moments in statistics
 
Presentation On Regression
Presentation On RegressionPresentation On Regression
Presentation On Regression
 
Bar chart
Bar chartBar chart
Bar chart
 
Skewness
SkewnessSkewness
Skewness
 
Skewness & Kurtosis
Skewness & KurtosisSkewness & Kurtosis
Skewness & Kurtosis
 

Similar a Stem & leaf, Bar graphs, and Histograms

Geographical Skills
Geographical SkillsGeographical Skills
Geographical Skills
clemaitre
 
Graphicalrepresntationofdatausingstatisticaltools2019_210902_105156.pdf
Graphicalrepresntationofdatausingstatisticaltools2019_210902_105156.pdfGraphicalrepresntationofdatausingstatisticaltools2019_210902_105156.pdf
Graphicalrepresntationofdatausingstatisticaltools2019_210902_105156.pdf
Himakshi7
 
Data Representations
Data RepresentationsData Representations
Data Representations
bujols
 
DATA STRUCTURE AND ALGORITJM POWERPOINT.ppt
DATA STRUCTURE AND ALGORITJM POWERPOINT.pptDATA STRUCTURE AND ALGORITJM POWERPOINT.ppt
DATA STRUCTURE AND ALGORITJM POWERPOINT.ppt
yarotos643
 
Aed1222 lesson 6
Aed1222 lesson 6Aed1222 lesson 6
Aed1222 lesson 6
nurun2010
 
Aed1222 lesson 6 2nd part
Aed1222 lesson 6 2nd partAed1222 lesson 6 2nd part
Aed1222 lesson 6 2nd part
nurun2010
 
Displaying data using charts and graphs
Displaying data using charts and graphsDisplaying data using charts and graphs
Displaying data using charts and graphs
Charles Flynt
 
data structure details of types and .ppt
data structure details of types and .pptdata structure details of types and .ppt
data structure details of types and .ppt
poonamsngr
 
MSC III_Research Methodology and Statistics_Descriptive statistics.pdf
MSC III_Research Methodology and Statistics_Descriptive statistics.pdfMSC III_Research Methodology and Statistics_Descriptive statistics.pdf
MSC III_Research Methodology and Statistics_Descriptive statistics.pdf
Suchita Rawat
 

Similar a Stem & leaf, Bar graphs, and Histograms (20)

Geographical Skills
Geographical SkillsGeographical Skills
Geographical Skills
 
Graphs(Biostatistics and Research Methodology) B.pharmacy(8th sem.)
Graphs(Biostatistics and Research Methodology) B.pharmacy(8th sem.)Graphs(Biostatistics and Research Methodology) B.pharmacy(8th sem.)
Graphs(Biostatistics and Research Methodology) B.pharmacy(8th sem.)
 
data structure programing language in c.ppt
data structure programing language in c.pptdata structure programing language in c.ppt
data structure programing language in c.ppt
 
Graphicalrepresntationofdatausingstatisticaltools2019_210902_105156.pdf
Graphicalrepresntationofdatausingstatisticaltools2019_210902_105156.pdfGraphicalrepresntationofdatausingstatisticaltools2019_210902_105156.pdf
Graphicalrepresntationofdatausingstatisticaltools2019_210902_105156.pdf
 
3.1 Measures of center
3.1 Measures of center3.1 Measures of center
3.1 Measures of center
 
Data Representations
Data RepresentationsData Representations
Data Representations
 
Wynberg girls high-Jade Gibson-maths-data analysis statistics
Wynberg girls high-Jade Gibson-maths-data analysis statisticsWynberg girls high-Jade Gibson-maths-data analysis statistics
Wynberg girls high-Jade Gibson-maths-data analysis statistics
 
Numpy ndarrays.pdf
Numpy ndarrays.pdfNumpy ndarrays.pdf
Numpy ndarrays.pdf
 
Descriptive statistics
Descriptive statisticsDescriptive statistics
Descriptive statistics
 
Statistics and probability 1
Statistics and probability 1Statistics and probability 1
Statistics and probability 1
 
3. data visualisations
3. data visualisations3. data visualisations
3. data visualisations
 
graphic representations in statistics
 graphic representations in statistics graphic representations in statistics
graphic representations in statistics
 
Data presentation
Data presentationData presentation
Data presentation
 
DATA STRUCTURE AND ALGORITJM POWERPOINT.ppt
DATA STRUCTURE AND ALGORITJM POWERPOINT.pptDATA STRUCTURE AND ALGORITJM POWERPOINT.ppt
DATA STRUCTURE AND ALGORITJM POWERPOINT.ppt
 
Aed1222 lesson 6
Aed1222 lesson 6Aed1222 lesson 6
Aed1222 lesson 6
 
Aed1222 lesson 6 2nd part
Aed1222 lesson 6 2nd partAed1222 lesson 6 2nd part
Aed1222 lesson 6 2nd part
 
Displaying data using charts and graphs
Displaying data using charts and graphsDisplaying data using charts and graphs
Displaying data using charts and graphs
 
PM.ppt
PM.pptPM.ppt
PM.ppt
 
data structure details of types and .ppt
data structure details of types and .pptdata structure details of types and .ppt
data structure details of types and .ppt
 
MSC III_Research Methodology and Statistics_Descriptive statistics.pdf
MSC III_Research Methodology and Statistics_Descriptive statistics.pdfMSC III_Research Methodology and Statistics_Descriptive statistics.pdf
MSC III_Research Methodology and Statistics_Descriptive statistics.pdf
 

Más de bujols

Surface area of Cylinders and HW
Surface area of Cylinders and HWSurface area of Cylinders and HW
Surface area of Cylinders and HW
bujols
 
Scientific notation explaination positve
Scientific notation explaination positveScientific notation explaination positve
Scientific notation explaination positve
bujols
 
Volume of Prisms
Volume of PrismsVolume of Prisms
Volume of Prisms
bujols
 
Circles
CirclesCircles
Circles
bujols
 
Area of triangles and trapezoids
Area of triangles and trapezoidsArea of triangles and trapezoids
Area of triangles and trapezoids
bujols
 
Area and perimeter of parallelograms
Area and perimeter of parallelogramsArea and perimeter of parallelograms
Area and perimeter of parallelograms
bujols
 
Translations
TranslationsTranslations
Translations
bujols
 
Reflections
ReflectionsReflections
Reflections
bujols
 
Warm-Ups for January 14-18, 2013
Warm-Ups for January 14-18, 2013Warm-Ups for January 14-18, 2013
Warm-Ups for January 14-18, 2013
bujols
 
Warm-Ups for January 7-11
Warm-Ups for January 7-11Warm-Ups for January 7-11
Warm-Ups for January 7-11
bujols
 
Modeling 2 Step Equations
Modeling 2 Step EquationsModeling 2 Step Equations
Modeling 2 Step Equations
bujols
 
Modeling one step equations
Modeling one step equationsModeling one step equations
Modeling one step equations
bujols
 
Expression Notes
Expression NotesExpression Notes
Expression Notes
bujols
 
Percent Bars
Percent BarsPercent Bars
Percent Bars
bujols
 
Sales Tax and Total Cost
Sales Tax and Total CostSales Tax and Total Cost
Sales Tax and Total Cost
bujols
 
Discount and Sale Price
Discount and Sale PriceDiscount and Sale Price
Discount and Sale Price
bujols
 
October 9 12, 2012
October 9 12, 2012October 9 12, 2012
October 9 12, 2012
bujols
 
Warm-ups Week of October 5, 2012
Warm-ups Week of October 5, 2012Warm-ups Week of October 5, 2012
Warm-ups Week of October 5, 2012
bujols
 
Order of Operations
Order of OperationsOrder of Operations
Order of Operations
bujols
 
Order of Operations
Order of OperationsOrder of Operations
Order of Operations
bujols
 

Más de bujols (20)

Surface area of Cylinders and HW
Surface area of Cylinders and HWSurface area of Cylinders and HW
Surface area of Cylinders and HW
 
Scientific notation explaination positve
Scientific notation explaination positveScientific notation explaination positve
Scientific notation explaination positve
 
Volume of Prisms
Volume of PrismsVolume of Prisms
Volume of Prisms
 
Circles
CirclesCircles
Circles
 
Area of triangles and trapezoids
Area of triangles and trapezoidsArea of triangles and trapezoids
Area of triangles and trapezoids
 
Area and perimeter of parallelograms
Area and perimeter of parallelogramsArea and perimeter of parallelograms
Area and perimeter of parallelograms
 
Translations
TranslationsTranslations
Translations
 
Reflections
ReflectionsReflections
Reflections
 
Warm-Ups for January 14-18, 2013
Warm-Ups for January 14-18, 2013Warm-Ups for January 14-18, 2013
Warm-Ups for January 14-18, 2013
 
Warm-Ups for January 7-11
Warm-Ups for January 7-11Warm-Ups for January 7-11
Warm-Ups for January 7-11
 
Modeling 2 Step Equations
Modeling 2 Step EquationsModeling 2 Step Equations
Modeling 2 Step Equations
 
Modeling one step equations
Modeling one step equationsModeling one step equations
Modeling one step equations
 
Expression Notes
Expression NotesExpression Notes
Expression Notes
 
Percent Bars
Percent BarsPercent Bars
Percent Bars
 
Sales Tax and Total Cost
Sales Tax and Total CostSales Tax and Total Cost
Sales Tax and Total Cost
 
Discount and Sale Price
Discount and Sale PriceDiscount and Sale Price
Discount and Sale Price
 
October 9 12, 2012
October 9 12, 2012October 9 12, 2012
October 9 12, 2012
 
Warm-ups Week of October 5, 2012
Warm-ups Week of October 5, 2012Warm-ups Week of October 5, 2012
Warm-ups Week of October 5, 2012
 
Order of Operations
Order of OperationsOrder of Operations
Order of Operations
 
Order of Operations
Order of OperationsOrder of Operations
Order of Operations
 

Último

Why Teams call analytics are critical to your entire business
Why Teams call analytics are critical to your entire businessWhy Teams call analytics are critical to your entire business
Why Teams call analytics are critical to your entire business
panagenda
 
Artificial Intelligence: Facts and Myths
Artificial Intelligence: Facts and MythsArtificial Intelligence: Facts and Myths
Artificial Intelligence: Facts and Myths
Joaquim Jorge
 
+971581248768>> SAFE AND ORIGINAL ABORTION PILLS FOR SALE IN DUBAI AND ABUDHA...
+971581248768>> SAFE AND ORIGINAL ABORTION PILLS FOR SALE IN DUBAI AND ABUDHA...+971581248768>> SAFE AND ORIGINAL ABORTION PILLS FOR SALE IN DUBAI AND ABUDHA...
+971581248768>> SAFE AND ORIGINAL ABORTION PILLS FOR SALE IN DUBAI AND ABUDHA...
?#DUbAI#??##{{(☎️+971_581248768%)**%*]'#abortion pills for sale in dubai@
 
Cloud Frontiers: A Deep Dive into Serverless Spatial Data and FME
Cloud Frontiers:  A Deep Dive into Serverless Spatial Data and FMECloud Frontiers:  A Deep Dive into Serverless Spatial Data and FME
Cloud Frontiers: A Deep Dive into Serverless Spatial Data and FME
Safe Software
 

Último (20)

Top 5 Benefits OF Using Muvi Live Paywall For Live Streams
Top 5 Benefits OF Using Muvi Live Paywall For Live StreamsTop 5 Benefits OF Using Muvi Live Paywall For Live Streams
Top 5 Benefits OF Using Muvi Live Paywall For Live Streams
 
Why Teams call analytics are critical to your entire business
Why Teams call analytics are critical to your entire businessWhy Teams call analytics are critical to your entire business
Why Teams call analytics are critical to your entire business
 
Automating Google Workspace (GWS) & more with Apps Script
Automating Google Workspace (GWS) & more with Apps ScriptAutomating Google Workspace (GWS) & more with Apps Script
Automating Google Workspace (GWS) & more with Apps Script
 
A Domino Admins Adventures (Engage 2024)
A Domino Admins Adventures (Engage 2024)A Domino Admins Adventures (Engage 2024)
A Domino Admins Adventures (Engage 2024)
 
Exploring the Future Potential of AI-Enabled Smartphone Processors
Exploring the Future Potential of AI-Enabled Smartphone ProcessorsExploring the Future Potential of AI-Enabled Smartphone Processors
Exploring the Future Potential of AI-Enabled Smartphone Processors
 
Artificial Intelligence: Facts and Myths
Artificial Intelligence: Facts and MythsArtificial Intelligence: Facts and Myths
Artificial Intelligence: Facts and Myths
 
From Event to Action: Accelerate Your Decision Making with Real-Time Automation
From Event to Action: Accelerate Your Decision Making with Real-Time AutomationFrom Event to Action: Accelerate Your Decision Making with Real-Time Automation
From Event to Action: Accelerate Your Decision Making with Real-Time Automation
 
TrustArc Webinar - Stay Ahead of US State Data Privacy Law Developments
TrustArc Webinar - Stay Ahead of US State Data Privacy Law DevelopmentsTrustArc Webinar - Stay Ahead of US State Data Privacy Law Developments
TrustArc Webinar - Stay Ahead of US State Data Privacy Law Developments
 
Polkadot JAM Slides - Token2049 - By Dr. Gavin Wood
Polkadot JAM Slides - Token2049 - By Dr. Gavin WoodPolkadot JAM Slides - Token2049 - By Dr. Gavin Wood
Polkadot JAM Slides - Token2049 - By Dr. Gavin Wood
 
Top 10 Most Downloaded Games on Play Store in 2024
Top 10 Most Downloaded Games on Play Store in 2024Top 10 Most Downloaded Games on Play Store in 2024
Top 10 Most Downloaded Games on Play Store in 2024
 
+971581248768>> SAFE AND ORIGINAL ABORTION PILLS FOR SALE IN DUBAI AND ABUDHA...
+971581248768>> SAFE AND ORIGINAL ABORTION PILLS FOR SALE IN DUBAI AND ABUDHA...+971581248768>> SAFE AND ORIGINAL ABORTION PILLS FOR SALE IN DUBAI AND ABUDHA...
+971581248768>> SAFE AND ORIGINAL ABORTION PILLS FOR SALE IN DUBAI AND ABUDHA...
 
Strategize a Smooth Tenant-to-tenant Migration and Copilot Takeoff
Strategize a Smooth Tenant-to-tenant Migration and Copilot TakeoffStrategize a Smooth Tenant-to-tenant Migration and Copilot Takeoff
Strategize a Smooth Tenant-to-tenant Migration and Copilot Takeoff
 
How to Troubleshoot Apps for the Modern Connected Worker
How to Troubleshoot Apps for the Modern Connected WorkerHow to Troubleshoot Apps for the Modern Connected Worker
How to Troubleshoot Apps for the Modern Connected Worker
 
Apidays New York 2024 - The value of a flexible API Management solution for O...
Apidays New York 2024 - The value of a flexible API Management solution for O...Apidays New York 2024 - The value of a flexible API Management solution for O...
Apidays New York 2024 - The value of a flexible API Management solution for O...
 
Boost PC performance: How more available memory can improve productivity
Boost PC performance: How more available memory can improve productivityBoost PC performance: How more available memory can improve productivity
Boost PC performance: How more available memory can improve productivity
 
Strategies for Landing an Oracle DBA Job as a Fresher
Strategies for Landing an Oracle DBA Job as a FresherStrategies for Landing an Oracle DBA Job as a Fresher
Strategies for Landing an Oracle DBA Job as a Fresher
 
Tata AIG General Insurance Company - Insurer Innovation Award 2024
Tata AIG General Insurance Company - Insurer Innovation Award 2024Tata AIG General Insurance Company - Insurer Innovation Award 2024
Tata AIG General Insurance Company - Insurer Innovation Award 2024
 
Apidays Singapore 2024 - Building Digital Trust in a Digital Economy by Veron...
Apidays Singapore 2024 - Building Digital Trust in a Digital Economy by Veron...Apidays Singapore 2024 - Building Digital Trust in a Digital Economy by Veron...
Apidays Singapore 2024 - Building Digital Trust in a Digital Economy by Veron...
 
AWS Community Day CPH - Three problems of Terraform
AWS Community Day CPH - Three problems of TerraformAWS Community Day CPH - Three problems of Terraform
AWS Community Day CPH - Three problems of Terraform
 
Cloud Frontiers: A Deep Dive into Serverless Spatial Data and FME
Cloud Frontiers:  A Deep Dive into Serverless Spatial Data and FMECloud Frontiers:  A Deep Dive into Serverless Spatial Data and FME
Cloud Frontiers: A Deep Dive into Serverless Spatial Data and FME
 

Stem & leaf, Bar graphs, and Histograms

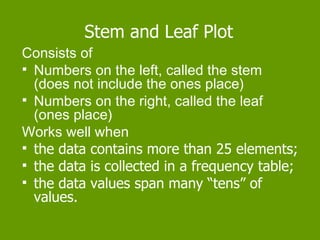
  • 1. Stem and Leaf Plot Consists of  Numbers on the left, called the stem (does not include the ones place)  Numbers on the right, called the leaf (ones place) Works well when  the data contains more than 25 elements;  the data is collected in a frequency table;  the data values span many “tens” of values.
  • 2. Stem and Leaf Plot 1, 5 , 5 , 8 , 8 , 8 , 10 , 12 , 12 , 13 , 14 , 2 0 , 2 3 , 5 9 , 8 2 , 112 stem leaf
  • 3. Advantages of Stem and Leaf Plots  It can be used to quickly organize a large list of data values.  It is convenient to use in determining median or mode of a data set quickly.  Outliers, data clusters, or gaps are easily visible. Disadvantages of Stem and Leaf Plots  A stem and leaf plot is not very informative for a small set of data.
  • 4. Bar Graph Consists of  bars of the same width drawn either horizontally or vertically;  bars whose length (or height) represents the frequencies of each value in a data set. Works well when  the data is numerical or categorical;  the data is discrete;  the data is collected using a frequency table.
  • 6. Advantages of Bar Graphs  The mode is easily visible.  A bar graph can be used with numerical or categorical data. Disadvantages of Bar Graphs  A bar graph shows only the frequencies of the elements of a data set.
  • 7. Histogram Consists of  e q u a l i n t e r v a l s marked on the horizontal axis;  bars of equal width drawn for each interval (There is n o s p a c e between the bars.) Works well when  the data has a really big range  there is one set of data  the data is collected using a frequency table.
  • 8. Histogram Example 70-74 75-79 80-84 85-89 90-94 95-99
  • 9. Advantages of Histograms  A histogram provides a way to display the frequency of occurrences of data along an interval. Disadvantages of Histograms  The use of intervals prevents the calculation of an exact measure of central tendency.