SlideShare una empresa de Scribd logo
1 de 1
Descargar para leer sin conexión
Emisiones de CO2 en Centroamérica y el Caribe. 2007
Desarollo económico, población y contaminación
                                                                                                                                    Toneladas CO2 per cápita
                                                                                                                                                                                                                                      Población, PIB y emisiones de CO2 en Panamá.
                                                                                                                                                                                                                                      Años: 1971- 2007
                                                                                                                                                                                                                                      30.0
                                                                                                                                     1      4          10          > 10                                                                            Población (mil-
                                                                                                                                                                                                                                      25.0         lones hab.)
                                                                       Cuba
                                                                       2.32                                                                                                                                                           20.0
                                                                                                                                                                                                                                                   Emisiones CO2
                                                                                                                                                                                                                                                   (millones tons)
                                                                              Jamaica                                      Haití                                                                                                      15.0
                                                                                                                                                                                                                                                   PIB (billones $)
                                                                              4.74                                         0.24
                                                                                                                                            Rep. Dominicana                                                                           10.0

                                                                                                                                            1.98
                                                                                                                                                                                                                                       5.0


                                                                                                                                                                                                                                         -
                                             Honduras                                                                                                                                                                                    1971 1974 1977 1980 1983 1986 1989 1992 1995 1998 2001 2004 2007
      Guatemala                              1.15
      0.88                                                                                                                                                                                                                                                                         Años

                                                                                                                                            Antillas Holandesas
                                                    Nicaragua                                                                               23.57                                                                                            Emisiones de CO2 por sector en Panamá
              El Salvador                           0.79
              0.91
                                                                                                                                                                                                   Trinidad y Tobago
                                                                                                                                                                                                   21.85                                            Producción de electricidad y calor                                 612
                                                         Costa Rica
                                                         1.47                                                       Colombia                                   Venezuela
                                                              Panamá                                                1.21                                       5.24                                                                                    Autoproductores no localizados               2
                                                              1.94

                                                                                                                                                                                                                                              Industria manufacturera y construcción                            315


PIB (billones de dólares)                                         Población (millones habs.)                                                           Emisiones (millones tons C02)
                                                                                                                                                                                                                                                                                 Transporte                                    872
           Colombia                                   389.6                  Colombia                                                           46.1                Venezuela                                         143.8

           Venezuela                        190.0                            Venezuela                                       27.5                                    Colombia                        55.9
                                                                                                                                                                                                                                                                                  Carretera                      390
               Cuba                  98.5                                   Guatemala                            13.3                                        Trinidad y Tobago               29.1

República Dominicana                79.5                                                                                                                                  Cuba               26.2
                                                                                 Cuba                        11.3
                                                                                                                                                       República Dominicana                 19.3
          Guatemala               58.4                            República Dominicana                     9.8                                                                                                                                                              Otros sectores                141
                                                                                                                                                                      Jamaica          12.7
          Costa Rica              46.0                                            Haiti                    9.6
                                                                                                                                                                    Guatemala          11.7
          El Salvador         35.2                                                                                                                                                                                                                                                              -                500           1 000
                                                                             Honduras                 7.1
                                                                                                                                                                     Honduras          8.2                                                                                                              Kg de CO2 per cápita
           Honduras           31.2                                          El Salvador               6.9
                                                                                                                                                                    Costa Rica        6.6
             Panama          26.7                                            Nicaragua               5.6
                                                                                                                                                                      Panama          6.5
    Trinidad y Tobago        20.3                                           Costa Rica              4.5
                                                                                                                                                                   El Salvador        6.2
           Nicaragua         19.4                                              Panama           3.3                                                                                                                                   Fuente: International Energy Agency. CO2 Emissions
                                                                                                                                                                       Uruguay        5.7                                             from fuel combustion. Highlights. 2009. Todos los datos
                Haiti       13.2                                                                                                                                                                                                      referidos a 2007
                                                                              Jamaica           2.7                                                         Antillas Holandesas       4.5                                             Mapas, gráficos, cuadros y textos preparados por:
                                                                                                                                                                                                                                      Carlos A. Gordón
            Jamaica         9.6                                       Trinidad y Tobago        1.3                                                                   Nicaragua        4.4                                             carlosg16@gmail.com
                                                                                                                                                                                                                                      www.mapeandopanama.blogspot.com
  Antillas Holandesas       2.9                                     Antillas Holandesas       0.2                                                                         Haiti       2.3                                             www.metromapas.net
                                                                                                                                                                                                                                      Infografía elaborada con fines didácticos y de
                        -         100.0 200.0 300.0 400.0 500.0                           -           10.0          20.0    30.0     40.0       50.0                              -           50.0          100.0   150.0     200.0   divulgación. No para fines comerciales.

Más contenido relacionado

Último

senati-powerpoint_5TOS-_ALUMNOS (1).pptx
senati-powerpoint_5TOS-_ALUMNOS (1).pptxsenati-powerpoint_5TOS-_ALUMNOS (1).pptx
senati-powerpoint_5TOS-_ALUMNOS (1).pptx
nathalypaolaacostasu
 
Comparativo DS 024-2016-EM vs DS 023-2017-EM - 21.08.17 (1).pdf
Comparativo DS 024-2016-EM vs DS 023-2017-EM - 21.08.17 (1).pdfComparativo DS 024-2016-EM vs DS 023-2017-EM - 21.08.17 (1).pdf
Comparativo DS 024-2016-EM vs DS 023-2017-EM - 21.08.17 (1).pdf
AJYSCORP
 
Ejemplo Caso: El Juego de la negociación
Ejemplo Caso: El Juego de la negociaciónEjemplo Caso: El Juego de la negociación
Ejemplo Caso: El Juego de la negociación
licmarinaglez
 
SENTENCIA COLOMBIA DISCRIMINACION SELECCION PERSONAL.pdf
SENTENCIA COLOMBIA DISCRIMINACION SELECCION PERSONAL.pdfSENTENCIA COLOMBIA DISCRIMINACION SELECCION PERSONAL.pdf
SENTENCIA COLOMBIA DISCRIMINACION SELECCION PERSONAL.pdf
JaredQuezada3
 
Tesis_liderazgo_desempeño_laboral_colaboradores_cooperativa_agraria_rutas_Inc...
Tesis_liderazgo_desempeño_laboral_colaboradores_cooperativa_agraria_rutas_Inc...Tesis_liderazgo_desempeño_laboral_colaboradores_cooperativa_agraria_rutas_Inc...
Tesis_liderazgo_desempeño_laboral_colaboradores_cooperativa_agraria_rutas_Inc...
MIGUELANGELLEGUIAGUZ
 

Último (20)

2 Tipo Sociedad comandita por acciones.pptx
2 Tipo Sociedad comandita por acciones.pptx2 Tipo Sociedad comandita por acciones.pptx
2 Tipo Sociedad comandita por acciones.pptx
 
senati-powerpoint_5TOS-_ALUMNOS (1).pptx
senati-powerpoint_5TOS-_ALUMNOS (1).pptxsenati-powerpoint_5TOS-_ALUMNOS (1).pptx
senati-powerpoint_5TOS-_ALUMNOS (1).pptx
 
mapa-conceptual-evidencias-de-auditoria_compress.pdf
mapa-conceptual-evidencias-de-auditoria_compress.pdfmapa-conceptual-evidencias-de-auditoria_compress.pdf
mapa-conceptual-evidencias-de-auditoria_compress.pdf
 
el impuesto genera A LAS LAS lasventas IGV
el impuesto genera A LAS  LAS lasventas IGVel impuesto genera A LAS  LAS lasventas IGV
el impuesto genera A LAS LAS lasventas IGV
 
Comparativo DS 024-2016-EM vs DS 023-2017-EM - 21.08.17 (1).pdf
Comparativo DS 024-2016-EM vs DS 023-2017-EM - 21.08.17 (1).pdfComparativo DS 024-2016-EM vs DS 023-2017-EM - 21.08.17 (1).pdf
Comparativo DS 024-2016-EM vs DS 023-2017-EM - 21.08.17 (1).pdf
 
implemenatcion de un data mart en logistica
implemenatcion de un data mart en logisticaimplemenatcion de un data mart en logistica
implemenatcion de un data mart en logistica
 
Fabricación de Cremas en Industria Farmacéutica
Fabricación de Cremas en Industria FarmacéuticaFabricación de Cremas en Industria Farmacéutica
Fabricación de Cremas en Industria Farmacéutica
 
Empresa Sazonadores Lopesa estudio de mercado
Empresa Sazonadores Lopesa estudio de mercadoEmpresa Sazonadores Lopesa estudio de mercado
Empresa Sazonadores Lopesa estudio de mercado
 
Caja nacional de salud 0&!(&:(_5+:;?)8-!!(
Caja nacional de salud 0&!(&:(_5+:;?)8-!!(Caja nacional de salud 0&!(&:(_5+:;?)8-!!(
Caja nacional de salud 0&!(&:(_5+:;?)8-!!(
 
Tarea-4-Estadistica-Descriptiva-Materia.ppt
Tarea-4-Estadistica-Descriptiva-Materia.pptTarea-4-Estadistica-Descriptiva-Materia.ppt
Tarea-4-Estadistica-Descriptiva-Materia.ppt
 
Analisis del art. 37 de la Ley del Impuesto a la Renta
Analisis del art. 37 de la Ley del Impuesto a la RentaAnalisis del art. 37 de la Ley del Impuesto a la Renta
Analisis del art. 37 de la Ley del Impuesto a la Renta
 
Ejemplo Caso: El Juego de la negociación
Ejemplo Caso: El Juego de la negociaciónEjemplo Caso: El Juego de la negociación
Ejemplo Caso: El Juego de la negociación
 
DERECHO EMPRESARIAL - SEMANA 01 UNIVERSIDAD CESAR VALLEJO
DERECHO EMPRESARIAL - SEMANA 01 UNIVERSIDAD CESAR VALLEJODERECHO EMPRESARIAL - SEMANA 01 UNIVERSIDAD CESAR VALLEJO
DERECHO EMPRESARIAL - SEMANA 01 UNIVERSIDAD CESAR VALLEJO
 
modulo+penal+del+16+al+20+hhggde+enero.pdf
modulo+penal+del+16+al+20+hhggde+enero.pdfmodulo+penal+del+16+al+20+hhggde+enero.pdf
modulo+penal+del+16+al+20+hhggde+enero.pdf
 
SENTENCIA COLOMBIA DISCRIMINACION SELECCION PERSONAL.pdf
SENTENCIA COLOMBIA DISCRIMINACION SELECCION PERSONAL.pdfSENTENCIA COLOMBIA DISCRIMINACION SELECCION PERSONAL.pdf
SENTENCIA COLOMBIA DISCRIMINACION SELECCION PERSONAL.pdf
 
Manual para las 3 clases de tsunami de ventas.pdf
Manual para las 3 clases de tsunami de ventas.pdfManual para las 3 clases de tsunami de ventas.pdf
Manual para las 3 clases de tsunami de ventas.pdf
 
La Cadena de suministro CocaCola Co.pptx
La Cadena de suministro CocaCola Co.pptxLa Cadena de suministro CocaCola Co.pptx
La Cadena de suministro CocaCola Co.pptx
 
Tesis_liderazgo_desempeño_laboral_colaboradores_cooperativa_agraria_rutas_Inc...
Tesis_liderazgo_desempeño_laboral_colaboradores_cooperativa_agraria_rutas_Inc...Tesis_liderazgo_desempeño_laboral_colaboradores_cooperativa_agraria_rutas_Inc...
Tesis_liderazgo_desempeño_laboral_colaboradores_cooperativa_agraria_rutas_Inc...
 
INFORMATIVO CIRCULAR FISCAL - RENTA 2023.ppsx
INFORMATIVO CIRCULAR FISCAL - RENTA 2023.ppsxINFORMATIVO CIRCULAR FISCAL - RENTA 2023.ppsx
INFORMATIVO CIRCULAR FISCAL - RENTA 2023.ppsx
 
INTERESES Y MULTAS DEL IMPUESTO A LA RENTA POWER POINT.pptx
INTERESES Y MULTAS DEL IMPUESTO A LA RENTA POWER POINT.pptxINTERESES Y MULTAS DEL IMPUESTO A LA RENTA POWER POINT.pptx
INTERESES Y MULTAS DEL IMPUESTO A LA RENTA POWER POINT.pptx
 

Destacado

How Race, Age and Gender Shape Attitudes Towards Mental Health
How Race, Age and Gender Shape Attitudes Towards Mental HealthHow Race, Age and Gender Shape Attitudes Towards Mental Health
How Race, Age and Gender Shape Attitudes Towards Mental Health
ThinkNow
 
Social Media Marketing Trends 2024 // The Global Indie Insights
Social Media Marketing Trends 2024 // The Global Indie InsightsSocial Media Marketing Trends 2024 // The Global Indie Insights
Social Media Marketing Trends 2024 // The Global Indie Insights
Kurio // The Social Media Age(ncy)
 

Destacado (20)

2024 State of Marketing Report – by Hubspot
2024 State of Marketing Report – by Hubspot2024 State of Marketing Report – by Hubspot
2024 State of Marketing Report – by Hubspot
 
Everything You Need To Know About ChatGPT
Everything You Need To Know About ChatGPTEverything You Need To Know About ChatGPT
Everything You Need To Know About ChatGPT
 
Product Design Trends in 2024 | Teenage Engineerings
Product Design Trends in 2024 | Teenage EngineeringsProduct Design Trends in 2024 | Teenage Engineerings
Product Design Trends in 2024 | Teenage Engineerings
 
How Race, Age and Gender Shape Attitudes Towards Mental Health
How Race, Age and Gender Shape Attitudes Towards Mental HealthHow Race, Age and Gender Shape Attitudes Towards Mental Health
How Race, Age and Gender Shape Attitudes Towards Mental Health
 
AI Trends in Creative Operations 2024 by Artwork Flow.pdf
AI Trends in Creative Operations 2024 by Artwork Flow.pdfAI Trends in Creative Operations 2024 by Artwork Flow.pdf
AI Trends in Creative Operations 2024 by Artwork Flow.pdf
 
Skeleton Culture Code
Skeleton Culture CodeSkeleton Culture Code
Skeleton Culture Code
 
PEPSICO Presentation to CAGNY Conference Feb 2024
PEPSICO Presentation to CAGNY Conference Feb 2024PEPSICO Presentation to CAGNY Conference Feb 2024
PEPSICO Presentation to CAGNY Conference Feb 2024
 
Content Methodology: A Best Practices Report (Webinar)
Content Methodology: A Best Practices Report (Webinar)Content Methodology: A Best Practices Report (Webinar)
Content Methodology: A Best Practices Report (Webinar)
 
How to Prepare For a Successful Job Search for 2024
How to Prepare For a Successful Job Search for 2024How to Prepare For a Successful Job Search for 2024
How to Prepare For a Successful Job Search for 2024
 
Social Media Marketing Trends 2024 // The Global Indie Insights
Social Media Marketing Trends 2024 // The Global Indie InsightsSocial Media Marketing Trends 2024 // The Global Indie Insights
Social Media Marketing Trends 2024 // The Global Indie Insights
 
Trends In Paid Search: Navigating The Digital Landscape In 2024
Trends In Paid Search: Navigating The Digital Landscape In 2024Trends In Paid Search: Navigating The Digital Landscape In 2024
Trends In Paid Search: Navigating The Digital Landscape In 2024
 
5 Public speaking tips from TED - Visualized summary
5 Public speaking tips from TED - Visualized summary5 Public speaking tips from TED - Visualized summary
5 Public speaking tips from TED - Visualized summary
 
ChatGPT and the Future of Work - Clark Boyd
ChatGPT and the Future of Work - Clark Boyd ChatGPT and the Future of Work - Clark Boyd
ChatGPT and the Future of Work - Clark Boyd
 
Getting into the tech field. what next
Getting into the tech field. what next Getting into the tech field. what next
Getting into the tech field. what next
 
Google's Just Not That Into You: Understanding Core Updates & Search Intent
Google's Just Not That Into You: Understanding Core Updates & Search IntentGoogle's Just Not That Into You: Understanding Core Updates & Search Intent
Google's Just Not That Into You: Understanding Core Updates & Search Intent
 
How to have difficult conversations
How to have difficult conversations How to have difficult conversations
How to have difficult conversations
 
Introduction to Data Science
Introduction to Data ScienceIntroduction to Data Science
Introduction to Data Science
 
Time Management & Productivity - Best Practices
Time Management & Productivity -  Best PracticesTime Management & Productivity -  Best Practices
Time Management & Productivity - Best Practices
 
The six step guide to practical project management
The six step guide to practical project managementThe six step guide to practical project management
The six step guide to practical project management
 
Beginners Guide to TikTok for Search - Rachel Pearson - We are Tilt __ Bright...
Beginners Guide to TikTok for Search - Rachel Pearson - We are Tilt __ Bright...Beginners Guide to TikTok for Search - Rachel Pearson - We are Tilt __ Bright...
Beginners Guide to TikTok for Search - Rachel Pearson - We are Tilt __ Bright...
 

Emisiones de CO2: Centroamérica y el Caribe

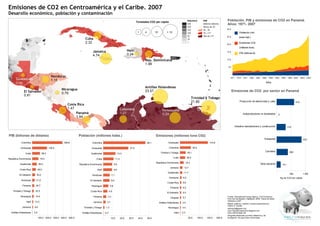
  • 1. Emisiones de CO2 en Centroamérica y el Caribe. 2007 Desarollo económico, población y contaminación Toneladas CO2 per cápita Población, PIB y emisiones de CO2 en Panamá. Años: 1971- 2007 30.0 1 4 10 > 10 Población (mil- 25.0 lones hab.) Cuba 2.32 20.0 Emisiones CO2 (millones tons) Jamaica Haití 15.0 PIB (billones $) 4.74 0.24 Rep. Dominicana 10.0 1.98 5.0 - Honduras 1971 1974 1977 1980 1983 1986 1989 1992 1995 1998 2001 2004 2007 Guatemala 1.15 0.88 Años Antillas Holandesas Nicaragua 23.57 Emisiones de CO2 por sector en Panamá El Salvador 0.79 0.91 Trinidad y Tobago 21.85 Producción de electricidad y calor 612 Costa Rica 1.47 Colombia Venezuela Panamá 1.21 5.24 Autoproductores no localizados 2 1.94 Industria manufacturera y construcción 315 PIB (billones de dólares) Población (millones habs.) Emisiones (millones tons C02) Transporte 872 Colombia 389.6 Colombia 46.1 Venezuela 143.8 Venezuela 190.0 Venezuela 27.5 Colombia 55.9 Carretera 390 Cuba 98.5 Guatemala 13.3 Trinidad y Tobago 29.1 República Dominicana 79.5 Cuba 26.2 Cuba 11.3 República Dominicana 19.3 Guatemala 58.4 República Dominicana 9.8 Otros sectores 141 Jamaica 12.7 Costa Rica 46.0 Haiti 9.6 Guatemala 11.7 El Salvador 35.2 - 500 1 000 Honduras 7.1 Honduras 8.2 Kg de CO2 per cápita Honduras 31.2 El Salvador 6.9 Costa Rica 6.6 Panama 26.7 Nicaragua 5.6 Panama 6.5 Trinidad y Tobago 20.3 Costa Rica 4.5 El Salvador 6.2 Nicaragua 19.4 Panama 3.3 Fuente: International Energy Agency. CO2 Emissions Uruguay 5.7 from fuel combustion. Highlights. 2009. Todos los datos Haiti 13.2 referidos a 2007 Jamaica 2.7 Antillas Holandesas 4.5 Mapas, gráficos, cuadros y textos preparados por: Carlos A. Gordón Jamaica 9.6 Trinidad y Tobago 1.3 Nicaragua 4.4 carlosg16@gmail.com www.mapeandopanama.blogspot.com Antillas Holandesas 2.9 Antillas Holandesas 0.2 Haiti 2.3 www.metromapas.net Infografía elaborada con fines didácticos y de - 100.0 200.0 300.0 400.0 500.0 - 10.0 20.0 30.0 40.0 50.0 - 50.0 100.0 150.0 200.0 divulgación. No para fines comerciales.