SlideShare una empresa de Scribd logo
1 de 4
Descargar para leer sin conexión
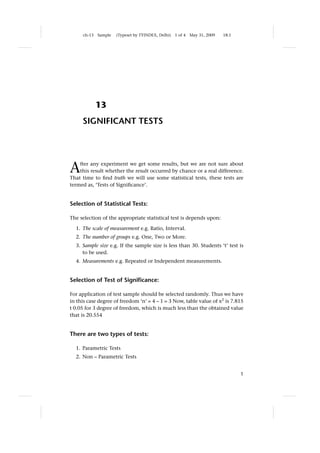
ch-13   Sample   (Typeset by TYINDEX, Delhi)   1 of 4   May 31, 2009   18:1


             13
     SIGNIFICANT TESTS


A   fter any experiment we get some results, but we are not sure about
    this result whether the result occurred by chance or a real difference.
That time to find truth we will use some statistical tests, these tests are
termed as, ‘Tests of Significance’.


Selection of Statistical Tests:

The selection of the appropriate statistical test is depends upon:

  1. The scale of measurement e.g. Ratio, Interval.
  2. The number of groups e.g. One, Two or More.
  3. Sample size e.g. If the sample size is less than 30. Students ‘t’ test is
     to be used.
  4. Measurements e.g. Repeated or Independent measurements.


Selection of Test of Significance:

For application of test sample should be selected randomly. Thus we have
in this case degree of freedom ‘n’ = 4 – 1 = 3 Now, table value of x2 is 7.815
t 0.05 for 3 degree of freedom, which is much less than the obtained value
that is 20.554


There are two types of tests:

  1. Parametric Tests
  2. Non – Parametric Tests


                                                                                   1
ch-13   Sample   (Typeset by TYINDEX, Delhi)   2 of 4   May 31, 2009      18:1


SIGNIFICANT TESTS

Table 13.1. This is Example of Table Sample.

Scale                          Two groups                        Three/More groups
                     Independent         Repeated          Independent          Repeated

Interval            Z test            Z test              ANOVA test           ANOVA
and Ratio           t test            t test              (F test)             (F test)

Ordinal             Median test       Wilcox an test      Median               Friedman test
                    Mann Whitney                          Kruscal test

Nominal             X2 test           Me Nemar test       Chi–Square           Cochron’s test
                                                          Test


1. Parametric Test:

When quantitative data like Weight, Length, Height, and Percentage is
given it is used. These tests were based on the assumption that samples
were drawn from the normally distributed populations.
  E.g. Students t test, Z test etc.


2. Non – Parametric Test:

When qualitative data like Health, Cure rate, Intelligence, Color is given
it is used. Here observations are classified into a particular category or
groups.
   E.g. Chi square (x2 ) test, Median tests etc.


I. T – Test:

W.S. Gosset investigated this test in 1908. It is called Student t – Test
because the pen name of Dr. Gosset was student, hence this test is known
as student’s t – test. It is also called as ‘t- ratio’ because it is a ratio of
difference between two means.
   Aylmer Fisher (1890–1962) developed students ‘t’ test where samples are
drawn from normal population and are randomly selected.
   After comparing the calculated value of ‘t’ with the value given in the
‘t’ table considering degree of freedom we can ascertain its significance.
   Is the testing reliable? It is used for comparisons with expectations of
the Normal, Binomial and Poisson distributions and Comparison of a
sample variance with population variance.


2
ch-13   Sample       (Typeset by TYINDEX, Delhi)     3 of 4   May 31, 2009   18:1


                                                                          SIGNIFICANT TESTS

                         Table 13.2. This is Example of Table Sample.

                         Patients         Before               After
                                      treatment (B)        treatment (A)

                         1                   2.4                    2.2
                         2                   2.8                    2.6
                         3                   3.2                    3.0
                         4                   6.4                    4.2
                         5                   4.3                    2.2
                         6                   2.2                    2.0
                         7                   6.2                    4.8
                         8                   4.2                    2.4


Solution:

Here,

                                         D = 8.3

                                         N=8
                                        D2 = 14.61
                                               8.3
                                         D=        = 1.0375
                                                8
∴ Standard deviation of the different between means. Here, the calculated
value for ‘t’ exceeds the tabulated ‘t’ value at p = 0.05 level with 7df.
Therefore the glucose concentration by the patients after treatment is not
significant.

                                                             D)2
                                                   D2 − (    n
                                         =
                                                    N−1
                                                           (8.3)2
                                              14.61 −        8
                                         =
                                                   7

                                              14.61 −      68.89
                                                             8
                                         =
                                                   7
                                              14.61 − 8.6112
                                 ∴ S.D. =
                                                    7
                                             √
                                         =    0.8569
                                 ∴ S.D. = 0.9257


                                                                                            3
ch-13   Sample   (Typeset by TYINDEX, Delhi)   4 of 4   May 31, 2009   18:1


SIGNIFICANT TESTS

Now, standard error of the difference (SED )
                                     SD 0.9257 0.9257
                                  .= √ = √    =
                                      N    8    2.8284
                             ∴ S.E. = 0.3272
                                D    1.0375
                         ∴t=       =        = 3.1708
                               SED   0.3272
  Here, the calculated value for ‘t’ exceeds the tabulated ‘t’ value at p =
0.05 level with 7df. Therefore the glucose concentration by the patients
after treatment is not significant.


Utility:

It is widely used in the field of Medical science, Agriculture and Veterinary
as follows:
    r   To compare the results of two drugs which is given to same individ-
        uals in the sample at two different situations? E.g. Effect of Bryonia
        and Lycopodium on general symptoms like sleep, appetite etc.
    r   It is used to study of drug specificity on a particular organ / tissue /
        cell level. E.g. Effect of Belberis Vulg. on renal system.
    r   It is used to compare results of two different methods. E.g. Estimation
        of Hb% by Sahlis method and Tallquist method.
    r   To compare observations made at two different sites of the same body.
        E.g. compare blood pressure of arm and thigh.
    r   To study the accuracy of two different instruments like Thermometer,
        B.P apparatus etc.
    r   To accept the Null Hypothesis that is no difference between the two
        means.
    r   To reject the hypothesis that is the difference between the means of
        the two samples is statistically significant.


4

Más contenido relacionado

La actualidad más candente

Reporting a paired sample t -test
Reporting a paired sample t -testReporting a paired sample t -test
Reporting a paired sample t -testAmit Sharma
 
A new sdm classifier using jaccard mining procedure case study rheumatic feve...
A new sdm classifier using jaccard mining procedure case study rheumatic feve...A new sdm classifier using jaccard mining procedure case study rheumatic feve...
A new sdm classifier using jaccard mining procedure case study rheumatic feve...ijbbjournal
 
A New SDM Classifier Using Jaccard Mining Procedure (CASE STUDY: RHEUMATIC FE...
A New SDM Classifier Using Jaccard Mining Procedure (CASE STUDY: RHEUMATIC FE...A New SDM Classifier Using Jaccard Mining Procedure (CASE STUDY: RHEUMATIC FE...
A New SDM Classifier Using Jaccard Mining Procedure (CASE STUDY: RHEUMATIC FE...Soaad Abd El-Badie
 
IT for Business Intelligence Term Paper
IT for Business Intelligence Term PaperIT for Business Intelligence Term Paper
IT for Business Intelligence Term Paperniloyghosh1984
 
Back to the basics-Part2: Data exploration: representing and testing data pro...
Back to the basics-Part2: Data exploration: representing and testing data pro...Back to the basics-Part2: Data exploration: representing and testing data pro...
Back to the basics-Part2: Data exploration: representing and testing data pro...Giannis Tsakonas
 
Discriminant Analysis-lecture 8
Discriminant Analysis-lecture 8Discriminant Analysis-lecture 8
Discriminant Analysis-lecture 8Laila Fatehy
 
Aron chpt 9 ed t test independent samples
Aron chpt 9 ed t test independent samplesAron chpt 9 ed t test independent samples
Aron chpt 9 ed t test independent samplesKaren Price
 
Reporting a paired sample t test
Reporting a paired sample t testReporting a paired sample t test
Reporting a paired sample t testKen Plummer
 
Topic17 regression spss
Topic17 regression spssTopic17 regression spss
Topic17 regression spssSizwan Ahammed
 
Analysis of Variance and Repeated Measures Design
Analysis of Variance and Repeated Measures DesignAnalysis of Variance and Repeated Measures Design
Analysis of Variance and Repeated Measures DesignJ P Verma
 
Discriminant Analysis in Sports
Discriminant Analysis in SportsDiscriminant Analysis in Sports
Discriminant Analysis in SportsJ P Verma
 
Reporting an independent sample t- test
Reporting an independent sample t- testReporting an independent sample t- test
Reporting an independent sample t- testAmit Sharma
 
Quantitative Analysis for Emperical Research
Quantitative Analysis for Emperical ResearchQuantitative Analysis for Emperical Research
Quantitative Analysis for Emperical ResearchAmit Kamble
 
Bus b272 f unit 1
Bus b272 f unit 1Bus b272 f unit 1
Bus b272 f unit 1kocho2
 

La actualidad más candente (20)

Reporting a paired sample t -test
Reporting a paired sample t -testReporting a paired sample t -test
Reporting a paired sample t -test
 
117 chap8 slides
117 chap8 slides117 chap8 slides
117 chap8 slides
 
A new sdm classifier using jaccard mining procedure case study rheumatic feve...
A new sdm classifier using jaccard mining procedure case study rheumatic feve...A new sdm classifier using jaccard mining procedure case study rheumatic feve...
A new sdm classifier using jaccard mining procedure case study rheumatic feve...
 
A New SDM Classifier Using Jaccard Mining Procedure (CASE STUDY: RHEUMATIC FE...
A New SDM Classifier Using Jaccard Mining Procedure (CASE STUDY: RHEUMATIC FE...A New SDM Classifier Using Jaccard Mining Procedure (CASE STUDY: RHEUMATIC FE...
A New SDM Classifier Using Jaccard Mining Procedure (CASE STUDY: RHEUMATIC FE...
 
Malhotra16
Malhotra16Malhotra16
Malhotra16
 
IT for Business Intelligence Term Paper
IT for Business Intelligence Term PaperIT for Business Intelligence Term Paper
IT for Business Intelligence Term Paper
 
Back to the basics-Part2: Data exploration: representing and testing data pro...
Back to the basics-Part2: Data exploration: representing and testing data pro...Back to the basics-Part2: Data exploration: representing and testing data pro...
Back to the basics-Part2: Data exploration: representing and testing data pro...
 
Two variances or standard deviations
Two variances or standard deviations  Two variances or standard deviations
Two variances or standard deviations
 
Discriminant Analysis-lecture 8
Discriminant Analysis-lecture 8Discriminant Analysis-lecture 8
Discriminant Analysis-lecture 8
 
Aron chpt 9 ed t test independent samples
Aron chpt 9 ed t test independent samplesAron chpt 9 ed t test independent samples
Aron chpt 9 ed t test independent samples
 
Reporting a paired sample t test
Reporting a paired sample t testReporting a paired sample t test
Reporting a paired sample t test
 
Two dependent samples (matched pairs)
Two dependent samples (matched pairs) Two dependent samples (matched pairs)
Two dependent samples (matched pairs)
 
Topic17 regression spss
Topic17 regression spssTopic17 regression spss
Topic17 regression spss
 
Analysis of Variance and Repeated Measures Design
Analysis of Variance and Repeated Measures DesignAnalysis of Variance and Repeated Measures Design
Analysis of Variance and Repeated Measures Design
 
Discriminant Analysis in Sports
Discriminant Analysis in SportsDiscriminant Analysis in Sports
Discriminant Analysis in Sports
 
Reporting an independent sample t- test
Reporting an independent sample t- testReporting an independent sample t- test
Reporting an independent sample t- test
 
Quantitative Analysis for Emperical Research
Quantitative Analysis for Emperical ResearchQuantitative Analysis for Emperical Research
Quantitative Analysis for Emperical Research
 
The t Test for Two Related Samples
The t Test for Two Related SamplesThe t Test for Two Related Samples
The t Test for Two Related Samples
 
Malhotra08
Malhotra08Malhotra08
Malhotra08
 
Bus b272 f unit 1
Bus b272 f unit 1Bus b272 f unit 1
Bus b272 f unit 1
 

Similar a Sample A_Book Typesetting

Test of significance (t-test, proportion test, chi-square test)
Test of significance (t-test, proportion test, chi-square test)Test of significance (t-test, proportion test, chi-square test)
Test of significance (t-test, proportion test, chi-square test)Ramnath Takiar
 
Two Sample Tests
Two Sample TestsTwo Sample Tests
Two Sample Testssanketd1983
 
T Test For Two Independent Samples
T Test For Two Independent SamplesT Test For Two Independent Samples
T Test For Two Independent Samplesshoffma5
 
Clinicaldataanalysis in r
Clinicaldataanalysis in rClinicaldataanalysis in r
Clinicaldataanalysis in rAbhik Seal
 
Chapter 7 : Inference for Distributions(The t Distributions, One-Sample t Con...
Chapter 7 : Inference for Distributions(The t Distributions, One-Sample t Con...Chapter 7 : Inference for Distributions(The t Distributions, One-Sample t Con...
Chapter 7 : Inference for Distributions(The t Distributions, One-Sample t Con...nszakir
 
T Test Presentation.pptx
T Test Presentation.pptxT Test Presentation.pptx
T Test Presentation.pptxVishal Doke
 
t-tests in R - Lab slides for UGA course FANR 6750
t-tests in R - Lab slides for UGA course FANR 6750t-tests in R - Lab slides for UGA course FANR 6750
t-tests in R - Lab slides for UGA course FANR 6750richardchandler
 
Statistics
StatisticsStatistics
Statisticsmegamsma
 
การสุ่มตัวอย่างในงานวิจัยสาธารณสุข
การสุ่มตัวอย่างในงานวิจัยสาธารณสุขการสุ่มตัวอย่างในงานวิจัยสาธารณสุข
การสุ่มตัวอย่างในงานวิจัยสาธารณสุขUltraman Taro
 

Similar a Sample A_Book Typesetting (20)

Stat5 the t test
Stat5 the t testStat5 the t test
Stat5 the t test
 
Stat5 the t test
Stat5 the t testStat5 the t test
Stat5 the t test
 
T test statistics
T test statisticsT test statistics
T test statistics
 
Two Means, Independent Samples
Two Means, Independent SamplesTwo Means, Independent Samples
Two Means, Independent Samples
 
The t test
The t testThe t test
The t test
 
Test of significance (t-test, proportion test, chi-square test)
Test of significance (t-test, proportion test, chi-square test)Test of significance (t-test, proportion test, chi-square test)
Test of significance (t-test, proportion test, chi-square test)
 
Student t t est
Student t t estStudent t t est
Student t t est
 
Unit-5.-t-test.ppt
Unit-5.-t-test.pptUnit-5.-t-test.ppt
Unit-5.-t-test.ppt
 
Two Sample Tests
Two Sample TestsTwo Sample Tests
Two Sample Tests
 
Two Variances or Standard Deviations
Two Variances or Standard DeviationsTwo Variances or Standard Deviations
Two Variances or Standard Deviations
 
T Test For Two Independent Samples
T Test For Two Independent SamplesT Test For Two Independent Samples
T Test For Two Independent Samples
 
Clinicaldataanalysis in r
Clinicaldataanalysis in rClinicaldataanalysis in r
Clinicaldataanalysis in r
 
Chapter07.pdf
Chapter07.pdfChapter07.pdf
Chapter07.pdf
 
Chapter 7 : Inference for Distributions(The t Distributions, One-Sample t Con...
Chapter 7 : Inference for Distributions(The t Distributions, One-Sample t Con...Chapter 7 : Inference for Distributions(The t Distributions, One-Sample t Con...
Chapter 7 : Inference for Distributions(The t Distributions, One-Sample t Con...
 
T Test Presentation.pptx
T Test Presentation.pptxT Test Presentation.pptx
T Test Presentation.pptx
 
f and t test
f and t testf and t test
f and t test
 
Statistics chm 235
Statistics chm 235Statistics chm 235
Statistics chm 235
 
t-tests in R - Lab slides for UGA course FANR 6750
t-tests in R - Lab slides for UGA course FANR 6750t-tests in R - Lab slides for UGA course FANR 6750
t-tests in R - Lab slides for UGA course FANR 6750
 
Statistics
StatisticsStatistics
Statistics
 
การสุ่มตัวอย่างในงานวิจัยสาธารณสุข
การสุ่มตัวอย่างในงานวิจัยสาธารณสุขการสุ่มตัวอย่างในงานวิจัยสาธารณสุข
การสุ่มตัวอย่างในงานวิจัยสาธารณสุข
 

Último

From Event to Action: Accelerate Your Decision Making with Real-Time Automation
From Event to Action: Accelerate Your Decision Making with Real-Time AutomationFrom Event to Action: Accelerate Your Decision Making with Real-Time Automation
From Event to Action: Accelerate Your Decision Making with Real-Time AutomationSafe Software
 
A Year of the Servo Reboot: Where Are We Now?
A Year of the Servo Reboot: Where Are We Now?A Year of the Servo Reboot: Where Are We Now?
A Year of the Servo Reboot: Where Are We Now?Igalia
 
Scaling API-first – The story of a global engineering organization
Scaling API-first – The story of a global engineering organizationScaling API-first – The story of a global engineering organization
Scaling API-first – The story of a global engineering organizationRadu Cotescu
 
AWS Community Day CPH - Three problems of Terraform
AWS Community Day CPH - Three problems of TerraformAWS Community Day CPH - Three problems of Terraform
AWS Community Day CPH - Three problems of TerraformAndrey Devyatkin
 
Apidays New York 2024 - Scaling API-first by Ian Reasor and Radu Cotescu, Adobe
Apidays New York 2024 - Scaling API-first by Ian Reasor and Radu Cotescu, AdobeApidays New York 2024 - Scaling API-first by Ian Reasor and Radu Cotescu, Adobe
Apidays New York 2024 - Scaling API-first by Ian Reasor and Radu Cotescu, Adobeapidays
 
GenAI Risks & Security Meetup 01052024.pdf
GenAI Risks & Security Meetup 01052024.pdfGenAI Risks & Security Meetup 01052024.pdf
GenAI Risks & Security Meetup 01052024.pdflior mazor
 
Advantages of Hiring UIUX Design Service Providers for Your Business
Advantages of Hiring UIUX Design Service Providers for Your BusinessAdvantages of Hiring UIUX Design Service Providers for Your Business
Advantages of Hiring UIUX Design Service Providers for Your BusinessPixlogix Infotech
 
Strategies for Landing an Oracle DBA Job as a Fresher
Strategies for Landing an Oracle DBA Job as a FresherStrategies for Landing an Oracle DBA Job as a Fresher
Strategies for Landing an Oracle DBA Job as a FresherRemote DBA Services
 
2024: Domino Containers - The Next Step. News from the Domino Container commu...
2024: Domino Containers - The Next Step. News from the Domino Container commu...2024: Domino Containers - The Next Step. News from the Domino Container commu...
2024: Domino Containers - The Next Step. News from the Domino Container commu...Martijn de Jong
 
GenCyber Cyber Security Day Presentation
GenCyber Cyber Security Day PresentationGenCyber Cyber Security Day Presentation
GenCyber Cyber Security Day PresentationMichael W. Hawkins
 
Tata AIG General Insurance Company - Insurer Innovation Award 2024
Tata AIG General Insurance Company - Insurer Innovation Award 2024Tata AIG General Insurance Company - Insurer Innovation Award 2024
Tata AIG General Insurance Company - Insurer Innovation Award 2024The Digital Insurer
 
🐬 The future of MySQL is Postgres 🐘
🐬  The future of MySQL is Postgres   🐘🐬  The future of MySQL is Postgres   🐘
🐬 The future of MySQL is Postgres 🐘RTylerCroy
 
Axa Assurance Maroc - Insurer Innovation Award 2024
Axa Assurance Maroc - Insurer Innovation Award 2024Axa Assurance Maroc - Insurer Innovation Award 2024
Axa Assurance Maroc - Insurer Innovation Award 2024The Digital Insurer
 
Connector Corner: Accelerate revenue generation using UiPath API-centric busi...
Connector Corner: Accelerate revenue generation using UiPath API-centric busi...Connector Corner: Accelerate revenue generation using UiPath API-centric busi...
Connector Corner: Accelerate revenue generation using UiPath API-centric busi...DianaGray10
 
Powerful Google developer tools for immediate impact! (2023-24 C)
Powerful Google developer tools for immediate impact! (2023-24 C)Powerful Google developer tools for immediate impact! (2023-24 C)
Powerful Google developer tools for immediate impact! (2023-24 C)wesley chun
 
Driving Behavioral Change for Information Management through Data-Driven Gree...
Driving Behavioral Change for Information Management through Data-Driven Gree...Driving Behavioral Change for Information Management through Data-Driven Gree...
Driving Behavioral Change for Information Management through Data-Driven Gree...Enterprise Knowledge
 
Histor y of HAM Radio presentation slide
Histor y of HAM Radio presentation slideHistor y of HAM Radio presentation slide
Histor y of HAM Radio presentation slidevu2urc
 
Real Time Object Detection Using Open CV
Real Time Object Detection Using Open CVReal Time Object Detection Using Open CV
Real Time Object Detection Using Open CVKhem
 
Strategies for Unlocking Knowledge Management in Microsoft 365 in the Copilot...
Strategies for Unlocking Knowledge Management in Microsoft 365 in the Copilot...Strategies for Unlocking Knowledge Management in Microsoft 365 in the Copilot...
Strategies for Unlocking Knowledge Management in Microsoft 365 in the Copilot...Drew Madelung
 

Último (20)

From Event to Action: Accelerate Your Decision Making with Real-Time Automation
From Event to Action: Accelerate Your Decision Making with Real-Time AutomationFrom Event to Action: Accelerate Your Decision Making with Real-Time Automation
From Event to Action: Accelerate Your Decision Making with Real-Time Automation
 
A Year of the Servo Reboot: Where Are We Now?
A Year of the Servo Reboot: Where Are We Now?A Year of the Servo Reboot: Where Are We Now?
A Year of the Servo Reboot: Where Are We Now?
 
Scaling API-first – The story of a global engineering organization
Scaling API-first – The story of a global engineering organizationScaling API-first – The story of a global engineering organization
Scaling API-first – The story of a global engineering organization
 
AWS Community Day CPH - Three problems of Terraform
AWS Community Day CPH - Three problems of TerraformAWS Community Day CPH - Three problems of Terraform
AWS Community Day CPH - Three problems of Terraform
 
Apidays New York 2024 - Scaling API-first by Ian Reasor and Radu Cotescu, Adobe
Apidays New York 2024 - Scaling API-first by Ian Reasor and Radu Cotescu, AdobeApidays New York 2024 - Scaling API-first by Ian Reasor and Radu Cotescu, Adobe
Apidays New York 2024 - Scaling API-first by Ian Reasor and Radu Cotescu, Adobe
 
GenAI Risks & Security Meetup 01052024.pdf
GenAI Risks & Security Meetup 01052024.pdfGenAI Risks & Security Meetup 01052024.pdf
GenAI Risks & Security Meetup 01052024.pdf
 
Advantages of Hiring UIUX Design Service Providers for Your Business
Advantages of Hiring UIUX Design Service Providers for Your BusinessAdvantages of Hiring UIUX Design Service Providers for Your Business
Advantages of Hiring UIUX Design Service Providers for Your Business
 
Strategies for Landing an Oracle DBA Job as a Fresher
Strategies for Landing an Oracle DBA Job as a FresherStrategies for Landing an Oracle DBA Job as a Fresher
Strategies for Landing an Oracle DBA Job as a Fresher
 
2024: Domino Containers - The Next Step. News from the Domino Container commu...
2024: Domino Containers - The Next Step. News from the Domino Container commu...2024: Domino Containers - The Next Step. News from the Domino Container commu...
2024: Domino Containers - The Next Step. News from the Domino Container commu...
 
GenCyber Cyber Security Day Presentation
GenCyber Cyber Security Day PresentationGenCyber Cyber Security Day Presentation
GenCyber Cyber Security Day Presentation
 
+971581248768>> SAFE AND ORIGINAL ABORTION PILLS FOR SALE IN DUBAI AND ABUDHA...
+971581248768>> SAFE AND ORIGINAL ABORTION PILLS FOR SALE IN DUBAI AND ABUDHA...+971581248768>> SAFE AND ORIGINAL ABORTION PILLS FOR SALE IN DUBAI AND ABUDHA...
+971581248768>> SAFE AND ORIGINAL ABORTION PILLS FOR SALE IN DUBAI AND ABUDHA...
 
Tata AIG General Insurance Company - Insurer Innovation Award 2024
Tata AIG General Insurance Company - Insurer Innovation Award 2024Tata AIG General Insurance Company - Insurer Innovation Award 2024
Tata AIG General Insurance Company - Insurer Innovation Award 2024
 
🐬 The future of MySQL is Postgres 🐘
🐬  The future of MySQL is Postgres   🐘🐬  The future of MySQL is Postgres   🐘
🐬 The future of MySQL is Postgres 🐘
 
Axa Assurance Maroc - Insurer Innovation Award 2024
Axa Assurance Maroc - Insurer Innovation Award 2024Axa Assurance Maroc - Insurer Innovation Award 2024
Axa Assurance Maroc - Insurer Innovation Award 2024
 
Connector Corner: Accelerate revenue generation using UiPath API-centric busi...
Connector Corner: Accelerate revenue generation using UiPath API-centric busi...Connector Corner: Accelerate revenue generation using UiPath API-centric busi...
Connector Corner: Accelerate revenue generation using UiPath API-centric busi...
 
Powerful Google developer tools for immediate impact! (2023-24 C)
Powerful Google developer tools for immediate impact! (2023-24 C)Powerful Google developer tools for immediate impact! (2023-24 C)
Powerful Google developer tools for immediate impact! (2023-24 C)
 
Driving Behavioral Change for Information Management through Data-Driven Gree...
Driving Behavioral Change for Information Management through Data-Driven Gree...Driving Behavioral Change for Information Management through Data-Driven Gree...
Driving Behavioral Change for Information Management through Data-Driven Gree...
 
Histor y of HAM Radio presentation slide
Histor y of HAM Radio presentation slideHistor y of HAM Radio presentation slide
Histor y of HAM Radio presentation slide
 
Real Time Object Detection Using Open CV
Real Time Object Detection Using Open CVReal Time Object Detection Using Open CV
Real Time Object Detection Using Open CV
 
Strategies for Unlocking Knowledge Management in Microsoft 365 in the Copilot...
Strategies for Unlocking Knowledge Management in Microsoft 365 in the Copilot...Strategies for Unlocking Knowledge Management in Microsoft 365 in the Copilot...
Strategies for Unlocking Knowledge Management in Microsoft 365 in the Copilot...
 

Sample A_Book Typesetting

  • 1. ch-13 Sample (Typeset by TYINDEX, Delhi) 1 of 4 May 31, 2009 18:1 13 SIGNIFICANT TESTS A fter any experiment we get some results, but we are not sure about this result whether the result occurred by chance or a real difference. That time to find truth we will use some statistical tests, these tests are termed as, ‘Tests of Significance’. Selection of Statistical Tests: The selection of the appropriate statistical test is depends upon: 1. The scale of measurement e.g. Ratio, Interval. 2. The number of groups e.g. One, Two or More. 3. Sample size e.g. If the sample size is less than 30. Students ‘t’ test is to be used. 4. Measurements e.g. Repeated or Independent measurements. Selection of Test of Significance: For application of test sample should be selected randomly. Thus we have in this case degree of freedom ‘n’ = 4 – 1 = 3 Now, table value of x2 is 7.815 t 0.05 for 3 degree of freedom, which is much less than the obtained value that is 20.554 There are two types of tests: 1. Parametric Tests 2. Non – Parametric Tests 1
  • 2. ch-13 Sample (Typeset by TYINDEX, Delhi) 2 of 4 May 31, 2009 18:1 SIGNIFICANT TESTS Table 13.1. This is Example of Table Sample. Scale Two groups Three/More groups Independent Repeated Independent Repeated Interval Z test Z test ANOVA test ANOVA and Ratio t test t test (F test) (F test) Ordinal Median test Wilcox an test Median Friedman test Mann Whitney Kruscal test Nominal X2 test Me Nemar test Chi–Square Cochron’s test Test 1. Parametric Test: When quantitative data like Weight, Length, Height, and Percentage is given it is used. These tests were based on the assumption that samples were drawn from the normally distributed populations. E.g. Students t test, Z test etc. 2. Non – Parametric Test: When qualitative data like Health, Cure rate, Intelligence, Color is given it is used. Here observations are classified into a particular category or groups. E.g. Chi square (x2 ) test, Median tests etc. I. T – Test: W.S. Gosset investigated this test in 1908. It is called Student t – Test because the pen name of Dr. Gosset was student, hence this test is known as student’s t – test. It is also called as ‘t- ratio’ because it is a ratio of difference between two means. Aylmer Fisher (1890–1962) developed students ‘t’ test where samples are drawn from normal population and are randomly selected. After comparing the calculated value of ‘t’ with the value given in the ‘t’ table considering degree of freedom we can ascertain its significance. Is the testing reliable? It is used for comparisons with expectations of the Normal, Binomial and Poisson distributions and Comparison of a sample variance with population variance. 2
  • 3. ch-13 Sample (Typeset by TYINDEX, Delhi) 3 of 4 May 31, 2009 18:1 SIGNIFICANT TESTS Table 13.2. This is Example of Table Sample. Patients Before After treatment (B) treatment (A) 1 2.4 2.2 2 2.8 2.6 3 3.2 3.0 4 6.4 4.2 5 4.3 2.2 6 2.2 2.0 7 6.2 4.8 8 4.2 2.4 Solution: Here, D = 8.3 N=8 D2 = 14.61 8.3 D= = 1.0375 8 ∴ Standard deviation of the different between means. Here, the calculated value for ‘t’ exceeds the tabulated ‘t’ value at p = 0.05 level with 7df. Therefore the glucose concentration by the patients after treatment is not significant. D)2 D2 − ( n = N−1 (8.3)2 14.61 − 8 = 7 14.61 − 68.89 8 = 7 14.61 − 8.6112 ∴ S.D. = 7 √ = 0.8569 ∴ S.D. = 0.9257 3
  • 4. ch-13 Sample (Typeset by TYINDEX, Delhi) 4 of 4 May 31, 2009 18:1 SIGNIFICANT TESTS Now, standard error of the difference (SED ) SD 0.9257 0.9257 .= √ = √ = N 8 2.8284 ∴ S.E. = 0.3272 D 1.0375 ∴t= = = 3.1708 SED 0.3272 Here, the calculated value for ‘t’ exceeds the tabulated ‘t’ value at p = 0.05 level with 7df. Therefore the glucose concentration by the patients after treatment is not significant. Utility: It is widely used in the field of Medical science, Agriculture and Veterinary as follows: r To compare the results of two drugs which is given to same individ- uals in the sample at two different situations? E.g. Effect of Bryonia and Lycopodium on general symptoms like sleep, appetite etc. r It is used to study of drug specificity on a particular organ / tissue / cell level. E.g. Effect of Belberis Vulg. on renal system. r It is used to compare results of two different methods. E.g. Estimation of Hb% by Sahlis method and Tallquist method. r To compare observations made at two different sites of the same body. E.g. compare blood pressure of arm and thigh. r To study the accuracy of two different instruments like Thermometer, B.P apparatus etc. r To accept the Null Hypothesis that is no difference between the two means. r To reject the hypothesis that is the difference between the means of the two samples is statistically significant. 4