Business at a glance... December 2022
•
0 recomendaciones•6 vistas

International trade in services survey Market services turnover Spain Harmonized index of labour costs Spain Global debt Industrial production prices Germany Consumer and industrial production prices China

Recomendados
Recomendados
Más contenido relacionado
Similar a Business at a glance... December 2022
Similar a Business at a glance... December 2022 (20)
Más de Círculo de Empresarios
Más de Círculo de Empresarios (20)
Último
Último (20)
Business at a glance... December 2022
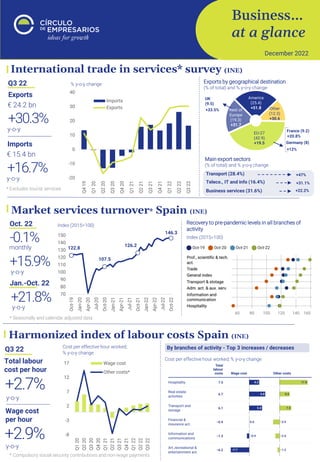
- 1. Business… at a glance December 2022 Harmonized index of labour costs Spain (INE) Q3 22 Total labour cost per hour y-o-y +2.7% Cost per effective hour worked; % y-o-y change By branches of activity - Top 3 increases / decreases Wage cost per hour y-o-y +2.9% Cost per effective hour worked; % y-o-y change International trade in services* survey (INE) Q3 22 Exports € 24.2 bn y-o-y +30.3% Imports € 15.4 bn y-o-y +16.7% Exports by geographical destination (% of total) and % y-o-y change EU-27 (42.9) +19.5 Rest of Europe (19.3) +31.7 America (25.4) +51.8 Other (12.3) +30.6 UK (9.5) France (9.2) Germany (8) +33.5% +20.8% +12% Business services (31.6%) Transport (28.4%) Main export sectors (% of total) and % y-o-y change +47% +22.2% Teleco., IT and info (16.4%) +31.1% * Excludes tourist services % y-o-y change Market services turnover* Spain (INE) * Seasonally and calendar adjusted data Jan.-Oct. 22 y-o-y +21.8% Recovery to pre-pandemic levels in all branches of activity Index (2015=100) Oct. 22 monthly -0.1% y-o-y +15.9% 122.8 107.5 126.2 146.3 70 80 90 100 110 120 130 140 150 Oct-19 Jan-20 Apr-20 Jul-20 Oct-20 Jan-21 Apr-21 Jul-21 Oct-21 Jan-22 Apr-22 Jul-22 Oct-22 Index (2015=100) -8 -3 2 7 12 17 Q1 20 Q2 20 Q3 20 Q4 20 Q1 21 Q2 21 Q3 21 Q4 21 Q1 22 Q2 22 Q3 22 Wage cost Other costs* * Compulsory social security contributions and non-wage payments -20 -10 0 10 20 30 40 Q4 19 Q1 20 Q2 20 Q3 20 Q4 20 Q1 21 Q2 21 Q3 21 Q4 21 Q1 22 Q2 22 Q3 22 Imports Exports
- 2. Business… at a glance. a publication of the “Círculo de Empresarios” produced by its Department of Economy. contains information and opinion from reliable sources. However. the “Círculo de Empresarios” does not guarantee its accuracy and does not take responsibility for any errors or omissions. This document is merely informative. As a result. the “Círculo de Empresarios” is not responsible for any uses that may be made of the publication. The opinions and estimates of the Department can be modified without prior warning. Moderation Industrial production prices Germany (Destatis) Global debt (IMF) 2021 World GDP 247% y-o-y -10 pp Total World GDP 153% y-o-y -6 pp Private(I) Private debt (I) % world GDP * Average (I) Households and non-financial corporations 136 137.2 142.6 137.1 140.5 146.2 159.5 153.5 135 140 145 150 155 160 2007 2008 2009 2010 2011-18* 2019 2020 2021 Private debt - non-financial corporations % national GDP Nov. 22 monthly -3.9% y-o-y +28.2% % change % y-o-y change By type of product ▼ level of private debt over GDP, but pre-pandemic levels are not recovered Consumer and industrial production prices China (Statista) Nov. 22 y-o-y 1.6% CPI y-o-y -1.3% PPI* * Industrial production price index Containment of consumer and producer prices in the face of weak demand % y-o-y change Industrial Production Price Index 45.8 28.2 7.9 -3.9 -10 0 10 20 30 40 50 Jan-21 Mar-21 May-21 Jul-21 Sep-21 Nov-21 Jan-22 Mar-22 May-22 Jul-22 Sep-22 Nov-22 y-o-y Monthly 13.5 -1.3 2.8 1.6 -2 0 2 4 6 8 10 12 14 May-21 Jun-21 Jul-21 Aug-21 Sep-21 Oct-21 Nov-21 Dec-21 Jan-22 Feb-22 Mar-22 Apr-22 May-22 Jun-22 Jul-22 Aug-22 Sep-22 Oct-22 Nov-22 PPI CPI % y-o-y change Means of production -2.3 Mining & quarrying -3.9 Processing -3.2 Raw materials 0.3 Means of subsistence 2.0 Food 3.9 Clothing 2.3 General commodity 1.4 Durable consumer goods 0.4