Business... at a glance May 2019

This document contains information on recent economic indicators and developments in Spain and globally: - Spanish industrial production declined in March, with drops in energy goods and durable goods production. Manufacturing PMIs increased slightly though remain in the contraction zone. Unit labor costs are forecast to increase modestly in 2019. - The US-China trade war escalated in May, with both sides increasing tariffs on more imports. This rising trade uncertainty could reduce global GDP growth by 2022 according to OECD estimates. Many US companies in China are reconsidering investments and relocating production. - Oil prices rose over 35% and 39% for Brent and WTI crude respectively since January due to OPEC extending production cuts

Recomendados
Recomendados
Más contenido relacionado
La actualidad más candente
La actualidad más candente (20)
Similar a Business... at a glance May 2019
Similar a Business... at a glance May 2019 (20)
Más de Círculo de Empresarios
Más de Círculo de Empresarios (20)
Último
Último (20)
Business... at a glance May 2019
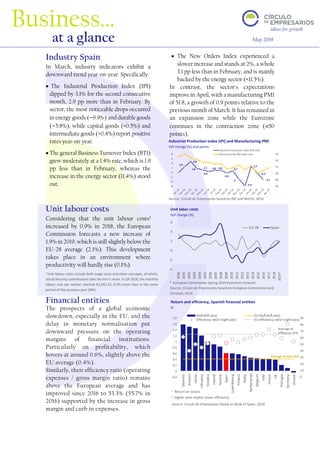
- 1. -4 -2 0 2 4 6 2000 2001 2002 2003 2004 2005 2006 2007 2008 2009 2010 2011 2012 2013 2014 2015 2016 2017 2018 2019* EU 28 Spain 2.5 4.8 1.8 1.1 0.4 0.9 0.9 -0.3 0.7 -3 -5.9 2.7 -0.2 -3.1 46 48 50 52 54 56 -6 -4 -2 0 2 4 6 8 Industrial Production Index (left axis) Manufacturing PMI (right axis) 0 10 20 30 40 50 60 70 80 90 -0,2 0 0,2 0,4 0,6 0,8 1 1,2 1,4 1,6 1,8 Slovenia Estonia Latvia Lithuania Slovakia Ireland Austria Spain Luxembourg Finland Malta Netherlands Belgium Italy France UK Portugal Germany Greece RoA (left axis) EU RoA (left axis) Efficiency ratio (right axis) EU efficiency ratio (right axis) Average of efficiency (EU) Average of RoA (EU) 1 1 2 2 Industry Spain In March, industry indicators exhibit a downward trend year-on-year. Specifically: • The Industrial Production Index (IPI) dipped by 3.1% for the second consecutive month, 2.9 pp more than in February. By sector, the most noticeable drops occurred in energy goods (-9.9%) and durable goods (-5.8%), while capital goods (+0.5%) and intermediate goods (+0.4%) report positive rates year-on-year. • The general Business Turnover Index (BTI) grew moderately at a 1.4% rate, which is 1.9 pp less than in February, whereas the increase in the energy sector (11.4%) stood out. • The New Orders Index experienced a slower increase and stands at 2%, a whole 3.1 pp less than in February, and is mainly backed by the energy sector (+11.5%). In contrast, the sector's expectations improve in April, with a manufacturing PMI of 51.8, a growth of 0.9 points relative to the previous month of March. It has remained in an expansion zone while the Eurozone continues in the contraction zone (<50 points). Unit labour costs Considering that the unit labour costs1 increased by 0.9% in 2018, the European Commission forecasts a new increase of 1.9% in 2019, which is still slightly below the EU-28 average (2.1%). This development takes place in an environment where productivity will hardly rise (0.1%). Financial entities The prospects of a global economic slowdown, especially in the EU, and the delay in monetary normalisation put downward pressure on the operating margins of financial institutions. Particularly on profitability, which hovers at around 0.6%, slightly above the EU average (0.4%). Similarly, their efficiency ratio (operating expenses / gross margin ratio) remains above the European average and has improved since 2016 to 53.3% (55.7% in 2016) supported by the increase in gross margin and curb in expenses. Business… at a glance May 2019 Source: Círculo de Empresarios based on European Commission and Eurostat, 2019 Unit labor costs YoY change (%) v Source: Círculo de Empresarios based on INE and Markit, 2019 Industrial Production Index (IPI) and Manufacturing PMI YoY change (%) and points v Return and efficiency, Spanish financial entities % v Source: Círculo de Empresarios based on Bank of Spain, 2019 2 Higher ratio implies lower efficiency * European Commission Spring 2019 Economic Forecast 1 Unit labour costs include both wage costs and other concepts, of which, Social Security contributions take the lion’s share. In Q4 2018, the monthly labour cost per worker reached €2,692.52, 0.9% more than in the same period of the previous year (INE) 1 Return on assets
- 2. ‘Business at a glance’, a publication of the Círculo de Empresarios produced by its Department of the Economy, contains information and opinion from reliable sources. However, the Círculo de Empresarios does not guarantee its accuracy and does not take responsibility for any errors or omissions. This document is merely informative. As a result, the Círculo de Empresarios is not responsible for any uses that may be made of the publication. The opinions and estimates of the Department can be modified without prior warning. www.circulodeempresarios.org -1,5 -1 -0,5 0 US GDP China GDP World GDP World trade Trade excluding US and China Higher uncertainty Tariffs extended to the rest of US - China trade Impact by 2021-22 from maintaining 25% tariffs 72.16 63.21 40 55 70 85 Jan-18 Feb-18 Mar-18 Apr-18 May-18 Jun-18 Jul-18 Aug-18 Sep-18 Oct-18 Nov-18 Dec-18 Jan-19 Feb-19 Mar-19 Apr-19 May-19 Brent West Texas Intermediate (WTI) +35.8% +39% US-China trade war After the last tariff increase by the US, currently, 40% of Chinese imports are taxed at 25% ($250 billion). In turn, the Trump Administration does not rule out imposing tariffs on other imported goods (worth $539 billion in 2018), which would raise the average US tariff above 7% (5 pp more than in 2017). As for China, it already imposes tariffs on 90% of its imports of US goods ($110 billion), and against this backdrop, has announced that from 1 June it will increase tariffs from 5% to 25% on US imports worth $60 billion. According to the OECD, the increase in tariffs and the mounting uncertainty will jeopardise GDP growth in both countries, the US and China by -0.8 pp and -1.2 pp, respectively, until 2022. Uncertainty about US companies According to the survey conducted by the US Chamber of Commerce in China, 40% of the US companies surveyed with presence in the Asian country affirm that the escalation of the Trump Administration’s trade war will have a strong impact on its trading volume, significantly more than on its European counterparts. Moreover, 33% are reconsidering their investment decisions in China, and 20% are contemplating a future relocation of their production outside the Asian superpower. OPEC meeting After the last OPEC meeting held on 19 May, in the wake of less than favourable outlook for global growth and the upsurge in the trade war, the oil-producing countries announced their intention to uphold their policy to cut daily barrels until the end of 2019. This environment, in addition to the tensions between the US and Iran, has boosted the price of Brent and West Texas barrels to $72.16 and $63.2, respectively. Thus, since January, the prices of Brent crude and West Texas have reported an increase of 35.8% and 39%, although they are still below the record highs hit in October 2018. Oil prices $ per barrell Source: Círculo de Empresarios based on US Census Bureau and OECD, 2019 US-China trade war impact % v 250 325 Tariffs imposed US tariffs on imports of China $ bn v Chinese tariffs on imports of US $ bn 110 10 Tariffs threatened Tariffs imposed Tariffs threatened Source: Círculo de Empresarios based on EIA, 2019