Moving beyond estrus detection
•Descargar como PPTX, PDF•
2 recomendaciones•492 vistas

activity meters are often used for automated oestrus detection. But is there more benefit from monitoring activity of cows? This presentation was part of the SUND Dairycare conference held in 2015, in Cordoba, Spain

Recomendados
Recomendados
Más contenido relacionado
La actualidad más candente
La actualidad más candente (11)
Similar a Moving beyond estrus detection
Similar a Moving beyond estrus detection (20)
Último
Último (20)
Moving beyond estrus detection
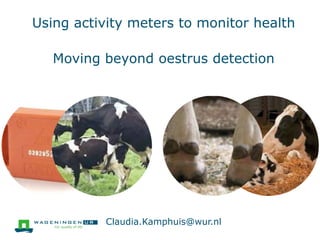
- 1. Using activity meters to monitor health Moving beyond oestrus detection Claudia.Kamphuis@wur.nl
- 2. Roadmap Precision Livestock Farming Technologies
- 3. Roadmap Precision Livestock Farming Technologies A success story: Automated oestrus detection
- 4. Roadmap Precision Livestock Farming Technologies A success story: Automated oestrus detection Moving beyond oestrus detection
- 5. Roadmap Precision Livestock Farming Technologies A success story: Automated oestrus detection Moving beyond oestrus detection Take home message
- 6. Precision livestock farming technologies
- 7. Technology and dairy farming Automation to increase labour efficiency
- 8. Technology and dairy farming Automation to increase labour efficiency Increased number of cows per labour input
- 9. Technology and dairy farming Automation to increase labour efficiency Increased number of cows per labour input Less time per cow to monitor health
- 10. Automation to increase labour efficiency Increased number of cows per labour input Less time per cow to monitor health Need for management-support technologies Technology and dairy farming
- 11. Tools monitoring production, health and welfare automatically, continuously, and (near) real-time Precision livestock farming (PLF) technologies
- 12. Tools monitoring production, health and welfare automatically, continuously, and (near) real-time Emerging field:126 studies, 139 technologies (Rutten et al., 2013, JDS) Precision livestock farming (PLF) technologies (Inter)national projects International conferences
- 13. Improve health & welfare Increase efficiency Improve product quality Objective monitoring Improve social lifestyle Benefits of PLF technologies
- 14. Adoption of PLF technologies Why has it been so slow?
- 15. Not familiar with available options (Russel and Bewley, 2013, JDS) 15
- 16. Too much information without knowing what to do with it(Russel and Bewley, 2013, JDS) 16
- 17. Waiting for improved systems (Steeneveld and Hogeveen, 2015, JDS)
- 18. Undesirable/unknown cost-benefit ratio (Russel and Bewley, 2013, JDS; Steeneveld and Hogeveen, 2015, JDS) Most important limiting factor for commercialisation (Banhazi et al., 2012, Int J Agric & Biol Eng)
- 19. A success story: automated oestrus detection
- 20. Attached to the ear Attached to collar Attached to the leg Why is automated oestrus detection different? Still many options to chose from, but
- 21. Why is automated oestrus detection different? Still many options to chose from, but Associated with clear management action
- 22. Why is automated oestrus detection different? Still many options to chose from, but Associated with clear management action OK performance (Rutten et al., 2013, JDS)
- 23. Lincoln University Dairy Farm, New Zealand 37-d breeding period - start Oct. 25 2010 635 cows with SCR – collars 320 activity only (AO) 315 activity and rumination (AR) Milk progesterone as gold standard Twice weekly during breeding period Field evaluation of two collar-mounted activity meters (Kamphuis et al., 2012, JDS)
- 24. 3 time-windows allow for mismatch of Gold Standard AO: 52 AR: 67 AO: 58 AR: 71 AO: 62 AR: 77 Sensitivity (%)
- 25. Changing activity alert threshold – AR collars 25
- 26. 26 Changing activity alert threshold – AR collars
- 27. Why is automated oestrus detection different? Still many options to chose from, but Associated with clear management action OK performance 80% Sensitivity 80% Success rate (Kamphuis et al., 2012, JDS)
- 28. Why is automated oestrus detection different? Still many options to chose from, but Associated with clear management action OK performance 80% Sensitivity 80% Success rate (Kamphuis et al., 2012, JDS) Investment is economically beneficial (Rutten et al., 2014, JDS)
- 29. A model for the Dutch situation
- 30. General culling Calving Ovulation Heat detection P(1st ovulation) P(heat) P(heat detected) P(culling) P(culling) P(culling) Simulated cow Parity, production level Insemination after voluntary waiting period Culling due to fertility issues - Max 6 inseminations - Not pregnant in wk 35 Replacement heifer Cow pregnant P(pregnant) P(early embryonic death) Next parity ∆ Milk yield ∆ Number of inseminations ∆ Number of calves produced ∆ Feed intake ∆ Number of culled cows ∆ Number of false alerts from PLF Output cow place /year Milk price Labour costs Cost for AI Costs/revenues of calves Costs feed Costs for culling Costs of false alerts PLF (labour or AI x € At farm level Probabilities are adjusted for each simulated week Costs of PLF technology: investment, maintenance, depreciation, replacement of faulty sensors Cow Model SN 50% SP 100% SN 80% SP 95% €108/cow €3600/herd 10years Checking each alert visually
- 31. Investing in automated oestrus detection Cash flow: 2,287 € / year Cost-Benefit ratio: € 1.23 Discounted payback period: 8 years Investment pays off (Rutten et al., 2014, JDS) SN 80%;SP 95% € 108/cow € 3600/herd 10years Checking each alert visually
- 32. Why is automated oestrus detection different? Still many options to chose from, but Associated with clear management action OK performance 80% Sensitivity 80% Success rate (Kamphuis et al., 2012, JDS) Investment is economically beneficial (Rutten et al., 2014, JDS)
- 33. New Zealand survey 500 farmers 25% wants it 7% has it 70% listed it in top 3 of technologies that gained benefit for farm (Edwards et al., 2014, APS) Adoption rates of automated oestrus detection systems 20% of all Dutch farms (Huijps, CRV, personal communication) Dutch survey 512 farmers 41% of AMS farmers has it 70% of CMS farmers has it (Steeneveld and Hogeveen, 2015, JDS) Survey 109 farmers globally 41% has it Rated as useful to very useful (Borchers and Bewley, in press, JDS) 35% of US respondents (Bewley, EAAP/EU-PLF conference, 2014)
- 34. Moving beyond oestrus detection
- 35. Moving beyond oestrus detection Explore other fields improve utilization of activity data
- 36. Lameness in the dairy industry Impacts welfare, productivity, profitability ~$28,000 per year on average NZ farm€16,500
- 37. Lameness in the dairy industry Impacts welfare, productivity, profitability ~$28,000 per year on average NZ farm Visual detection is common practice Challenging for large herds NZ farmers fail to identify ~75% of lame cows (Fabian, 2012; Whay et al., 2002) Whay et al., 2002) Lame? €16,500
- 38. Automated lameness detection 5 Waikato farms 4,900 cows 1.5 million milkings Sensor data every milking activity and milking order live-weight yield
- 39. Lameness events Trained Farmers Farmer observations Cow identification Date Affected limb Lameness score
- 40. Matched by farm, date 1 lame cow 10 non-lame cows Methods
- 41. -14 -13 -12 -11 -10 -9 -8 -7 -6 -5 -4 -3 -2 -1 0 Day Methods Day of observation Lame, n = 318 Non-Lame, n = 3,180 Activity High Low
- 42. 320 340 360 380 -14 -13 -12 -11 -10 -9 -8 -7 -6 -5 -4 -3 -2 -1 0 Day Change in Activity (steps / hour) ● Lame (n = 318); ○ Non-lame (n = 3,180) Day of observation Patterns through time were different (P<0.05)
- 43. ● Lame (n = 318); ○ Non-lame (n = 3,180) Changes in other sensor measurements 45.0 55.0 65.0 -14 -12 -10 -8 -6 -4 -2 0 Day Milking order 8.8 9.0 9.2 9.4 9.6 9.8 10.0 -14 -12 -10 -8 -6 -4 -2 0 Day Milk yield (kg) 470 475 480 485 490 495 500 -14 -12 -10 -8 -6 -4 -2 0 Day Weight (kg) Patterns through time were different (P<0.05) for all sensor measurements
- 44. Detecting lameness Values recorded during milking were averaged a daily value per sensor
- 45. Values recorded during milking were averaged a daily value per sensor Predictive variables were straightforward Proportional differences Day-1 to D-14 Absolute value on Day-1 n = 14 variables per sensor Detecting lameness
- 46. Values recorded during milking were averaged a daily value per sensor Predictive variables were straightforward Proportional differences Day-1 to D-14 Absolute value on Day-1 n = 14 variables per sensor Daily probability estimate for lameness Detecting lameness
- 47. Values recorded during milking were averaged a daily value per sensor Predictive variables were straightforward Proportional differences Day-1 to D-14 Absolute value on Day-1 n = 14 variables per sensor Daily probability estimate for lameness Leave-one-farm-out cross validation Detecting lameness
- 48. Detecting lameness Sensitivity SP = 80% SP = 90% Sensor Lame cows Lame cows ≥3 Lame cows Lame cows ≥3 Activity 26 39 14 27 Live weight 37 38 23 28 Milking order 33 44 21 28 All three 48 57 31 41
- 49. Detecting lameness Sensitivity SP = 80% SP = 90% Sensor Lame cows Lame cows ≥3 Lame cows Lame cows ≥3 Activity 26 39 14 27 Live weight 37 38 23 28 Milking order 33 44 21 28 All three 48 57 31 41
- 50. Detecting lameness Sensitivity SP = 80% SP = 90% Sensor Lame cows Lame cows ≥3 Lame cows Lame cows ≥3 Activity 26 39 14 27 Live weight 37 38 23 28 Milking order 33 44 21 28 All three 48 57 31 41
- 51. Detecting lameness Sensitivity SP = 80% SP = 90% Sensor Lame cows Lame cows ≥3 Lame cows Lame cows ≥3 Activity 26 39 14 27 Live weight 37 38 23 28 Milking order 33 44 21 28 All three 48 57 31 41
- 52. Detecting lameness Sensitivity SP = 80% SP = 90% Sensor Lame cows Lame cows ≥3 Lame cows Lame cows ≥3 Activity 26 39 14 27 Live weight 37 38 23 28 Milking order 33 44 21 28 All three 48 57 31 41
- 53. Detecting lameness Combining sensors outperformed single sensors consistently across farms
- 54. Detecting lameness Combining sensors outperformed single sensors consistently across farms Potential of using data already on-farm
- 55. Detecting lameness Combining sensors outperformed single sensors consistently across farms Potential of using data already on-farm Improvements required better predictive variables Autocorrelation matrix standard operating procedures
- 56. Moving beyond oestrus detection Explore other fields improve utilization of activity data
- 57. Predicting moment of calving Current status: expected calving date 267-295 days after successful insemination
- 58. Predicting moment of calving Current status: expected calving date 267-295 days after successful insemination 33% of calvings are difficult (Barrier et al., 2013)
- 59. Predicting moment of calving Current status: expected calving date 267-295 days after successful insemination 33% of calvings are difficult (Barrier et al., 2013) Can sensor data better predict moment of calving?
- 60. Predicting moment of calving Two Dutch dairy farms 583 cows with SensOor (Agis Automatisering BV, Harmelen, the Netherlands)
- 61. Predicting moment of calving Two Dutch dairy farms 583 cows with SensOor (Agis Automatisering BV, Harmelen, the Netherlands) Calvings caught on camera
- 62. Predicting moment of calving Two Dutch dairy farms 583 cows with SensOor (Agis Automatisering BV, Harmelen, the Netherlands) Calvings caught on camera
- 63. Predicting moment of calving Two Dutch dairy farms 583 cows with SensOor (Agis Automatisering BV, Harmelen, the Netherlands) 110 Calvings caught on camera
- 64. Dependent: hour in which calving started Basic: days to expected calving date (ECD) ECD = insemination date + 280 Predicting moment of start calving– two logit models
- 65. Predicting hour of start calving– two logit models Dependent: hour in which calving started Basic: days to ECD Extended: days to ECD + sensor data where these are relative changes for Ruminating Feeding Highly active Not active Temperature
- 66. Predicting hour of start calving– two logit models Dependent: hour in which calving started Basic: days to expected calving date (ECD) Extended: days to ECD + sensor data Data selection: 168 h before and including hour of start calving
- 67. Predicting hour of start calving Model SN at SP = 90% Basic 22 Extended 69
- 68. Predicting hour of start calving
- 69. Predicting hour of start calving ReasonableToo early?Impractical
- 70. Predicting hour of start calving Model SN at SP = 90% Basic 22 Extended (same hour) 69 Extended (same + previous hour) 81
- 71. Predicting hour of start calving Potential of using data already on-farm ‘Not active’ significantly added to the model
- 72. Predicting hour of start calving Potential of using data already on-farm ‘Not active’ significantly added to the model Not ready for practical implementation yet model not validated performance not good enough (SP too low)
- 73. Potential of using data already on-farm ‘Not active’ significantly added to the model Not ready for practical implementation yet model not validated performance not good enough (SP too low) Improvements required modelling techniques predictive variables Predicting hour of start calving
- 75. What I would like you to remember Adoption of PLF is expected to increase
Notas del editor
- Voorbeeld aanhalen, automatisatie melkput waardoor meer koeien per uur melken, dus uitgebreider maar daardoor minder tijd deze koeien moeten ook gezondh blijven maar daar is dan minder tijd voor monitoring health
- Aware entire session is called ‘Precision Livestock Farming’, so perhaps unnecessary. But, think of PLF similarly for duration of this presentation. PLF tools measure ‘something’, for example a cow’s activity, automatically, continuously and (near) real-time. PLF aims at helping end-users in their decision-taking management processes or at reducing dependency on human labour. Examples, pedometers can aid in insemination decisions, automatic milking replace a significant amount of hard and repetitive labour. PLF is emerging, supported with 126 publications on 139 PLF technologies past decade. Moreover, national and EU-funded projects that focus on implementation of PLF on-farms (SDF and All Smart Pigs). Finally, emerging international conferences dedicated to PLF (smartagrimatics and PDC in 2016, mentioned by Wilma Steeneveld. So, a lot is going on in the field of PLF, but....
- Aware entire session is called ‘Precision Livestock Farming’, so perhaps unnecessary. But, think of PLF similarly for duration of this presentation. PLF tools measure ‘something’, for example a cow’s activity, automatically, continuously and (near) real-time. PLF aims at helping end-users in their decision-taking management processes or at reducing dependency on human labour. Examples, pedometers can aid in insemination decisions, automatic milking replace a significant amount of hard and repetitive labour. PLF is emerging, supported with 126 publications on 139 PLF technologies past decade. Moreover, national and EU-funded projects that focus on implementation of PLF on-farms (SDF and All Smart Pigs). Finally, emerging international conferences dedicated to PLF (smartagrimatics and PDC in 2016, mentioned by Wilma Steeneveld. So, a lot is going on in the field of PLF, but....
- Lists goes on: Reduce costs Reduce stress Safe labor
- Finish with first part of the presentation Start with second one, the success story of automated heat detection
- RUTTEN TOEVOEGEN ALHIER
- AR, maar alleen activity meegenomen!
- Neem tijd om dit allemaal uit te leggen
- Wij zeiden dat SN op zijn minst 80% moest zijn, daarvoor moest th verschoven worden en success rate bleek ook 890% te zijn. Dat leek ons van praktische waarde. Duidelijk maken dat balans SN en SR kan verschillen voor verschillende situaties
- With vervangen door
- 20% dutch farmers boven steenveld. Ook kentucky is vertekend beeld want alleen mensen met sensoren algemeen zullen de survey beantwoorden Meest fair is NZ en CRV Maar meanstream sensor geworden
- Since farmers already have activity data, is it possible to add even more (economic) value by using the same data for other dairy cow health management areas?
- Jessica Fabian, thesis of massey university, PN Make sure you mention that it is difficult to see that specific cow is lame
- Jessica Fabian, thesis of massey university, PN Make sure you mention that it is difficult to see that specific cow is lame
- All same sensors! 1.5 years data collection Scale and relevance, data from the field
- All same sensors!
- Stress that this is an imaginary example! Mention that non-lame cows were not allowed to have a lameness record throughout data collection period. Make sure that you mention ‘compare pattern changes in behaviour and physiology 14 days before the cow was observed lame by the farmer
- Stress that this is an imaginary example! Mention that non-lame cows were not allowed to have a lameness record throughout data collection period. Make sure that you mention ‘compare pattern changes in behaviour and physiology 14 days before the cow was observed lame by the farmer
- Mention not interested in risk factors, so not interested that lame cows seem less active then non-lame cow but we’re interested in the pattern difference because that is what a detection model needs to identify
- Good result because it tells us that sensors can pick up changes in behaviour and physiology associated with lameness
- Since farmers already have activity data, is it possible to add even more (economic) value by using the same data for other dairy cow health management areas?
- Negative impact cow health Higher mortality rate of calves Negative impact image
- Negative impact cow health Higher mortality rate of calves Negative impact image
- Negative impact cow health Higher mortality rate of calves Negative impact image
- Succesful insemination date!
- Succesful insemination date!
- Succesful insemination date!
- Succesful insemination date! 168 h = 7dagen