Chap3 m0-why pub i is important-pp6
•
0 recomendaciones•492 vistas

Chap3 m0-why pub i is important-pp6

Recomendados
Recomendados
Más contenido relacionado
La actualidad más candente
La actualidad más candente (20)
Similar a Chap3 m0-why pub i is important-pp6
Similar a Chap3 m0-why pub i is important-pp6 (20)
Más de Dao Hoa
Más de Dao Hoa (20)
Último
Último (20)
Chap3 m0-why pub i is important-pp6
- 1. DEVELOPMENT COMMITTEE (Joint Ministerial Committee of the Boards of Governors of the Bank and the Fund On the Transfer of Real Resources to Developing Countries) INTERNAT IONAL BANK FOR WORLD BANK RECONSTRUCTIO N AND DEVELOPMENT DC2007-0004 March 28, 2007 FISCAL POLICY FOR GROWTH AND DEVELOPMENT FURTHER ANALYSIS AND LESSONS FROM COUNTRY CASE STUDIES Attached for the April 15, 2007, Development Committee Meeting is a background report entitled “Fiscal Policy for Growth and Development Further Analysis and Lessons from Country Case Studies,” prepared by the staff of the World Bank. * * *
- 2. INTERNATIONAL BANK FOR RECONSTRUCTION AND DEVELOPMENT AND THE INTERNATIONAL DEVELOPMENT ASSOCIATION FISCAL POLICY FOR GROWTH AND DEVELOPMENT Further Analysis and Lessons from Country Case Studies March 22, 2007
- 3. ACRONYMS AAC Aid Access Countries AIDS Acquired Immune Deficiency Syndrome CEM Country Economic Memorandum DEC Development Economics, World Bank ESW Economic and Sector Work GBC Government Budget Constraint GDP Gross Domestic Product GFS Government Finance Statistics Hi-AAC Aid Access Countries with high aid inflows Hi-MAC Market Access Countries with a relatively high level of public expenditure HICs High Income Countries HIV Human Immunodeficiency Virus HIPC Heavily Indebted Poor Country IMF International Monetary Fund LICs Low Income Countries Low-AAC Aid Access Countries with low aid inflows Low-MAC Market Access Countries with a relatively low level of public expenditure MAC Market Access Countries MICs Middle Income Countries MTEF Medium Term Expenditure Framework MAMS Maquette for MDG Simulations MDGs Millennium Development Goals MDG-1 Target 1 of Millennium Development Goals MDRI Multilateral Debt Relief Initiative OECD Organization for Economic Cooperation and Development PEFA Public Expenditure and Financial Accountability PER Public Expenditure Review PFM Public Financial Management PPP Public Private Partnership PRSP Poverty Reduction Strategy T&C Transport and Communication VAT Value-Added Tax ACKNOWLEDGEMENTS This paper was prepared under the supervision of D. Leipziger (PREM VP), directed by S. Pradhan (Director, PRMPS) and task managed by A. Rajaram (Lead Economist, PRMPS). S. Shetty (Director, AFR PREM) and K. Krumm (Sector Manager, AFR PREM) provided guidance. Contributors from the PREM, HD and INF Networks and country teams: D. Benitez, Prof. D. Bevan (consultant), B. Bidani,, N. Biletska, M. Brownbridge (consultant), W. Butterfield (consultant), C. Briceno Garmendia,, J. L. Calix, S. Canagarajah, A. Estache, K. Ezemenari, V. Foster, K. Gassner, Prof. N. Gemmell (consultant), P. Gottret, D. Haazen, P. Kumar, T.M. Le, E. Ley, A. Manroth, D. L. Merotto, M. Mills, B. Moreno-Dodson, C. Obidegwu, B. Pinto, J. Rojchaichaninthorn, P. Saavedra, A. Seck, V. Songwe, L. Sondergaard, A. Soucat, P. Suriyaarachchi (consultant), Z. Swift, M. Thomas, M. Vagliasindi, A. Varoudakis, S. von Klaudy, M. Vujicic, P. Wade, E. Weisman and M. Wes.
- 4. Fiscal Policy for Growth and Development Further Analysis and Lessons from Country Case Studies March 22, 2007 Contents Executive Summary ........................................................................................i I Introduction........................................................................................1 II. The Debate over “Fiscal Space” ........................................................3 III. Evidence on Public Spending and Growth ........................................6 IV. A Growth-Oriented Approach to Fiscal Policy .................................7 V. Country Case Studies.......................................................................10 VI. Conclusions and Operational Implications ......................................29 Boxes Box 1: Iteration between Goals and Resource Constraints...............9 Box 2: Modeling Public Expenditure and Growth .........................10 Box 3: Country Case Studies ..........................................................14 Figures Figure 1: Growth-Oriented Fiscal Policy Schematic ........................8 Figure 2: Expenditure, Revenue and Deficit Levels.......................11 Figure 3: Navigating in Fiscal Space ..............................................13 Annex Material ............................................................................................36 Table A1: Economic Growth and Fiscal Indicators 2003-05 .........37 Table A2: Summary of Recent Results for Developed Countries ..44 Table A3: Summary of Recent Results for Developing Countries.45 Annex 1: The Microeconomics of Expenditure Decisions .............38 Annex 2: Theory and Evidence on Public Expenditure and Growth 41 Annex 3: Public Expenditure in Six High Growth Countries.........47 Annex 4: Revenue Mobilization .....................................................50 References........................................................................................51
- 6. EXECUTIVE SUMMARY A. Introduction i. In September 2005 the Development Committee requested Bank management to provide advice on using fiscal policy to better support growth and development. The request reflected the widely held perception that the conventional approach to fiscal policy largely focused on the macroeconomic stabilization objective and: (a) neglected the role of fiscal policy in helping achieve the objective of higher economic growth, and (b) did not sufficiently tailor fiscal policy advice to the needs of countries at different stages of development. ii. In an interim 2006 report, the Bank suggested that the design of fiscal policy should incorporate both the stabilization and growth objectives explicitly.1 It concurred with the view that in the 1980s and 1990s, fiscal policy focused largely on the goal of stabilization and under-emphasized the growth objective. The assumption that stabilization will lead to higher growth has not always been borne out. With stabilization having been achieved in many countries, the design of fiscal policy needs to identify and incorporate how public spending, taxation, aid and borrowing may stimulate long-term growth and poverty reduction. The report proposed to undertake a number of country case studies to consider how an approach to fiscal policy could be developed that would be responsive to the growth needs of countries at different stages of development while maintaining macroeconomic stability. iii. The goals of macroeconomic stability and growth are related and fiscal policy design must reflect this complex relationship. There is consensus that macroeconomic stability is a necessary condition for sustainable growth and that the design of stabilization programs must be improved to enhance growth prospects. The quality (speed and composition) of fiscal adjustment during stabilization often impinges on growth. A fiscal adjustment that relies unduly on cuts in investment or excessive revenue enhancements may lower an economy’s growth trajectory. Fiscal policy design therefore needs to ensure that the quality of fiscal adjustment minimizes adverse consequence for growth. Even after successful stabilization, a growth-oriented fiscal policy, together with monetary and exchange rate policies, will need to maintain macroeconomic stability. iv. Countries at different stages of development face different needs and constraints that need to be reflected in fiscal policy design. All countries and their governments are subject to the inter-temporal budget constraint which defines the limits of the room for fiscal maneuver. But poorer countries face a particularly large mismatch between their growth and development needs (physical infrastructure, delivery of critical health and educational services, protection of the vulnerable) and their public financing 1 Development Committee (2006), “Fiscal Policy for Growth and Development: An Interim Report”, background paper for the April 2006 meeting of the Development Committee of the World Bank and the IMF. i
- 7. capabilities (a narrow tax base, limited ability to borrow and service debt). Access to external aid potentially narrows the gap, but raises issues of predictability and donor earmarking of aid resources. Demographics and health issues also play an important role. AIDS has a large development as well as fiscal impact, reducing the productive and fiscal potential of affected economies. Many middle and higher income countries face the fiscal challenge of providing for aging populations while also mobilizing resources for investment. v. The report focuses on the challenge of designing a growth-oriented fiscal policy for economies where higher growth is presumed to be constrained by fiscal policies. While recognizing that the over-arching objective is sustained poverty reduction, the paper focuses on economic growth as an important and necessary means to reduce poverty, and investigates the role of fiscal policy in that regard. Fiscal policy may be discouraging growth either because (i) the tax system has major disincentive effects, (ii) the level of expenditure is inadequate or the efficiency of spending is very poor, or (iii) the composition of expenditure is tilted away from productive activities. Alternatively, the credibility of fiscal policy itself may be an issue because of past policy performance. vi. Fiscal policy decisions reflect the societal preferences and political economy of a country. Public expenditure and taxation policies are fundamentally political choices which reflect the political economy and institutional arrangements in a country. While acknowledging this fact, the presumption underlying this paper is that the quality of fiscal policy decisions could be improved if: (a) they were informed by ex-ante policy analysis that clarified the likely growth and distributional consequences of alternative choices; and (b) planning and fiscal institutions enabled political actors to take a longer term perspective and supported a contestable process for determining policy decisions. vii. This report synthesizes insights from good practice in public finance as well as twelve ongoing country case studies which pilot a growth-oriented approach to fiscal policy design. The purpose of the case studies is to learn when and how fiscal policy can be shaped to usefully contribute to growth. A related objective is to identify what aspects of the Bank’s work can be enhanced in order to assist governments develop viable medium-term growth strategies that enable countries to aim higher yet stay within the limits that macroeconomic stability requires. B. A Growth-Oriented Approach to Fiscal Policy viii. A common diagnostic approach was used to guide the design of a growth-oriented fiscal policy in the country case studies. Study teams sought to identify constraints to higher growth and to assess if these were “fiscal constraints”, requiring changes in public expenditure or taxation to address them. The diagnostic was used to identify whether improvements in efficiency of expenditure or taxation would remove the constraint or if it would be possible to shift resources from less productive uses by changing the composition of expenditure. The case studies attempt to identify the efficiency of expenditure in key sectors, a difficult exercise given problems of data availability. An increase in the level of expenditure may also be considered to address the growth constraint if possible fiscal savings from efficiency or cuts in low value ii
- 8. expenditure are inadequate or not possible. Where a level shift is required, the implications for financing are to be considered and the costs of such financing compared to the benefits. For a realistic fiscal policy that is consistent with stability to take shape iteration between growth goals and constraints will be necessary, making the resource constraint endogenous to the iterative process. Appropriate fiscal institutions (deliberations between planning and finance ministries, for example), and coordination between the Bank and the IMF, can help discipline and inform this iteration process. C. Country Case Studies ix. Twelve countries with different fiscal/development profiles were selected for the case studies.2 Their per capita incomes range from $230 (Rwanda) to $4710 (Turkey). Growth rates in the twelve countries over the most recent 3 year period ranged from 9.2 percent in Tajikistan to 2.6 percent in Brazil, with a median growth rate of 5.1 percent per annum. Six of the countries have some degree of access to grant aid, in terms of their primary source of external financing, and the remaining six generally rely on market-based borrowing to supplement domestic revenue. Accordingly, we classify the countries as Aid Access countries (AAC) or Market Access countries (MAC). x. Domestic revenue effort varies significantly across the 12 countries. Brazil, Turkey and Ukraine cluster towards the high end of the scale with high revenue and expenditure shares of GDP and are classified as Hi-MAC for the purpose of the study. Rwanda, Uganda, and Madagascar raise only 10-14 percent of revenue, but spend 20-28 percent of GDP. Their large fiscal deficits are financed by high aid inflows of 10-14 percent of GDP and these countries are classified as Hi-AAC. The other six countries have revenue and expenditure shares in the 15-30 percent range. We classify Cameroon, Kenya and Tajikistan as low-AAC since grant aid shares are low while India, Morocco and Philippines are classified as low-MAC, since size of government is low relative to the Hi-MACs. xi. The case studies reveal a variety of “fiscal constraints” to growth. While the case studies are illustrative, they do highlight key issues in each country. In many, the constraints to higher growth or continued high growth were identified as relating to physical public infrastructure – for example, Uganda, Kenya, Rwanda, Madagascar, Brazil, India, and Turkey. In some, the tax burden was identified as a disincentive for private investment and growth – for example, Brazil, Turkey, Ukraine, Morocco, Rwanda. In Uganda, Rwanda, and Madagascar, while governments confront the challenge of providing basic education to a predominantly young population, the lack of skilled labor was also seen as limiting foreign investment and future growth. Health investments are under-funded in Morocco. In Morocco and Tajikistan, infrastructure was not seen to be a constraint to growth, but the maintenance of existing infrastructure was felt to be important for sustained growth. In Tajikistan, non-fiscal constraints relating to regulation and the investment climate were seen to be more critical constraints to growth. 2 The countries are Brazil, Cameroon, India, Kenya, Madagascar, Morocco, Philippines, Rwanda, Tajikistan, Turkey, Uganda and Ukraine. iii
- 9. xii. The case studies confirm that the appropriate way to enhance the growth impact of fiscal policy varies with country characteristics. In most countries, improvements in efficiency provide a potentially important means to improve sector outputs and enhance growth. Estimating fiscal savings or growth effects from efficiency gains requires detailed sectoral assessments which are made difficult because of data limitations.3 Shifting the composition of expenditure from low priority to growth related expenditure is also likely to be a significant basis for improving the growth impact of fiscal policy in many countries. Brazil, Ukraine and Turkey would have a stronger growth stimulus if they relied on improved composition and efficiency of expenditure. In some countries, such as India and Morocco, improving the efficiency of tax policy would improve the growth orientation of fiscal policy and, in India’s case, enable the government to enhance revenue collection and reduce the fiscal deficit. An increase in the overall level of public expenditure to address the constraints to growth appears to be suggested mainly for Rwanda, Madagascar and Uganda. In these countries, the increased expenditure would need to be financed by predictable aid, appropriately linked to improvements in outcomes. In some countries, governance concerns will have to be addressed to permit higher aid flows. D. Conclusions and Implications xiii. A major conclusion that emerges is the need for explicit development of growth-oriented fiscal policy scenarios to inform the design of an overall macroeconomic policy package. This would allow countries to identify and address country-specific constraints to higher growth. Some iteration between growth objectives and resource constraints will be required to achieve the appropriate design of fiscal policy for achieving higher growth with stability, consistent with the inter-temporal budget constraint. Operationalizing such an approach will require scenario analysis because it is difficult to accurately anticipate the growth impact of fiscal policy. The development of growth scenarios will require detailed, country specific analysis of key fiscal-growth linkages. Such analysis will help inform policy makers on the inter-temporal trade-offs involved in various policy choices. xiv. The growth impact of fiscal policy is directly related to the efficiency of resource use. The quality of governance and management in the public sector has a major influence on the efficiency of resource use and therefore on the growth impact of any particular category of public expenditure. Improving efficiency will require efforts to address the governance and management constraints specific to each sector while also strengthening budgetary processes. xv. The composition of expenditure is another fundamental determinant of the growth impact of fiscal policy. Governments that aim to achieve higher growth have to align the composition of expenditure to address country-specific constraints to growth, allocating resources to areas with the highest economic or social returns. Identifying and assessing such trade-offs may help governments adjust their policy priorities and expenditure choices. 3 The country cases attempt to assess the scope for efficiency gains in the health, education and infrastructure, using pragmatic approaches to assess cost efficiency and effectiveness iv
- 10. xvi. The level of expenditure that can be sustained is related to the capacity of a country to raise revenue efficiently. This underlines the importance of establishing a broad based and income-elastic tax system with a capable and efficient tax administration. The greater the efficiency of taxation and expenditure policies, the higher the level of expenditure that can be sustained. xvii. Fiscal institutions and budget processes determine the capability to undertake an effective growth-enhancing fiscal policy. Embedding a longer term growth objective in an operational fiscal strategy requires a high degree of government planning, coordination and implementation. Governments need effective institutions to raise revenue, to maintain fiscal discipline, to determine the composition of the budget and to utilize resources efficiently. Most countries require sustained effort to strengthen these capabilities across the public sector. Implications for Country Authorities xviii. Institutions that enable a government to adopt and implement a long term perspective can support a growth-oriented approach.4 Many countries have initiated long term vision statements or commitments to the MDGs that will require stronger institutional support. Close coordination between planning, finance and sector ministries is often critical to a longer-term growth strategy that is consistent with macroeconomic stability. xix. A transparent, evidence-based approach can help governments make informed policy choices. Most decisions on resource allocation will involve trade-offs, including inter-temporal ones, that will have political economy implications. Policy analysis that makes the trade-offs explicit may help improve policy decisions. Highlighting the adverse growth implications of decisions to cut investment may help governments to protect such expenditure. xx. Indicators of longer term fiscal health could guide fiscal management. Conventional fiscal indicators provide an inadequate basis for long term decisions. Indicators that approximate a net worth measure of the public sector balance sheet could complement the fiscal deficit and provide a better basis for fiscal management but should be pragmatically implemented, taking account of country circumstances. A first step could be to record and report an inventory of public sector assets in addition to a full record of liabilities. xxi. Measures to improve the composition and efficiency of the budget have a high growth payoff. Too often fiscal policy choices are viewed in terms of the scope to increase expenditure through borrowing. Periodic public expenditure reviews and tracking surveys could help country authorities identify ways to achieve higher growth 4 As noted, a number of the case study countries have initiated long term development vision statements, such as the Kenya 2030, Rwanda and Madagascar MAP These will need to be supported by fiscal strategies and coordinated implementation. v
- 11. with available resources. Performance oriented management in the sectors would also help address specific sources of inefficiency and waste. xxii. Governments could strengthen key aspects of budget formulation and execution to improve the growth impact. Ongoing efforts to implement the MTEF in many countries will help governments articulate growth oriented fiscal scenarios and link budget decisions to address fiscal constraints to growth. Strengthening the process for selection and implementation of investment projects will also have a significant payoff. Implications for Development Partners xxiii. Donor governments can support country authorities if they follow through on commitments to provide aid that is more predictable and subject to fewer conditions and earmarks. While aid should be linked to performance, the trend towards greater use of aid earmarked to particular goals is problematic. The task of fiscal policy management will be made more difficult if aid flows are unreliable and unpredictable and if aid quality is seen as poorly aligned with country priorities. xxiv. Development partners may need to extend the time horizon for high aid flows for some countries. If some low-income countries are unable to raise domestic revenue shares significantly because of structural constraints, aid-flows may have to be sustained over a longer time horizon so long as aid is effectively utilized. Implications for the Bank xxv. The Bank will have to play a significant role in developing techniques to better assess the impact of fiscal policy on growth. Both sector level data collection and analysis of the effectiveness of public spending, including systematic cost benefit analysis of major public programs, would help improve resource allocation. The development and use of models such as MAMS for evaluating the growth implications of alternative fiscal policy scenarios will have to be encouraged. xxvi. While enhancing its work on fiscal policy, the Bank will need to continue its support to public finance management. Over the last decade the Bank has focused a good deal of its attention on public finance management. Helping countries strengthen budget systems and implement a Medium Term Expenditure Framework (MTEF) linked to the PRS or similar development strategy will remain highly relevant. It will be especially important to help countries strengthen systems for project and program evaluation to improve the efficiency of public investment, and to support governance reforms that improve transparency and accountability for the use of budget resources. xxvii. The timeliness and content of Bank advice will be critical. In large part, the periodicity of the Bank’s advice will be determined by the budget cycle of member governments as well as the need for effective coordination with the IMF. vi
- 12. Implications for Bank-Fund Collaboration xxviii. Both the Bank and the Fund are committed to assisting countries improve fiscal policy design to promote growth while maintaining stability. Success in this effort requires inputs from both institutions and in that context collaboration will be critical. An upstream exchange of views on longer-term growth-related aspects of fiscal policy would help both the Bank and the Fund better frame their advice. This is likely to involve some iterative process that could be usefully structured to ensure that it is timely and institutionally supported on both sides. A joint effort to improve the quality and availability of public finance data will also enable important empirical analysis to guide policy advice from both institutions. E. Actions to be Considered 1) Stronger growth-oriented public finance work: A set of workshops will be held to review and enhance Bank guidance for public finance reviews to enable staff to consider the dynamics of fiscal policy and address the fiscal-growth linkage in ESW. 2) Wider application of modeling techniques: The MAMS model has now been applied in a number of countries and has proven useful for scenario analysis for economic goals, including growth, poverty reduction and the achievement of the MDGs. The Bank could take steps to encourage application of this technique for a broader range of countries as part of a roll-out of the new guidance. 3) Joint initiative with IMF to improve public finance data: Both the Bank and the IMF have an interest in improving the quality and usefulness of GFS data for policy analysis. It is proposed that the Bank initiate a dialogue with the IMF on specific actions that will achieve this. 4) Bank-wide effort to improve data and methods of efficiency analysis: Building on work initiated for the case studies with the Human Development and Infrastructure Networks, an inter-network initiative is proposed to enhance the development of methods, as well as collection and use of data, to strengthen efficiency analysis. 5) Program of research on public expenditure, taxation and growth in collaboration with Regions and DEC. The profile of fiscal policy concerns justifies a strong Bank-supported research effort to develop further insights on a range of relevant issues, including the role of fiscal policy, fiscal institutions and governance on growth and poverty objectives. vii
- 13. Fiscal Policy for Growth and Development Further Analysis and Lessons from Country Case Studies I. Introduction 1. In September 2005 the Development Committee requested Bank management to provide advice on using fiscal policy to better support its growth and development goals. The request reflected the widely held perception that the conventional approach to fiscal policy largely emphasized the macroeconomic stability objective and: (a) neglected the role of fiscal policy in supporting higher growth, and (b) did not sufficiently tailor fiscal policy advice to initial conditions of countries at different stages of development. 2. The Bank provided its perspective in an interim report (2006) to which the current report is a sequel. The interim report made the following main points – (a) that macroeconomic stability was a necessary but not a sufficient condition for economic growth and development, (b) that the design of fiscal policy should explicitly seek to take account of both objectives – macroeconomic stability and long term growth, (c) that the design of an appropriate growth-oriented fiscal policy for any country should factor in the initial conditions in that country, including its fiscal history and reputation, its public finance potential and its growth and development needs, (d) that a key link between fiscal policy and growth or other development objectives would benefit from a deeper understanding of the effects of public expenditure levels, composition and efficiency, and (e) that the role of institutions and governance are critical to ensuring that public spending has the desired impact on policy objectives, including growth. 3. Countries at different stages of development face different needs and constraints that need to be reflected in fiscal policy design. All countries and their governments are subject to the inter-temporal budget constraint which limits the room for fiscal maneuver. But poorer countries face a particularly large mismatch between their growth and development needs (physical infrastructure, delivery of critical health and educational services, protection of the vulnerable) and their public financing capabilities (a narrow tax base, limited ability to borrow and service debt). Access to external aid potentially narrows the gap, but raises issues of predictability and earmarking of resources. Demographics also play an important role. Many middle and higher income countries face the fiscal challenge of providing social security and social assistance programs for aging populations while also maintaining adequate levels of public investment. 4. Fiscal policy decisions reflect societal preferences and the political economy of a country. Public expenditure and taxation policies have implications for the scope and incidence of government services, for growth and for income distribution. As such, they are fundamentally political choices that may be derived from the country’s process for articulating and debating policy objectives and options and obtaining political endorsement through a legislative process. That process, which reflects the political
- 14. economy and institutional arrangements in the country, will determine the shape of fiscal policy and the composition of expenditure and taxation. In many countries, fiscal policy changes that would promote growth, such as eliminating unproductive subsidies or closing tax loopholes, may be blocked by political opposition from vested interests.5 The presumption underlying this paper is that the quality of fiscal policy decisions could be improved if: (a) they are informed by ex-ante policy analysis that clarifies the likely growth and distributional consequences of alternative choices; and (b) planning and fiscal institutions enable political actors to take a longer term perspective and support a contestable process for determining policy decisions. 5. The current paper describes a growth-oriented approach to fiscal policy design and reports on insights, including from the ongoing case studies which have sought to apply the approach. Economic growth is not an end in itself but a means to the overall objective of sustained poverty reduction. As such, governments have to also ensure that the quality of growth is pro-poor, is environmentally sustainable, and is supplemented with direct interventions that help the poor and vulnerable. The purpose of the case studies is to learn when fiscal policy could usefully be reshaped to further growth objectives and how this might be achieved in different circumstances. Growth may often be constrained for a variety of non-fiscal reasons (e.g., political uncertainty, poor enforcement of property rights.); however, this assessment focuses on cases where the initial conditions are such that the limitations to higher growth are prima facie felt to be of a fiscal nature. A related objective is to identify what aspects of the Bank’s work would need to be enhanced in order to assist governments better develop viable medium-term growth and fiscal strategies that are consistent with macroeconomic stability. 6. The paper is structured as follows: Section II provides a brief discussion of the main perspectives in the debate on “fiscal space for growth” and indicates a potentially unifying perspective to reconcile the various views. Section III provides a summary of Annexes 2 and 3 which review the evidence linking public expenditure and growth in developed and developing countries, identifying typical expenditures that are shown to be growth-related. Section IV then proposes a “growth-oriented approach” to fiscal policy design that provides a diagnostic to guide the use of fiscal policy to address constraints to growth. Section V reports on the highlights and lessons learnt from application of this approach to 12 country case studies. Section VI draws conclusions and implications for country authorities and development partners as well as specific operational implications for the Bank’s analytical approach and work on fiscal/public expenditure issues. It also provides some views on the possible improvements in the Bank’s guidance and tool kit and arrangements for Bank-Fund collaboration to ensure appropriate coordination of views on growth and stability. Annex material provides additional detail for specific discussion referenced in the text. 5 There is a growing literature on the political economy of budgeting which, while relevant, is beyond the scope of this paper. See Keefer and Khemani (World Bank, 2003) and Besley and Burgess (QJE 2002) for examples and further references. 2
- 15. II. The Debate Over “Fiscal Space” 7. The renewed focus on fiscal policy and growth has spawned a lively debate over demands for greater “fiscal space” to support growth. Some proponents question the design of fiscal policy at the macroeconomic level, suggesting that stabilization has often been achieved by cutting expenditures that are productive, thereby sacrificing growth. Others base their argument for “fiscal space” for growth or welfare promoting activities on the basis of micro-economic criteria, suggesting that conventional fiscal policy and associated fiscal rules distort sensible micro-economic choices that would improve government net worth or overall welfare. It has also been suggested that the approach to fiscal policy has a bias that ignores the development payback from human capital investments. The macro-micro interface therefore needs to be clarified to identify the real issues around fiscal policy and growth, acknowledging the key role of the inter-temporal budget constraint. 8. Without seeking to address all the nuances of the debate, this paper offers an integrated perspective which may prove useful in framing the fiscal policy discussion. First, it acknowledges that a full understanding of fiscal policy and growth with stability requires integration of three related perspectives – (a) macroeconomic (b) microeconomic and (c) institutional. Macroeconomic considerations are clearly relevant for aggregate fiscal policy and the fiscal deficit and related measures are necessary for defining a stabilization program, but how such a program can be reconciled with growth needs to be clarified. How project or program level micro-economic decisions should be undertaken so that governments can promote economic or social objectives consistent with the inter-temporal budget constraint also needs to be better understood. And most critically, the importance of institutions for policy design and implementation to support fiscal policy needs to be highlighted. Institutions create the incentives for fiscal discipline, prioritization in expenditure composition, and efficiency in public sector performance and are often the weakest link between fiscal policy, growth and welfare outcomes. 9. With regard to the macroeconomic perspective, there are a number of constituencies that believe policy packages could be improved to deliver more growth without sacrificing stability. In many developing countries, there has been a significant improvement in the quality of macroeconomic management, in general, and fiscal policy, in particular. For these countries, stabilization has been substantially achieved, though ensuring maintenance of this stability will remain a policy concern for the indefinite future. Despite this success, there remains pervasive disquiet about the current formulation and conduct of fiscal policy based partly on the perception that stabilization and the maintenance of stability may have been purchased at an unnecessarily high price in terms of foregone output and welfare.6 6 In the interim report (DC 2006), this had been expressed in terms of the need to consider whether there was unexploited “macroeconomic space” that would enable governments to better accommodate growth related expenditure without risking macroeconomic stability. 3
- 16. 10. Fiscal policy design could better incorporate growth objectives if stabilization programs adapted the speed and composition of fiscal adjustment. There is a consensus that macroeconomic stability is a necessary condition for growth, but also a widespread conviction that the design of stabilization programs should be improved to enhance growth prospects. Both the speed and composition of fiscal adjustment during stabilization may impinge on growth and on the durability of stabilization itself. Country experience suggests that very rapid adjustments may cause severe output losses under some circumstances. As regards composition, a fiscal adjustment that relies disproportionately on cuts in investment or other productive expenditure may lower an economy’s growth trajectory. In some countries, an adjustment based on excessive revenue enhancement may depress private investment incentives and thus growth. The quality of fiscal adjustment during stabilization should therefore be factored into fiscal policy design to minimize any adverse consequence for growth.7 11. The principal avenue for fiscal policy to influence growth comes from adopting a longer-term perspective. The range of options that are available with regard to tax and expenditure policies is necessarily restricted in the short to medium term. A longer time horizon, however, provides both a better way to consider inter-temporal trade-offs and offers increased scope to shift expenditure and tax policies in ways that might be significantly more growth promoting. The challenge is that policy makers typically have limited information and analysis to support decisions involving inter-temporal trade-offs. This is an area where further work is needed, but where growth scenario analysis may provide some basis for improving fiscal decisions. 12. The microeconomic perspective is a complementary view that is relevant for public expenditure decisions but needs to be consistent with overall macroeconomic judgments. The example of a project that would provide a financial return higher than its financial cost but is rejected by a deficit criterion is often cited to illustrate a possible inconsistency between macroeconomic fiscal rules and microeconomic criteria.8 If both approaches were derived from a fully consistent general equilibrium framework, the possibility of inconsistency would not arise. In reality, given the lack of such a framework, a conflict is in principle possible. Faced with the possible exclusion of a high fiscal value project because of a rule, the first step would be to check that the existing planned expenditures also satisfied the macroeconomic criteria. If not, a switch in composition would make it possible to add the project without breaching the macroeconomic criteria. If this possibility has been excluded, and unless the project is very large relative to the economy, an additional project of this type could be accommodated by raising the deficit target, provided the returns are robustly estimated, have little uncertainty, and allow government to recoup its investment over time.9 7 A recent review by the IMF’s Independent Evaluation Office (IEO) points to the need for Fund programs to take account of sectoral constraints and opportunities that may be identified in Bank analysis and which may suggest ways to shape fiscal programs. See IEO (2007). 8 See Easterly and Serven (2003). 9 This is intentionally a tall hurdle that should be used to ensure that projected rates of return are realistic, factoring in past performance and credibility of the implementing agency. 4
- 17. 13. The financing of public goods and merit goods is another aspect of the debate. How should microeconomic criteria be applied to projects where the financial return may not cover costs but where significant indirect, non-financial benefits are expected, as with many public goods and externality generating activities? Annex 1 provides a technical discussion of the criteria that would apply to public expenditures that may generate financial benefits for the private sector or non-financial benefits for citizens at large. It is clear that to be economically viable and sustainable, such projects will have to be financed in full or in part by general tax revenue and therefore the decision criteria must include consideration of the marginal cost of taxation. Even for projects with a high development payback, decisions must be based on sound cost benefit analysis in order to be consistent with the government’s inter-temporal budget constraint. 14. Macroeconomic and microeconomic policy decisions are assisted and sustained by institutions that will create the necessary information and incentives. Effective budgetary institutions (including rules and procedures that limit discretion) and management and staff incentives in public sector agencies are critical to ensuring that fiscal policy and public expenditure have a positive effect on long term growth and development performance. It is also clear that the quality of institutions contributes to the government’s fiscal reputation – a bad reputation (past deficits, debt defaults, high inflation, or public sector corruption and waste) reflects weak institutions and limits the government’s room to maneuver by limiting access to credit or aid and through reducing tax compliance. 15. Fiscal institutions must be capable of managing the specific challenges that confront a particular country. In general, fiscal institutions should be able to adopt a longer term perspective, looking beyond the typical annual budget. Uncertainty with regard to revenue, including aid predictability, is a problem in many countries. Commodity price shocks can pose particular challenges for countries that rely on commodity revenue to finance the government budget. In general, policy advice is to save the windfall in good times in order to ride out the downturns. The same advice holds for governments during a business cycle, with automatic stabilizers used to provide some countercyclical thrust. However, when fiscal discipline is weak, countries display pro-cyclical behavior, ratcheting up expenditure or cutting taxes during good times when revenue is high. This tends to increase the debt level over successive business cycles, ultimately leaving little room for deficit financing during a downturn. Countries with high debt levels face problems of access to market financing precisely when countercyclical borrowing would be required. 16. Fiscal rules or fiscal responsibility laws work when the underlying institutions and political commitment are supportive. 10 The underlying cause of pro- 10 Rules are often bent or broken and offer no guarantee. See IMF (2005) for a discussion of various forms of such rules and conditions under which they improve fiscal outcomes. Other rules are discussed in Easterly, et. al. (2006). Some countries have adopted fiscal rules to protect public investment from limits imposed by the fiscal deficit. The U.K. adopted the “golden rule” which allows the government to borrow for public investment, subject to a limit on the debt stock. 5
- 18. cyclicality is often a problem of fiscal discipline such that governments have little scope to maneuver to offset cyclical downturns. The main purpose of a fiscal rule is to signal that a government intends to restrict its scope for discretionary action in the fiscal sphere. For this to be credible, governments must adhere to good practice with regard to comprehensiveness and transparency in the reporting of fiscal accounts so that violations of the rule can be observed, providing a measure of self-restraint.11 17. International experience suggests that institutional strengthening efforts should focus on four key areas: (i) ensuring credible control over the level of the fiscal deficit, including measures to limit pro-cyclical discretionary policy; (ii) encouraging transparency and contestability in policy to establish and enforce decisions on strategic priorities for public spending; (iii) establishing a well-functioning system for public investment selection and implementation; and (iv) enhancing efficiency of public spending through resource management procedures that enforce accountability for results at all levels of government. These are difficult reforms that require sustained effort over a period of years but where pragmatic initiatives can yield high dividends. III. Evidence on Public Spending and Growth 18. Economic theory supports the idea that public spending and taxation are important channels of transmission between fiscal policy and growth. In the 1990s developments in the theory of growth recognized that there might be a larger role for public expenditure in determining an economy’s growth rate.12 Theory recognized that (a) some public expenditures affect the productivity of the private sector, other ‘unproductive’ expenditures only raise citizens’ welfare or are a waste and do neither; (b) public provision of capital affects private production; and (c) it was already well known that some taxes distort investment decisions. This suggested that changes in expenditure composition, tax design and deficit financing might alter the economy’s growth path. 19. Recent empirical studies have identified which public expenditures tend to be “productive” in the sense of being growth-enhancing. In general, empirical studies are limited by the availability and quality of data for developing countries, including sub-national data. Nevertheless, a review of a large number of cross-country studies, which are discussed in Annex 2, find that capital expenditure, as well as spending on education, health, transport and communication can be favorable to growth. The extent to which these expenditures contribute to growth in any country depend on country-specific factors, including the efficiency of resource use and the quality of governance. The effects may be large when their cumulative effect over time is taken into account. Although the evidence on causality is not conclusive, they do seem to run from 11 With regard to the problem of pro-cyclicality, a number of countries refer to the cyclically adjusted balance (CAB) in setting their fiscal targets. Chile uses a sophisticated variation of the CAB that incorporates the effect of copper prices to ensure a countercyclical capability. 12 See Barro (1990), Barro and Sala-i-Martin (1992), Futagami et al. (1993), and Devarajan et al. (1996). Futagami et al. (1993) use the same model as Barro (1990), but assume that public services are derived from the stock of public capital instead of the flow of public expenditure. For a survey of recent endogenous growth models in which fiscal policy continues to have long-run effects See Gemmell (2007) 6
- 19. expenditure to growth and not the other way about.13 Put differently, sustained effort to build both physical and human capital is necessary for higher growth.14 20. Another source of evidence is the experience of high growth countries. A background study15 of six high growth countries provides the following findings: (a) except for brief periods, high levels of deficit financing does not appear to have been a major feature of fiscal policy; (b) there is some evidence of convergence in the level of expenditure, with countries with high initial expenditure tending to reduce it and those with low expenditure tending to increase; (c) while capital expenditure shares differ across the countries, they tend to be relatively stable suggesting that fiscal policy protected growth related expenditure categories; and (d) most of the countries reduced the share of public administration in total expenditure. IV. A Growth-Oriented Approach to Fiscal Policy 21. The conventional approach to fiscal policy design has limitations. It starts with an assessment of revenue prospects, factors in any grant aid flows that may be anticipated and adds in an assessment of the deficit that could be financed through prudent borrowing and non-inflationary monetary financing of the deficit. Revenue forecasts in particular are subject to a judgment on the rate of growth of the tax base which in turn depends on the rate of growth of the economy and on improvements in tax administration. Aid flows may be subject to conditionality or to unpredictable parliamentary processes in donor countries. In any case, the level of expenditure is determined as a residual in this process. 22. There are a number of reasons why this might be an inadequate way to ensure a growth supportive fiscal policy. First, quite often medium term prospects for aid or revenue may be defined too conservatively or too optimistically and both can have adverse consequences for fiscal policy design.16 Second, and more importantly, there is inadequate focus on the link between the judgments on fiscal policy and the underlying constraints to higher growth in the economy. Third, issues about the quality of fiscal policy and essential questions about the role of public expenditure levels, composition and efficiency which are critical for long term growth are not adequately factored into fiscal policy design. 23. Figure 1 suggests a more explicit growth-oriented approach to fiscal policy design. A schematic description of this approach is provided which indicates the central role of political choices and institutional capacity in influencing key aspects of fiscal policy. Starting with the policy goal for growth, and following the counter-clockwise arrows, this approach would first look to identify the constraints to higher growth, and 13 See annex 2 and Gemmell (2007) for details. 14 The role of public spending is important but, as noted in annex 3, private expenditure can often comprise a significant share of investment in human capital. 15 The countries are Botswana, Chile, Ireland, Korea, Malaysia and Thailand. .See annex 3 and Biletska and Rajaram (2007). 16 See Heller et. al. (2006) for a discussion of the constraint due to conventional IMF approach to programming grant aid in the medium term fiscal framework. 7
- 20. ask whether fiscal considerations (public expenditure and taxation) could be used to address the constraints to those goals. In some cases the appropriate intervention may be regulatory reform that enables private initiative to address the constraint. 24. Identifying the constraints to higher growth is the first step. Policy makers and their advisors have to pragmatically determine whether private investment and growth is being constrained by public sector outputs (e.g., transport bottlenecks, erratic power supply, or a high tax burden) that may be addressed by fiscal policy. The constraints and the remedies are likely to be highly country and context-specific. Empirical evidence, investment climate surveys and the exercise of good judgment will be useful in making a pragmatic determination on the constraints. As with all policy making, an evidence based “error-correction mechanism” would be an asset to improving policy decisions over time. A Growth-Oriented Approach to Fiscal Policy Figure 1: Growth-Oriented Fiscal Policy Schematic 25. A diagnostic approach would help guide fiscal decisions. As indicated by the counter-clockwise green arrows in the schematic, if it is determined that public expenditure is the appropriate policy instrument to address the public sector output constraint, then it would be necessary to go further to ask whether improved efficiency in existing public spending or shifts in the composition of expenditure would enable the constraints to be addressed. Fiscal measures of this kind would not impose any additional cost to the economy in the form of taxation or debt and would be the preferred way to address the constraint. 8 1 Policy Goals: Growth, Macro Stability, MDGs 4 Resource Mobilization (Revenue, Aid, Borrowing) 2 Public Sector Outputs (goods, services, investment) 3 Level, Composition & Efficiency of Expenditure Political Choices/ Institutional Capacity Private- Public Nexus
- 21. 26. It may be necessary to raise the level of expenditure to address the constraint under some circumstances. If efficiency or compositional shifts are insufficient or only achievable over time, a government may conclude that an increase in the level of expenditure is necessary to address the constraint to ensure macro-sustainability. Where a level shift is required, the implications for financing should be considered. As shown by the schematic, the financing options include revenue, aid and borrowing of which the least cost option should be preferred. Box 1: Iteration between Goals and Resource Constraints What is critical to achieving a sensible balance between the government’s goal regarding the rate of growth of GDP and its constraints is a process of iteration. If the goals appear over-ambitious given assumptions about available resources, then either more resources must be found, or the goals must be trimmed. The converse is also true. One possibility, subject to respecting the inter-temporal budget constraint, may be to borrow resources from the future. Another may be to raise more resources from taxation or aid. If the pay-off to these resources is very high at the margin, it makes sense to look for ways of enhancing them; on the other hand, if the pay-off is very low, it makes no sense to mobilize them at the originally projected volume. Hence goals become endogenous to the iterative process. It is equally true that it does not make sense to stipulate what the available resources are without considering how they may be deployed. 27. The costs of financing added expenditure must be compared to the benefits from the goals. It is conceivable that the costs of raising resources in some situations may exceed the benefits (for example, macroeconomic implications in terms of inflation, interest rates, exchange rates), in which case addressing the constraint by increasing expenditure is not a desirable policy option. In such a situation, the government may have to consider adjusting its policy goals which may have to be scaled down appropriately. This process of iteration is indicated in part by the clockwise arrows. 28. Economic modeling can help define potential growth scenarios that relate to alternative fiscal strategies. An empirical assessment of the growth impact of improvements in expenditure efficiency, shifts in the composition, or higher levels of spending would benefit from appropriate methods, including but not limited to economic modeling. While this is a challenging area that requires further work and where data availability is a major constraint, it is clear that greater knowledge on this key linkage would enable fiscal policy design to adopt a more appropriate stance in situations where expenditure would need to be scaled up (see Box 2). 29. The goal is to find a reliable way of ensuring that fiscal policy is well-designed both to maintain stability and to promote growth. In the past fiscal policy has often started from a relatively conservative view of available resources and allowed this view to constrain goals and aspirations, sometimes excessively. More recently, some countries have used MTEFs to improve fiscal policy formation by defining realistic medium term resource prospects, while strengthening the link between policy objectives and budget allocations. Countries with better budgetary processes also show promise of improving fiscal policy design by linking PRS-derived budget allocations to growth and the MDGs. 9
- 22. Box 2: Modeling Public Expenditure and Growth The approach suggested in this paper emphasizes the need to identify fiscal constraints to growth in order to identify the appropriate areas to enhance public expenditure. But it will need to be supplemented with analysis of the likely growth impact of such expenditure and the knock-on effects on the economy. This is best done through formal economic modeling. Computable general equilibrium models which use a consistent economy-wide set of accounts and incorporate economic behavior provide one way to undertake such modeling. The Bank often uses the 1-2- 3 model which is an aggregate CGE model that allows for economic behavior. More recently, the Bank has developed MAMS (Maquette for MDG Simulations), a model that is intended to help policy makers consider the implications of alternative financing and expenditure strategies on macroeconomic variables, including growth. MAMS integrates a detailed portrayal of public expenditure on health, education and infrastructure and the resulting human development outcomes within a consistent economy-wide framework that considers key policy handles and feedback linkages. It provides a conceptual framework for evaluating efforts to improve human and social indicators in low- and middle-income countries. MAMS also has an explicit focus on the inter-temporal nature of the growth and MDG challenge and allows policy makers to confront difficult choices of sequencing and allocating public spending within an explicit time horizon. MAMS has a flexible framework that allows for different degrees of dis-aggregation depending on data availability and policy context. It has been applied to Ethiopia and Uganda. Applications are under way in some 25 countries in Latin America and sub-Saharan Africa, including Kenya and Madagascar, which are part of the fiscal policy study. Such modeling will need to be supplemented with a parallel effort to improve data and deepen sector level analysis to help identify reasonable parameters. Also, other complementary approaches to assessing fiscal-growth linkages should be encouraged, including efforts to assess the impact of public expenditure on private investment Source: Bourguignon, Francois, Carolina Diaz-Bonilla, and Hans Lofgren. 2006. “Aid, service delivery and the MDGs in an economy-wide framework.” Draft. December 20. V. Country Case Studies17 30. Twelve countries with different fiscal/development profiles were selected for the case studies to help inform how fiscal policy could catalyze higher growth. The twelve countries’ per capita incomes range from $230 (Rwanda) to $4710 (Turkey) and include six low income countries, five lower-middle income countries and one upper-middle income country. Six of the countries have some degree of access to grant aid, in terms of their primary source of external financing, and the remaining six generally do not, relying instead on market-based borrowing to supplement domestic revenue. Accordingly, we classify the countries as Aid Access countries (AAC) or Market Access countries (MAC).18 17 This section draws on ongoing case studies. As such it highlights findings that are relatively unambiguous and useful for considering the implications for a long term growth-oriented fiscal strategy. The final country case studies will include more detailed discussion of sectoral issues as well as trade-offs in determining the composition of expenditure. 18 The distinction is clearly not airtight but we find this classification useful in distinguishing the fiscal characteristics of the countries for the purpose of this study. Kenya is classified as low aid access in the aggregate but specific sectors may be quite aid dependent. It should also be noted that countries may move 10
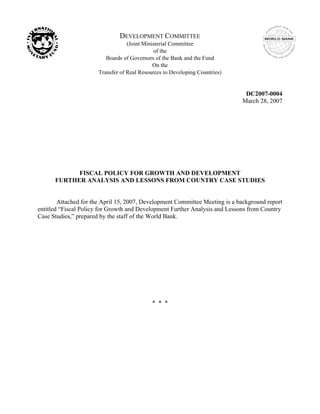
- 23. 11 Hi-AAC • UGA • RWA • MDG Low-AAC • CMR • KEN • TJK Hi-MAC • BRA • TUR • UKR Low-MAC • IND • PHL • MOR Revenue and Expenditure (% GDP) BRA TUR UKR MOR IND PHL KEN TJK CMR RWA UGA MDG 50 45 40 35 30 25 20 15 10 5 0 0 5 10 15 20 25 30 35 40 45 50 Revenue Expenditure Figure 2: Expenditure, Revenue and Deficit Levels 31. Countries vary in their fiscal characteristics but some natural “clusters” can be observed across the 12 countries (see fig.2). Brazil, Turkey and Ukraine cluster towards the high end of the scale with high revenue shares of GDP and are classified as Hi-MAC for the purpose of the study. At the other end, Rwanda, Uganda, and Madagascar raise only 10-14 percent of revenue but spend 20-28 percent of GDP. Their large fiscal deficits are financed by high aid inflows of 10-14 percent of GDP and these countries are classified as Hi-AAC. The other six countries have revenue and expenditure shares in the 15-30 percent range. We classify Cameroon, Kenya and Tajikistan as low-AAC with grant aid below 1.5 percent of GDP, while India, Morocco and Philippines are classified as low-MAC, reflecting the lower levels of revenue and expenditure relative to the Hi-MACs. 32. Borrowing capacity differs across the countries. Among the 12 countries, the stock of debt as a share of GDP is relatively high (greater than 70 percent) in five of the six MAC countries (Ukraine being the exception), while five of the AACs display relatively low ratios because of debt relief, including the MDRI (see Annex table 1). In the Hi-MAC group, both Turkey and Brazil have relatively high debt levels and a past history that suggests that markets may be “debt intolerant.” This forces such governments to run large primary surpluses, constraining fiscal policy. Ukraine has a relatively low debt to GDP ratio and therefore more room to maneuver, but has to take account of significant contingent liabilities. India, Philippines and Morocco all have relatively high debt levels which limits further borrowing, but do not appear to face the from one category to another as a result of policy decisions. For example, Ireland moved from being a Hi- MAC to Lo-MAC by undertaking a significant rationalization that reduced expenditure from above 50 percent of GDP to about 30 percent in the late 1980s, while improving growth outcomes.
- 24. problem of debt intolerance. Cameroon, Uganda, Rwanda and Madagascar have benefited from debt relief in the form of HIPC and MDRI which potentially gives them room to borrow subject to their debt sustainability assessments. Tajikistan has received MDRI on IMF debt which has also lowered its debt ratio to below 50 percent. Kenya has a debt ratio of about 54 percent. For countries that have received debt relief, there is in principle more room to borrow, but this “fiscal space” has to be used sparingly, consistent with debt sustainability analysis, to finance productive expenditure. 33. The “fiscal diamond” presents a broad public finance perspective and enables a heuristic description of the financing options for each of the four subgroups. The diamond illustrates the scope for a government to: (a) generate fiscal savings from improved allocative and technical efficiency of existing spending, and (b) to raise additional fiscal resources through new revenue measures, additional aid or new borrowing. To the extent that a country already raises a significant amount in revenue, has a high initial stock of debt, or receives high aid inflows, the scope to raise additional revenue from any of those avenues would be small. Conversely, the lower the allocative and technical efficiency of the existing budget, and the larger the volume of such spending, the greater would be the scope for efficiency gain as a source of fiscal space.19 The scope for additional aid or borrowing could in principle be estimated with reference to donor commitments or debt sustainability analysis. Although technically challenging, the costs of raising more revenue from different tax instruments can also be assessed. The scope for expenditure efficiency improvements requires a more painstaking assessment. A detailed program-by-program evaluation could yield a specific estimate of the amount of resources that would be available from improvements that both improve the composition (i.e. improve allocative efficiency) and improve cost efficiency.20 By comparison, the case studies attempt a more selective and indicative assessment of expenditure efficiency.21 34. Figure 3 illustrates the most likely ways to finance a growth-oriented fiscal policy in each group of countries.22 Although the Hi-AAC currently receive relatively high shares of GDP in grant aid, given their large development needs, there are indications of a further scale up of aid. Aid could be supplemented with more revenue effort as well as improved efficiency of expenditure, while deficit financing will need to be limited, given recent debt relief (see fig. 3(a)). The low-AACs (fig. 3(b)) reflect lower prospects on the revenue dimension relative to Hi-AACs, but there is scope for fiscal savings from efficiency gains due to allocative and technical improvements. While aid 19 The fiscal diamond represents the supply side of fiscal policy. By placing all four sources of fiscal resources in one graphic it allows a more useful discussion of the possibilities for fiscal policy, avoiding the narrow focus on justification for higher deficits. It should be clear that the figures are simplified representations of countries that differ in many important respects, even within a particular classification. 20 In fact, governments often make an effort to identify such savings. In 2005, the Canadian government undertook an Expenditure Review which identified $11 billion in new savings over 5 years from improved efficiency. The Gershon report in the U.K. similarly identified GBP 20 billion in efficiency improvements in 2004. 21 For a discussion of the limitations imposed by data on estimating efficiency using parametric and non-parametric 12 methods, see Estache et. al. (2006). 22 Heuristic judgments of this kind must be corroborated with more detailed country specific analysis.
- 25. flows are currently low, institutional and governance reforms could increase aid access over the medium term. Given the high initial levels of revenue as well as debt in Hi- MACs such as Brazil and Turkey, any enhanced growth-orientation to fiscal policy is unlikely to be based on raising further revenue or borrowing. It is instead likely to rest on improvements in the composition and efficiency of expenditure (see fig. 3(c)). By contrast, for some of the Low-MAC (fig. 3(d)), the fiscal options include both revenue enhancement and improvements in expenditure efficiency. 3 (a) Hi-AAC 3 (b) Low-AAC 13 Uganda, Rwanda & Madagascar Aid Borrow ing Revenue Expenditure Efficiency Cameroon, Kenya & Tajikistan Aid Expenditure Efficiency Revenue Borrow ing 3 (c) Hi-MAC 3 (d) Low-MAC Brazil, Turkey & Ukraine Aid Borrow ing Revenue Expenditure Efficiency India, Philippines & Morocco Aid Expenditure Efficiency Revenue Borrow ing Figure 3: Navigating in Fiscal Space 35. The simplified fiscal diamond graphics are useful, but do not alleviate the need for more detailed analysis. Countries differ also in terms of their demand side, represented by their policy objectives, constraints, demographic characteristics, and
- 26. demand for public services.23 In some countries, such as Brazil and India, issues of fiscal federalism are central to any discussion of fiscal policy, with sub-national entities having specific functions. And countries may also differ in terms of their macroeconomic status – some countries may still be undertaking stabilization while others may have achieved it and seek to sustain macro-stability. Thus, while the fiscal diamond provides a simple visual way to distinguish the fiscal options for various country cases, specific design will need to take account of the nature of the constraints to growth and welfare in the individual country case discussions below. Box 3: Country Case Studies The country case studies were undertaken by Bank country teams in order to draw on the knowledge and relationships of the Bank’s country staff and to dovetail the studies, as far as possible, onto planned economic analysis. Thus, while a number of case studies have been substantially completed as a draft, others are still in process. The case studies draw upon recent reports, including growth diagnostic analysis that was undertaken in a number of countries as part of a separate exercise, to make informed judgments about required shifts in the composition of expenditure. A few of the cases (Brazil, Turkey, Ukraine) draw on recently completed work but do attempt to conform to the growth-oriented approach. The case studies of Cameroon and the Philippines were not sufficiently developed to be included in this report. Overall guidance was provided to the country teams and supplementary resources from the Bank Netherlands Partnership Program (BNPP) trust fund were made available to assess expenditure efficiency in key sectors, specifically education, health and infrastructure. In Uganda, a district level survey of costs and efficiency of education expenditure is being analyzed. In Kenya, efficiency assessments in health and education expenditure have been undertaken and similar studies are to be undertaken in Cameroon. A baseline assessment of sources, uses and efficiency of infrastructure expenditure is being prepared for Rwanda, Kenya, Uganda, Cameroon and Madagascar and an evaluation of infrastructure investment needs and financing was prepared for the Philippines. Ongoing MAMS modeling was used in Uganda, Madagascar and Kenya to assess the growth and MDG implications of alternative expenditure compositions and to inform fiscal policy design. The value added of the case studies is reflected in: (a) the scope of the questions being posed to link public finance and growth, (b) the peripheral vision provided by the more comprehensive public finance perspective, (c) the pilot approach to efficiency assessments which are adapted to data availability and country-specific needs, and (d) the simultaneous focus on three key sectors which also raise issues of inter-dependency that are important for growth and the MDGs. 23Earmarking of aid to particular functions may indicate some link between supply and demand for resources. 14
- 27. HI-AAC SECTIONAL SUMMARY 36. Uganda, Rwanda, and Madagascar have all achieved and sustained macroeconomic stability but growth in per capita GDP is inadequate to achieve the MDGs. 24 Average inflation has been held around or below 10 percent in all three countries and there are no pressing macro-stability concerns. While GDP growth in all three countries has averaged about 5 percent per annum in recent years, it is estimated that a rate of 7 percent p.a. is needed to reach MDG-1, halving the number of poor. Uganda Highlights 37. Poorly maintained road network and power supply shortages are key constraints to Uganda’s growth. Given Uganda’s landlocked situation, high transport costs are a hurdle for growth. Infrastructure (roads and power) development in Uganda is believed to be critical to stimulating a higher rate of sustained export-led growth.25 Another constraint that will need to be addressed over time is a shortage of technical skills of the domestic labor force. Institutional arrangements are also a constraint to effective infrastructure investment. 38. The composition and efficiency of expenditure could be improved. Uganda has received on average 10 percent of GDP in aid over the past decade, and aid-earmarking and moral hazard issues may have influenced the quality of spending. It is appropriate to review the efficiency and composition of spending before considering the need for an increase in the level of expenditure. While further analysis is needed, a number of inefficiencies can be identified. Administration expenses and defense consume almost 48 percent of the budget and divert resources away from productive expenditure. Insufficient maintenance expenditures result in a poor maintenance for the trunk and urban roads; losses in electricity and unaccounted water are in the range of 35-45 percent. 39. A survey of education costs and outputs undertaken as part of the study has stimulated policy discussion on value for money. Preliminary results suggest that leakages in government recurrent expenditure on primary education, which include “ghost workers”, excessive administrative overheads, teacher absenteeism and other waste, are substantial. Inefficiencies in teacher deployment are suggested by data on pupil teacher ratios in different grades. Overall, the case study has highlighted the inefficiencies in expenditure within high priority sectors. 40. The case study also highlighted the importance of revenue policy for growth. Work on revenue buoyancy and tax expenditures revealed issues that were previously 24 The three Hi-AAC countries have comparable per capita income – US$230, 280 and 290, respectively, for Rwanda, Uganda and Madagascar. 25 Over 2001-1005, Uganda managed to attract more private sector financing to telecom and energy sectors than other SSA countries. However, private sector participation in infrastructure is still a relatively low 14 percent of total infrastructure spending. 15
- 28. overlooked. In Uganda, new VAT and customs tax incentives for hotel construction coupled with generous income tax allowances for investment contrast with high customs duty and VAT on transport equipment, to bias new investment in favor of property rather than transport equipment. Consequently Kampala is enjoying a property boom. Yet income growth for most people in Uganda’s highly rural economy would benefit more from lower transport costs, which could be achieved by lowering taxes on trucks and fuel, and building better roads. 41. Model based simulations can help inform governments of the nature of trade-offs in making fiscal policy decisions. In order to consider the potential growth and MDG impact of alternative fiscal strategies, including the composition of expenditure and financing, simulations with the MAMS were undertaken. The simulations take account of the interdependence between infrastructure and human development and the trade-offs in terms of growth and the MDGs due to changes in the composition of a given level of spending or in varying the level of aid or direct taxation. The baseline scenario assumes a gradual increase in revenue collection from 11 to 18 percent by 2020 and most other variables growing at the same rate as GDP. Cutting unproductive government services and reallocating savings from improved efficiency to high priority areas such as infrastructure, education, health and water, has the most positive impact on raising the growth rate (by an estimated 0.4-0.5 percent p.a.) and improves a broad range of MDG indicators. Similar results occur if aid levels are scaled up and allocated to growth and MDG oriented functions. If expenditure is reallocated within the productive categories, from infrastructure to education and health, the growth rate decreases (by 0.2 percent p.a.), while the individual MDG outcomes are differentially affected. Increasing expenditure by raising tax revenues, however, results in a decline (by 0.3-0.4 percent p.a.) in rates of private investment growth and little change in GDP growth relative to the baseline scenario, indicating the effects of taxation crowding out private consumption and investment. 42. The analysis provides some important though tentative conclusions for a growth oriented fiscal policy for Uganda. It suggests that attention be given to improving overall efficiency as well as shifting the composition of expenditure away from general administration to infrastructure and human development. As noted, intra-sector efficiencies are also important and require attention for growth related outcomes. With regard to any increase in the level of expenditure, it also emphasizes the value of continuing to make effective use of aid inflows, while persisting with gradual efforts to raise revenue collections from a broad based tax system. The government has indicated its desire to reduce reliance on aid even as its development needs remain large. An announced intention to raise revenue mobilization from 12 to 16 percent of GDP may be consistent with the intention to reduce aid dependence and in principle is the correct direction for fiscal policy. However, the appropriate phasing and design will require careful consideration. Revenue enhancement must not reduce the incentives for private sector investment. 16
- 29. Rwanda Highlights 43. Rwanda’s Vision 2020 of trebling per capita income requires sustained growth rates of 6-7 percent per annum over the long term. To achieve this Rwanda needs to transform its agriculture and diversify its economy with manufacturing and services. Major constraints to growth include poor infrastructure (transport, energy and water), lack of skilled labor, and low productivity. As a landlocked country, Rwanda’s transport costs depend on the quality of its own roads as well as those of its neighbors. It has an unusually dense road network which is poorly maintained both because of limited funding and maintenance costs that are twice as high as in other countries because of the terrain and climatic conditions. Energy supply and costs are also problematic since electricity coverage nationally is only 6 percent, and power outages are common. 44. Rwanda requires substantial levels of public spending to address these constraints and to leverage private investment. Significant investments are necessary in hydro-power generation (including for regional exports) as well as in methane gas-fuelled generation. Rwanda also faces large commitments to its health and education goals. With 49 percent of its population below the age of 15, the importance of educational services is self-evident. High child and maternal mortality rates necessitate high priority in public policy and budget allocation which are also needed to reduce the current HIV/AIDS prevalence rate of 3 percent of the population. 45. There is some scope for improving expenditure composition and efficiency to improve program outcomes and growth impact. By prioritizing public interventions and addressing expenditure composition and efficiency issues, Rwanda can improve the growth and MDG impact of public spending. Currently, spending on infrastructure and agriculture are very low. Education expenditure receives the largest share of the budget, but nearly a third of the recurrent budget is spent on higher education. Further improvements in outcomes could be achieved through a reduction in subsidies to higher education, accompanied by increased allocations toward teaching materials, teacher training and school construction, particularly at the primary level. In health, only a small fraction of donor aid enters the government budget; the rest is managed directly by donors and channeled through NGOs, mainly to single issue vertical programs. Meanwhile, key government-run health programs such as malaria control, maternal mortality, and management of childhood diseases are badly under-funded. Encouragingly, several initiatives have been started to strengthen public resource management, improve expenditure programming, budgeting, procurement, and expenditure management and monitoring processes. Rwanda has also initiated efforts to improve efficiency through tracking surveys and community based interventions. These efforts, however, will take time and potential savings from them are not large relative to needs. 46. Achieving the growth goals in Rwanda will therefore require significant scaling up of aid. Rwanda has raised revenue collection substantially over the past few years, but given the narrow tax base, there are limits on further revenue enhancements. Although debt levels have been reduced by HIPC and MDRI, new borrowing should also 17
- 30. be limited and undertaken only on highly concessional terms. So the main prospect for financing increases in spending to address growth needs is higher aid flows. For such aid to be effective, however, it will need to be aligned more closely with government programs that support Rwanda’s needs. Moreover, given structural constraints to broadening the tax base, such aid flows may have to be sustained for a much longer period than currently envisaged. Madagascar Highlights 47. The country’s development strategy, the Madagascar Action Plan (MAP) 2007-12, calls for high growth rates accelerating from current levels to between 7 and 10 percent. These ambitious growth rates are predicated on higher investment levels financed by higher levels of external assistance and domestic revenue mobilization. Annual growth rates in Madagascar have averaged 5 percent after the post-crisis rebound of 2003. Growth in Madagascar is constrained by the quality of public infrastructure as well as an under-developed financial sector and low skill levels. When it became independent, Madagascar had 50,000 kilometers of roads, but this has deteriorated to 31,612 kilometers of national road network, of which only 4,074 kilometers are paved and 5,855 kilometers are in good or fair condition. The main port, which handles almost three-quarters of the traffic, is among the most inefficient in the Indian Ocean, handling about 6.3 containers per hour. Limited energy coverage (15% of households) and high tariffs present another constraint to future growth. 48. There is scope for improving revenue generation in Madagascar from its current low levels. The share of tax revenues in GDP is estimated at 10. percent in 2006. Consistent revenue shortfalls over the last two years led to mid-year expenditure cuts which hampered execution of the government’s program. Volatility in aid flows further exacerbated budget execution with the government borrowing on the domestic market crowding out the private sector. While there are limits to increasing revenue mobilization in a primarily agricultural economy, it is estimated that the tax mobilization is below its potential by at least 3 percent of GDP. One of the main priorities of the MAP in 2007 is to undertake major tax reform, rationalizing tax policy and procedures, modernizing tax and customs administration, and improving human resource capabilities with the overall objectives of revenue generation, improved service quality and establishing a favorable climate for investment. 49. There are positive trends and some further potential for improving the composition and efficiency of expenditure to improve the growth and poverty reduction impact. Overall, the budget is aligned to the priorities of the government with roads and primary education jointly receiving 34 percent of the non-interest budget26 and with both the health and education sectors prioritizing primary level services. The share of administration in overall expenditures has also continued to decline. However, the balance between investment and recurrent spending could be further improved to enhance operations and maintenance spending. Second, more resources could be provided to 26 This is the average for 2004-2006 allocated to education and transport using a functional classification of the budget. 18
- 31. communes which only control 3-4 percent of resources. Third, allocation to poorer districts could be improved since they receive fewer resources and have fewer qualified personnel than would be justified by their poverty rates. 50. Achieving the MDG/MAP goals will also require higher aid. Preliminary results applying the MAMS model and taking account of cross-sectoral synergies suggests that while Madagascar may not attain the health or water and sanitation goals, it comes close to achieving universal primary education if the spending on education is sustained. Child and maternal mortality, in particular, may remain high, in part due to slow progress in improving sanitation. Scenario analysis indicates that the full attainment of each of the MDGs will require almost doubling of financing requirements over the baseline for both current and capital spending. The financing growth requirements are higher for the health MDG (almost triple for current and quadruple for capital expenditure) but near baseline rates for education and infrastructure MDGs. The importance of synergies show up in the MDG scenario that targets all the MDGs simultaneously: the growth rates necessary for achieving multiple MDGs are lower than what the single-sector costing analysis dictates. But even in the full MDG scenario, per capita consumption does not grow by enough to achieve MDG-1, i.e. to reduce the 1990 poverty level in half by 2015. While further analysis is underway, overall, the results suggest that significantly higher aid inflows and revenue effort are needed for Madagascar to attain the MDGs. LOW AAC SECTIONAL SUMMARY 51. Kenya and Tajikistan share some fiscal characteristics but differ in many respects, including their political and economic histories.27 Revenue effort is relatively strong in both countries. Access to aid has often been limited because of concerns regarding governance. Donors have provided relatively low and volatile aid flows or have channeled aid outside the budget due to problems of public expenditure management. Kenya Highlights 52. Kenyan authorities are attempting to reverse the effects of many years of economic decline. Kenya experienced low GDP growth in the 1990s that saw per capita income decline to 1970 levels. The period was also marked by deterioration of public infrastructure and adverse trends in key indicators such as school enrollment rates, infant and maternal mortality, life expectancy, and incidence of infectious diseases and HIV/AIDS. Since the political transition to a new government in 2003, growth performance has improved and real interest rates have declined, reflecting perceptions of reduced political risk and uncertainty. 27 Per capita income in the Low-AAC countries ranges from $330 (Tajikistan), $530 (Kenya) to $1010 (Cameroon). 19
- 32. 53. Accelerating growth in income and employment is central to the government’s Vision 2030 strategy which targets 10 percent annual GDP growth over 2007-2030. Growth diagnostic analysis suggests that constraints to growth in Kenya are linked to quality and cost of infrastructure, with business costs affected by high cost of internal transport and unreliable electricity and communications.28 While the road network is adequate, only 12 percent is paved and the main highways are in poor condition. 54. Infrastructure spending in Kenya is moderate but its efficiency is low. A baseline estimate indicates that total infrastructure spending in Kenya is about 5 percent of GDP, the bulk of which is public (including state enterprise) investment. 29 Infrastructure spending has been compressed by fiscal adjustment and the decline of external budget support. However, there are substantial inefficiencies within the sector which, if reduced, would provide part of the necessary fiscal space to improve the stock of infrastructure. Transmission, distribution, and collection losses are significant and administrative expenses are high in the state electricity enterprise and drain resources that could be available for reinvestment. The current level of resources available from the Kenya Roads Board is adequate for routine maintenance but would not address the rehabilitation and backlog of maintenance. Road maintenance could be improved if more “economic” criteria were used for allocation of existing maintenance funds for different parts of the road network, shifting funding to the main highways and to segments that impact leading economic sectors such as tourism and horticulture. And the quality of budget execution and project management could be significantly improved to ensure that investment spending is efficiently translated into productive infrastructure assets.30 55. Expenditure on education is high, but could be more efficiently deployed. Public spending on education in Kenya is 6.6 percent of GDP, more than half of which is allocated to the free primary education program initiated in 2003. This level of education spending is high relative to most countries and, given competing demands, improvement in educational outcomes will have to rely on achieving efficiency within the public sector and encouraging private provision and financing wherever possible. Unit costs in public primary, secondary, technical and university education are estimated to be about $90, $300, $360 and $2000 respectively. Measures to improve completion rates and reduce repetition rates will remain important at both primary and secondary levels, while improvement in staffing norms will help contain costs at the secondary level. University education has both the highest cost and gets the highest public subsidy with 92 percent of the $2000 cost being covered by the budget. In contrast, technical education costs a sixth of university education with 75 percent of the total cost borne by the participants. Given 28 Growth is also constrained by institutional/governance issues related to corruption, crime and protection of property rights. 29 At present the private sector provides only 1.4 percent of GDP in infrastructure spending. Greater private participation would reduce the burden on the budget – a recent successful sale of shares in a power generation investment (KenGen) indicates the potential in key subsectors. The 2006 joint concession for the Kenya-Uganda railway is likely to improve options for transport between Mombasa and Kampala. In prospect are PPPs for a number of energy projects, the Nairobi UrbanToll Road and Mombasa Port. 30 Kenya – A Pilot study on Infrastructure Public Expenditure Efficiency – draft, World Bank, 2007. 20
- 33. limited fiscal space, reducing the university subsidy and shifting expenditure to technical education would improve the growth orientation of the education budget. 56. Overall spending on health is reasonable at 5 percent of GDP; but it is inefficiently deployed. Although aid flows into the health sector have risen rapidly in recent years, much of it is channeled directly to donor-managed programs outside the budget, with the result that critical government programs remain significantly under-funded. Moreover, within government programs, resources are poorly allocated.31 A large part of the budget is spent on wages and salaries; actual spending on drugs and medicines, equipment and maintenance has been far below allocations; with a wastage/leakage rate estimated at 30%. While it is desirable in principle to channel the increasing aid inflows through the budget, progress is likely to depend on improving the utilization and effectiveness of resources in the health sector. 57. Whether a level increase is necessary will require further analysis. There is a clear need to improve the composition and efficiency of expenditure in major sectors to increase the growth impact as well as release resources for reallocation. Given manageable debt levels, a modest increase in productive expenditure could be financed by some borrowing and raising revenue through tax base broadening. Kenya could also benefit from additional aid flows, but that will require sustained measures to address well publicized concerns about governance and accountability. Tajikistan Highlights 58. High economic growth is needed to address elevated poverty levels. Tajikistan has only partially recovered from a severe economic collapse after the break-up of the Soviet Union in 1991 and a civil war which fuelled hyperinflation and reduced 1996 GDP to a third of its 1990 level. The provision of basic social services, such as education and health care, has deteriorated dramatically. The incidence of poverty is estimated at 64 percent and a third of children suffer from chronic malnutrition. To eradicate mass poverty it will be necessary to maintain high rates of economic growth, with the benefits well distributed, and to rebuild basic public services. 59. Sustaining the growth recovery will require more private investment. A fiscal adjustment in the mid-1990s based on drastic cuts in expenditure reduced subsidies and wages, while subsequent tax administration reforms resulted in revenue growth that allowed a recovery in expenditure levels by 2000. Stabilization spurred economic growth, which has averaged 9 percent over the past few years. However, these rates are unlikely to be sustained over the long term without a strong rise in private investment and an improvement in labour productivity. 60. Non–fiscal factors (the quality of regulation and governance) may be the binding constraint to private investment. Private investment is constrained by a non-transparent, unpredictable and excessively regulated business climate. Surveys indicate 31 For example, 66% of the sector budget in 2003 was allocated to curative care and urban hospitals, and only 16% for rural health services and preventive care- both of which are high priorities. 21
- 34. that corruption is pervasive, with private firms having to bribe tax and customs inspectors, local authorities, and to get access to utilities. Under these conditions, it is unlikely that there will be a growth in private investment. Thus, the key constraint to growth in Tajikistan in the near to medium term is not fiscal but regulatory in nature. 61. Nevertheless, fiscal policies are needed to address complementary growth-supporting factors. A key role for government is to improve the quality and access to education and health services and the maintenance of existing public infrastructure. Spending on education receives about 22 percent of the budget. Maintenance of the road network is severely under-funded, as is health expenditure. Addressing the quasi-fiscal deficit due to electricity pricing policies would also strengthen the ability of the power sector to sustain its capacity. The need to address these issues creates a prima facie case for increasing the level of spending. However, the government also faces the challenge of improving the efficiency and effectiveness of its expenditure as well as the need to allocate more resources to priorities. 62. Having observed a period of borrowing restraint and having received debt relief, Tajikistan will need to continue to be prudent with new borrowing. Over 2004-06, Tajikistan received significant debt relief from bilateral donors and the IMF. In 2006, Tajikistan contracted large new loans totalling $604 million to finance infrastructure projects. New borrowing to finance infrastructure may be justifiable but should be subjected to a proper cost benefit analysis and debt sustainability evaluation. 63. Addressing the quality of regulation would facilitate private investment, raise the productivity of expenditure and improve access to aid flows. While it should be possible for the government to mobilize sufficient resources to increase primary expenditures by 5-6 percent of GDP per year over the next decade, the experience of the transition economies of Europe and Central Asia underlines the importance of the quality of governance to growth. Higher total government expenditure tends to depress economic growth in countries with poor governance, and even expenditures on what should be productive sectors such as education appear to have little impact on growth. If the country is to benefit from an expansion in the size of the budget to accommodate the priority expenditures of education, health and infrastructure maintenance, this must be accompanied by major improvements in expenditure efficiency and the quality of regulation. HI-MAC - SECTIONAL SUMMARY 64. High expenditure levels characterize the Hi-MACs. Brazil, Turkey and Ukraine all reflect the pressures in middle income countries to increase welfare related expenditure on pensions, social assistance and related entitlements.32 These pressures do two things – they raise the overall level of expenditure and they shift the composition of 32 Per capita income in the three countries ranges from $1520 (Ukraine), $3460 (Brazil), and $4710 (Turkey). 22
- 35. spending away from growth related expenditure. In the case of Ukraine, expenditures have grown rapidly from 35 percent of GDP in 2001 to 44 percent in 2006. In Turkey, wages, social security, and transfers and subsidies drove an increase in primary expenditure to 33 percent of GDP between 1995 and 1999. Subsequent fiscal adjustment restrained primary expenditure to 34 percent of GDP. In Brazil, general government expenditure increased from an already high 40 percent of GDP in 1995 to 43 percent of GDP in 2004. 65. Countries have raised revenue rather than cut expenditure to achieve fiscal balance. All three countries have relied principally on revenue increases supplemented by cuts in investment expenditure to generate the primary surpluses necessary to restore market confidence and sustain the debt. Both of these responses, raising revenue and cutting investment, however, undermine incentives for growth. In Ukraine, revenues have been sharply raised from 33 to 42 percent, in Turkey from 34 to 40 percent, and in Brazil tax revenues have been increased from about 28 percent in the 1990s to 38 percent. 66. But the underlying threat to fiscal balance is likely to re-emerge from further pressures to increase social security expenditure. In Turkey, despite favorable demographics, the pension/social security related deficit increased from 1.9 percent of GDP in 2000 to 4 percent of GDP in 2005, owing to low retirement ages, disincentives to remain in the formal labor force, and weak cost containment in health care. Although a major pension reform was proposed in 2006, it has yet to be enacted. In Ukraine, an aging population implies that demographic factors will continue to exert long term pressures to increase pensions and age-related spending. In Brazil, it is estimated that legally mandated social security and health related expenditure could raise total expenditure above 50 percent of GDP in the coming years unless appropriate reforms are implemented. Thus, managing long term expenditure pressures is a critical component of each country’s ability to maintain fiscal space for a growth-oriented fiscal policy. 67. Both the level and composition of expenditure undermine the scope for fiscal policy to support sustained high growth. The high level of expenditure translates into a higher tax burden, which discourages private investment. At the same time, an expenditure program that is heavily weighted towards public consumption and transfers has little positive impact on the long-term growth of the economy. Each of the countries thus faces the need to contain or reduce the level and improve the composition and efficiency of public expenditure to generate the necessary growth stimulus. Ukraine Highlights 68. Ukraine faces constraints to growth due to a high tax burden and poor expenditure composition. Bank analysis suggests the key constraints to long term growth in Ukraine relate to the disincentives created by the high burden of taxation and by the poor composition and efficiency of public expenditure. On the revenue side, reforms that gradually reduce the overall tax burden, particularly by reducing marginal payroll tax rates and increasing reliance on consumption taxes, would improve production and savings incentives and thus growth. 23