

Recomendados
Más contenido relacionado
La actualidad más candente
La actualidad más candente (20)
Destacado
Destacado (12)
Similar a Crime analysis
Similar a Crime analysis (20)
Más de Frank Smilda
Más de Frank Smilda (20)
Último
Último (20)
Crime analysis
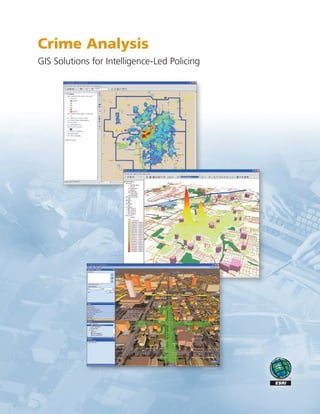
- 1. Crime Analysis GIS Solutions for Intelligence-Led Policing
- 2. GIS aids crime analysis by • Identifying and highlighting suspicious incidents and events that may require further investigation • Supporting pattern and trend analysis across multiple jurisdictions • Enhancing the implementation of various policing methodologies to reduce overall crime and disorder • Integrating traditional and nontraditional law enforcement data to improve overall analysis • Educating the public with visual information to clarify crime concerns and enlist community action • Providing tools and techniques to capture crime series and forecast future crime occurrences Real World Incident Analysis Risks and Hazards Resource Allocation Critical Infrastructure Routing and Tracking Station Locations Applying GIS Technology to Crime Analysis Know Your Community—Analyze Your Crime—Use Your Advantage Whether the problem is tactical, strategic, or administra- tive, any data containing location information can be dis- played and analyzed using geographic information system (GIS) technology. GIS is an essential part of a crime ana- lyst’s toolkit—your means of creating valuable information for your officers in the field. By incorporating traditional law enforcement data with data such as demographics, infrastructure, and offender tracking, you can use GIS to transform information into actionable intelligence. You can improve critical decision making in a rapidly changing environment and have a direct impact on the safety of your officers and the citizens you serve. Every crime problem is related to some location, whether it’s an address, street, ZIP Code™ , or district. GIS can help you leverage the locational aspect of your data to analyze, understand, and build solutions to the problems you face. A map should be the first image they see - not a photo Photos can be on this page but not more prominent than the maps Phoenix Violence Impact Project studied the effects of directed law enforcement efforts by analyzing crime in a specific area. The image on the left indicates a crime hot spot from October 2002 to June 2003. The middle image shows the same area one year later, and the image on the right shows the status of crime two years later.
- 3. Law enforcement often suffers from limited resources. GIS can help you efficiently and effectively match demands for service with service delivery. By knowing where your problems are, it also provides a visual means to proactively combat crime and communicate with citizens to build support. GIS can help you to • Understand events and dynamics in a neighborhood including persons, events, and crime hazards. • Identify risk factors including businesses, buildings, or other locations that draw crime. • Rapidly reconfigure beats and reallocate resources after analyzing crime trends over time. • Develop plans for special crime abatement teams to address regional or seasonal hot spot locations. • Capture repeat call-for-service locations to apply addi- tional help and resources. Officers working the street, or investigators working a case, already know generally where the crime is. In addition to this knowledge, mapping over a period of months can help officers and investigators precisely view and understand underlying crime movements and patterns. For example, can certain types of crime be correlated to the time of day or day of week? Is an open, unmonitored parking structure a draw for criminals? As a crime analyst, you can support your officers in developing more effective tactical approaches and deployment strategies, ulti- mately preventing crime by identifying trends. Using GIS, you can model your workflow and capture your best practices. This allows you to determine what works and share it with others. You can build on your existing knowledge and experience collaborating with officers, investigators, and other analysts. Strategic Crime Mapping Using GIS to Understand Trends and Improve Community Safety Crime density and hot spots are analyzed by the Lincoln Police Department, Lincoln, Nebraska. High Point Police Department, North Carolina, uses ArcGIS® to show the change in serious crimes based on counts per census block. The top left map shows serious crimes in 2003 and the lower right shows crimes in 2007, showing a reduction of crime within that area of the city.
- 4. The Geographic Advantage™ for Crime Analysis Geography is a natural way to organize infor- mation in law enforcement. You can use the geographic advantage in administrative crime mapping to provide an easy-to-understand view into your agency’s activities. GIS map- ping and analysis can help you demonstrate the results of a comprehensive enforcement strategy to government officials, provide a common operating picture to commanders during strategic CompStat meetings, and com- municate with the public through an interac- tive Web site. GIS aids in all aspects of the business of law enforcement. The City of Columbia, South Carolina, Police Department identifies possible drug activity using ArcGIS. Collaborating across Your Organization Showing Your Accountability Process Providing Information to the Community ArcGIS is an enterprise platform for integrating and analyzing information. It allows users to visualize crime threats and alerts for improved decision making. The Frederick County, Maryland, Sheriff’s Department uses GIS to provide information about registered sex offenders that live in the community. Citizens can use this Web site to determine if offenders reside nearby.
- 5. Tactical Crime Mapping Using GIS for a Faster, Safer, More Informed Response Every day you face something different—different demands and different crime. Calls for service can quickly translate into calls from the community to take action. Officers and investigators look to you to provide them with information and analysis. GIS supports your needs in tactical crime mapping by providing a platform for • Analyzing crime data to identify crime patterns and series • Linking modus operandi and suspect informa- tion to specific crime locations • Providing investigative leads by aggregating data from multiple sources • Forecasting potential crime locations through spatial tools and techniques • Supporting operations plans and clarifying ideal deployment locations • Clearing cases by linking suspects to specific crimes after arrest • Continuous active monitoring of high-risk and convicted sex offenders Identifying Patterns and Series Using GIS, you can create a map that can identify where the crimes are occurring and clarify what crimes are or are not related based on your research. This can allow investigators to target their efforts and line officers to patrol and respond to locations while being more fully aware. Surveillance and Operations Plans Criminals often victimize a community multiple times. GIS can help you gain an accurate view of a community to determine an offender’s travel pat- tern and the ideal locations for surveillance. Clearing Cases You can analyze data to examine an alibi or clarify whether a suspect was in direct proximity to a crime. GIS links data from various datasets on offenders and crime and allows a sophisticated platform for analysis. GIS provides an information-based method supporting all roles and aspects of law enforcement. Line Officer or Investigator Officers can access current crime analysis and suspect information while in the field or during an investigation. The ability to spatially query, analyze, and visualize information provides fast and intuitive means to work smarter. Command Staff Command staff can use GIS to understand trends, make critical deci- sions when crime spikes, and collaborate with other law enforcement agencies to put the right people in the right place at the right time. Crime Analyst A crime analyst can use sophisticated tools and techniques to pro- vide command staff with knowledge and intuition to support better operational decisions and to address short-term tactical and long-term strategic issues. This shows geographic analysis of serial crime events in a major metropolitan area.
- 6. ArcGIS Desktop GIS Server GIS Online GIS ESRI Data Mobile GIS ArcGIS Server ArcGIS Image Server ArcGIS SM Online Community TM Data StreetMap TM Premium ESRI Data & Maps ArcGIS Mobile ArcPad ® ArcGIS ® Desktop ArcGIS Engine ArcGIS Explorer No. GS-35F-5086H Printed in USA 111241 INLD12M4/08ed Copyright © 2008 ESRI. All rights reserved. ESRI, the ESRI globe logo, ArcScene, The Geographic Advantage, ArcMap, ArcInfo, ArcGIS, ArcPad, Community, StreetMap, @esri.com, and www.esri.com are trademarks, registered trademarks, or service marks of ESRI in the United States, the European Community, or certain other jurisdictions. Other companies and products mentioned herein may be trademarks or registered trademarks of their respective trademark owners. 1-800-GIS-XPRT (1-800-447-9778) www.esri.com Locate an ESRI value-added reseller near you at www.esri.com/resellers For More Information ESRI 380 New York Street Redlands, California 92373-8100 USA Phone: 909-793-2853 Fax: 909-793-5953 E-mail: info@esri.com ESRI Regional Offices Olympia 360-754-4727 St. Louis 636-949-6620 Minneapolis 651-454-0600 Boston 978-777-4543 Washington, D.C. 703-506-9515 Charlotte 704-541-9810 San Antonio 210-499-1044 Denver 303-449-7779 California 909-793-2853 ext. 1-1906 Philadelphia 610-644-3374 ArcGIS® : The Complete Enterprise GIS Whether you need to perform spatial analysis, manage large amounts of spatial data, or produce cartographically appeal- ing maps to aid in decision making, ArcGIS® allows you to use one common platform to meet all your GIS needs. And because ArcGIS is built using technology standards, it will integrate well with your existing systems. ArcGIS is a complete system for authoring, serving, and using geographic information. It is an integrated collection of GIS software products for building and deploying a complete GIS wherever it is needed—on desktops or servers or in custom applications, over the Web, or in the field. Learn more about GIS for crime analysis at www.esri.com/publicsafety. Outside the United States, contact your local ESRI distributor. For the number of your distributor, call ESRI at 909-793-2853, ext. 1-1235, or visit our Web site at www.esri.com/distributors