SlideShare una empresa de Scribd logo
1 de 135
Original article
Gamma radiation effect on quality changes in vacuum-packed
squid
(Illex argentinus) mantle rings during refrigerated (4–5 �C)
storage
Alejandra Tomac* & Marı́a Isabel Yeannes
Grupo de Investigación Preservación y Calidad de Alimentos,
Facultad de Ingenierı́a, Universidad Nacional de Mar del Plata,
Consejo Nacional de
Investigaciones Cientı́ficas y Técnicas (CONICET), Juan B.
Justo 4302, B7608FDQ, Mar del Plata, Argentina
(Received 14 October 2011; Accepted in revised form 21
February 2012)
Summary The effect of gamma radiation (0, 1.8, 3.3 and 5.8
kGy) on microbiological, chemical and colour
characteristics of vacuum-packed squid (Illex argentinus)
mantle rings was studied. Total viable counts;
psychrotrophic bacteria counts, Escherichia Coli,
Staphylococcus aureus and Clostridium perfringens; total
volatile basic nitrogen (TVBN) and colour differenceDE�ab
were analysed during 29 days of storage at
4–5 �C. Higher doses of gamma radiation significantly reduced
Total Viable, phychrotrophic counts and
TVBN production (P < 0.05) in a dose-dependent way, delaying
squid spoilage. Colour difference of non-
irradiated samples with respect to first day significantly
increased while it was constant in radiated samples
during 22 days (P < 0.05). Independently from the dose,
radiation avoided colour changes of squid rings.
Gamma irradiation was effective in delaying deterioration
reactions, improving microbiological, chemical
and colour quality of vacuum-packed squid rings stored at 4–5
�C.
Keywords Colour, Illex argentinus, ionising radiation, microbial
activity, quality, refrigeration.
Introduction
Food irradiation has been widely studied as a food
preservation method for the last five decades. It has
certainly proved its toxicological safety as well as it
efficiency in shelf life extension by decreasing microbial
counts. At present, more than 60 countries have
approved irradiation of one or more foods (WHO,
1994, 1999, Diehl, 2002; Sommers & Fan, 2006).
Nutritional adequacy of irradiated food has also been
largely investigated. Irradiation can induce changes in
proteins, lipids, carbohydrates and vitamins due mainly
to free radicals produced by water radiolysis. However,
no significant losses of the nutritional quality of lipid,
carbohydrate and protein constituents have been re-
ported at irradiation doses intended for food preservation
(£10 kGy) (Josephson et al., 1978; Kilcast, 1995; Giroux
& Lacroix, 1998; ICGFI, 1999; ADA Report, 2000).
Among lipids, polyunsaturated fatty acids (PUFAs)
are more sensitive to oxidation by free radicals. The
absence of oxygen can minimise this effect, as observed
by Kim et al. (2002) in raw beef, turkey and pork meats.
Erkan & Özden (2007) concluded that irradiation had
only marginal effects on the lipids of fishery products,
including the essential alpha-linolenic acid. Abreu et al.
(2010) found that irradiation doses up to 6 kGy did not
compromise negatively the fatty acid composition,
omega three long chain PUFAs and lipid stability of
frozen headed shrimps.
In proteins, irradiation can promote cleavage of
peptide and disulphide bonds as well as aggregation
reactions, without drastic changes in the amino acid
content. According to various research works, no
considerable losses were detected in essential and non-
essential amino acids of different food systems (Giroux
& Lacroix, 1998; Josephson et al., 1978; Kilcast, 1995;
Urbain, 1986). Haddok fillets irradiated with 53 kGy
did not show significant differences in their amino acid
content (Venugopal et al., 1999). Erkan & Özden (2007)
studied the amino acid composition of Sparus aurata
irradiated with 2.5 and 5 kGy and observed that, in
general, it was slightly increased by gamma irradiation.
Vitamins sensitivity to irradiation depends on their
solubility in water or fat and the complexity of the food.
Vitamins B1 (thiamin), C (ascorbic acid), A (retinol) and
E (a-tocopherol) are sensitive to irradiation. Thiamin is
considered the most radiation labile water-soluble vita-
min. However, it is more sensitive to heat than to
irradiation. Alpha-tocopherol is recognised as the most
radiation sensitive fat-soluble vitamin (Giroux & Lac-
roix, 1998; ICGFI, 1999).
*Correspondent: E-mails: [email protected];
[email protected]
International Journal of Food Science and Technology 2012, 47,
1550–15571550
doi:10.1111/j.1365-2621.2012.03005.x
� 2012 The Authors. International Journal of Food Science and
Technology � 2012 Institute of Food Science and Technology
Considering the aforementioned, the effects of irradi-
ation on the nutritional value of foods are minimal and
these observations are substantiated by the results of
many feeding studies that have been undertaken to
establish the wholesomeness of irradiated food (ICGFI,
1999).
Radiation processing benefits on the preservation and
microbial quality improvement of fish and seafood have
been supported by more than 40 years of scientific
studies. Some of these were reviewed by Foley (2006).
Doses of 1–3 kGy have been used in fish and of 2–7 kGy
in shellfish with satisfactory results in shelf life extension
(Kilcast, 1995). Shelf life of Sea bream (Chouliara et al.,
2004), Merluccius hubbsi (Lescano et al., 1990) and
whole anchovies (Lakshmanan et al., 1999) was im-
proved by gamma irradiation, and shelf-stable ready-to-
eat shrimps were developed using this technology by
Kanatt et al. (2006). Byun et al. (2000) have preserved
salted and fermented squid (Todarodes pacificus) by
gamma irradiation, but no studies on shelf life improve-
ment of fresh minimally processed squid have been
made to the moment.
In the last decades, the world market of squid has
considerably risen, making of the Southwest Atlantic
Ocean region one of the most important fishery zones.
Illex argentinus is the most abundant squid species of the
region, representing the second fishery in volume, after
Merluccius hubbsi. It is frequently found between the
52�S and the 35�S over the Argentinean continental
platform and slope (Brunetti et al., 1999). In 2006, total
marine captures exceeded one million tons, of which
squid represented 27.3% (MINAGRI, 2007).
Many different squid products are found in the
market. Squid tubes and rings are usually treated with
polyphosphates solutions that are largely used in the
fishery industry to improve water-holding capacity of
proteins. This fact benefits the final quality of the
product by retaining natural moisture, flavour and
nutrients, improving texture and reducing the cooking
loss. In addition, phosphates delay lipid oxidation and
stabilise colour by quelling enzyme (metal) cofactors
(Lampila, 1993; Knipe, 2004; Gonçalves & Duarte
Ribeiro, 2008, 2009).
After catch, quality of squid decreases because of
chemical and microbiological deteriorating reactions.
Research has been done on quality of fresh and spoiling
squid (Melaj et al., 1997; Lapa-Guimarâes et al., 2002;
Paarup et al., 2002a,b; Vaz-Pires et al., 2008). During
spoilage, the main chemical change is the gradual
accumulation of certain volatile amines in the flesh,
which regroup mainly trimethylamine (TMA), dimeth-
ylamine (DMA) and ammonia (Huss, 1995). Spoilage is
also characterised by the decrease in sensory quality
because of changes in squid skin and muscle colour.
These colour changes associated with quality loss have
been studied by Lapa-Guimarâes et al. (2002) in Loligo
plei, by Sungsri-In et al. (2011) in Loligo formosana and
by Thanonkaew et al. (2006) in Loligo peali.
The objective of this work was to analyse the effect of
different gamma radiation doses on microbial activity
and colour changes of vacuum-packed squid (Illex
argentinus) rings during refrigerated storage.
Materials and methods
Raw material source, treatment and storage
Peeled squid mantle rings of Illex argentinus specimens
(width = 1.2 cm approximately.) pretreated with com-
mercial polyphosphates solutions were acquired in the
port of Mar del Plata (Argentina). They were covered in
ice flakes and transported to laboratory in polystyrene
containers. Samples of approximately 110 ± 2 g were
vacuum packed in Cryovac bags of LDPE and nylon
(125 lm) using a packaging machine MINIMAX 430M
(SERVIVAC, Argentina). Samples were transported
and refrigerated (4 ± 3 �C) to the semi-industrial Eze-
iza Atomic Centre facility [National Atomic Energy
Commission (CNEA) of Argentina; activity:
600 000 Ci]. They were gamma irradiated with a Cobalt
60 source at 1.8, 3.3 and 5.8 kGy (minimum doses
absorbed). Doses were determined with Amber Persex
dosimeters. Irradiated and non-irradiated samples (con-
trol, 0 kGy) were stored at 4–5 �C for 29 days. Samples
were analysed days 0, 1, 5, 8, 12, 15, 19, 22, 26 and 29
after irradiation. Each sample consisted of a 110 ± 2 g
bag of vacuum-packed squid rings (approximately 20
squid rings). There were three samples for each day of
analysis and each radiation dose.
Microbiological analysis
The following analyses were performed to monitor
bacterial flora changes during refrigerated storage. Ten
grams of sample in saline solution (0.85%) with 0.1%
w ⁄ v peptone (ICMSF, 1983) made to 100 mL were
macerated in a Stomacher 400 Circulator Homogenizer.
Microbiological analyses were done in triplicate and
expressed as log CFU per gram. The counts of total
microorganisms and isolations of particular microbial
groups were performed using the following culture
media and culture conditions.
Psychrotrophic bacteria on plate count agar incu-
bated at 7 ± 0.5 �C for 10 days, total viable counts
aerobic mesophilic bacteria (TVC) incubating at
35 ± 0.5 �C during 48 h (ICMSF, 1983), coliforms on
violet red bile agar incubated at 35 ± 0.5 �C for 24 h
(ICMSF, 1983), faecal coliforms in brilliant green bile
broth incubated at 44 ± 0.5 �C for 48 h (ICMSF,
1983), and Staphylococcus spp. on Baird-Parker agar
incubated at 35 ± 0.5 �C for 48 h (ICMSF, 1983).
Coagulase test and manitol salt agar were used for
Gamma radiation effect on quality changes A. Tomac and M. I.
Yeannes 1551
� 2012 The Authors International Journal of Food Science and
Technology 2012
International Journal of Food Science and Technology � 2012
Institute of Food Science and Technology
identification of S. aureus (ICMSF, 1983). Sulphite-
reducing Clostridium on SPS Agar (Merck) was incu-
bated in anaerobic jars at 35 ± 0.5 �C and 45 ± 0.5 �C
for 48 h (ICMSF, 1983; Pascual & del Rosario, 2000).
Colonies were confirmed by motility-nitrate test (IC-
MSF, 1983).
Total volatile basic nitrogen
It was determined by the commercial method for TVBN
adapted from the direct distillation method (Giannini
et al., 1979). Ten grams of processed squid rings were
homogenised with 300 mL of distilled water, 2 mL of
antifoaming, porous plate and 5 g of Magnesium oxide.
Distillate was collected in 50 mL of boric acid 2% w ⁄ v
and 1 mL of indicator (100 mL ethanol, 0.05 g methyl
red and 0.075 g bromocresol green) to a final volume of
230 mL. Then, it was titrated with sulphuric acid 0.1 N.
TVBN was determined by duplicate. Results were
expressed in milligrams of total volatile basic nitrogen
per 100 g of wet sample.
Colour analysis
CIELAB colour space system parameters, (L* =
lightness, a* = red (+) and green (-) colour intensity,
and b*= yellow (+) and blue (-) colour intensity) were
determined with a portable colorimeter (NR-3000;
Nipon Denshoku Kogyo Co. Ltd., Tokiyo, Japan).
Measurements were made on five rings of each sample.
These values were used to calculate colour differences
DE�ab (C.I.E., 1978) for each storage time analysed with
respect to reference (day 1) using
DE�ab ¼ ½ðL
� � L�rÞ
2 þða� � a�rÞ
2 þðb� � b�rÞ
2�1=2.
Statistical analysis
Results were analysed by a completely aleatorised design
with two main factors: Radiation Dose (0, 1.8, 3.3 and
5.8 kGy) and Days of Storage (0, 1, 5, 8, 12, 15, 19, 22,
26 and 29 days). Interaction between them was also
analysed. A two-ways anova test was used with 5%
significance level. Tukey test was used to compare means
(P < 0.05). The R-Project software was used (R
Development Core Team, 2008).
Results and discussion
Microbiological analysis
Total viable aerobic counts of mesophilic bacteria
evolution during storage at 4–5 �C for different doses
are shown in Fig. 1. Before irradiation was applied,
initial TVC of squid rings was 2.12 · 104 ± 6.5
· 102 CFU g)1. In Fig. 1, it can be seen that with doses
of 1.8, 3.3 and 5.8 kGy, logarithmic cycle’s reductions of
0.9, 1.6 and 2.2 were achieved in initial TVC, respec-
tively, 1 day after irradiation. This fact shows the
significant effect of radiation to reduce initial TVC
values compared with control, in which TVC increased
on day 1 with respect to day 0 (P < 0.05).
Initial TVC of control significantly increased up to
9.1 · 107 ± 2.1 · 106 CFU g)1 after 19 days of refriger-
ated storage. It was significantly higher than TVC of
radiated samples during the whole storage period because
its increment was faster than in radiated samples
(P < 0.05). TVC of samples radiated with 1.8 kGy
significantly increased during 19 days but in a lower rate
than it did in control (P < 0.05). Total viable counts of
samples radiated with 3.3 kGy significantly increased
during 22 days but tended to decrease on days 26 and 29
due possibly to nutrient depletion. At day 19 after
radiation, a reduction of one logarithmic cycle was
achieved with a dose of 1.8 kGy. With 3.3 and 5.8 kGy,
TVC counts were reduced in three and six logarithmic
cycles compared with control, respectively. Samples radi-
ated with higher doses reached lower viable counts. During
storage, samples radiated with 1.8 and 3.3 kGy had a
similar tendency to control, showing exponential growth
(lower counts with higher dose, as aforementioned).
However, samples radiated with 5.8 kGy presented a
different behaviour, with decreasing mesophilic counts
during storage, reaching a reduction under TVC values of
day 1. In samples radiated with 5.8 kGy, TVC values of
days 8, 12 and 15 were significantly lower than TVC of days
1 and 5 (P < 0.05). This behaviour was also commented
by Kodo (1990) with a dose of 3 kGy in mackerel fillets.
Different microbiological counts limits have been sug-
gested for different fish and mollusc species, and they vary
Figure 1 Total Viable Mesophilic Counts (log CFU g
)1
) evolution in
vacuum-packed Illex argentinus rings during storage at 4–5 �C.
Standard error represented by bars (n = 3). ND, Not detectable
(<10 UFC g
)1
).
Gamma radiation effect on quality changes A. Tomac and M. I.
Yeannes1552
International Journal of Food Science and Technology 2012 �
2012 The Authors
International Journal of Food Science and Technology � 2012
Institute of Food Science and Technology
according to many factors, such as, species, sample
treatment and storage conditions, among others. Moragas
Encuentra & De Pablo Busto (1991) mentioned a limit of
10
6
CFU g
)1
for fresh fishery products (dotted line in
Fig. 1). In this work, TVC of 10
6
CFU g
)1
was found in
control at day 8, while with a dose of 1.8 kGy that value
was reached after 15 days of storage. It was not reached
during 29 days of refrigerated storage with doses of 3.3
and 5.8 kGy, which highest TVC were 5.3 · 105 and
2.3 · 104 CFU g)1, at days 22 and 29 after irradiation,
respectively. Considering these values, gamma irradiation
extended microbiological shelf life of squid rings in seven
and in more than 21 days with respect to control, using
doses of 1.8 and 3.3 or 5.8 kGy, respectively.
In control Staphylococcus spp. colonies developed on
day 8 and after 12, 15 and 19 days in samples radiated
with 1.8, 3.3 and 5.8 kGy, respectively. Coliforms were
detected on day 5 in control, on day 12 in samples
irradiated with 1.8 kGy and on day 19 in samples
irradiated with 3.3 kGy. Coliforms were not detected in
samples irradiated with 5.8 kGy during 29 days of
storage. Gamma radiation reduced the rate of growth
of Staphylococcus spp. and coliforms.
Pathogens microorganisms investigated (Staphylococ-
cus aureus, Clostridium perfringens and Escherichia coli)
were not found during the whole storage period, neither
in control nor in radiated samples.
Gamma radiation significantly reduced TVC counts in
a dose-dependent way. During the whole storage period,
TVC of control was higher than radiated samples. The
higher dose applied the lower bacterial counts found in
vacuum-packed Illex argentinus rings (P < 0.05).
In Fig. 2, it is shown psychrotrophic bacteria counts
evolution during refrigerated storage of control and
radiated Illex argentinus rings.
Initial psychrotrophic counts were 2.8 · 104 ± 4.6 ·
10
2
CFU g
)1
. One day after radiation, logarithmic
cycle’s reductions of 1, 1.8 and 3.4 were achieved with
1.8, 3.3 and 5.8 kGy, respectively; meanwhile, psychro-
trophic counts of control increased in the same period.
After radiation induced initial counts reduction, psy-
chrotrophic counts of samples 0, 1.8 and 3.3 kGy
significantly increased up to 3.9 · 109 ± 1.3 · 108, 1.8 ·
10
8
± 2.1 · 106 and 5.1 · 105 ± 2.1 · 104 CFU g)1,
respectively, during 19 days of refrigerated storage
(P < 0.05). In samples radiated with 5.8 kGy, colonies
were not detected at days 1, 5 and 8 after radiation, but
after that period counts significantly increased up to
1.4 · 104 ± 1.5 · 102 CFU g)1 on day 19.
Psychrotrophic counts for control were significantly
higher than 1.8, 3.3 and 5.8 kGy during the whole
storage period after irradiation was applied. Psychro-
trophic counts of samples radiated with 1.8 kGy were
significantly higher than 3.3 kGy and 5.8 kGy. Samples
radiated with 3.3 kGy had significantly higher counts
than 5.8 kGy during 29 days of refrigerated storage
(P < 0.05). Statistical results indicated that gamma
radiation significantly reduced psychrotrophic counts in
a dose-dependent way (P < 0.05).
Even when a dose of 1.8 kGy was enough to reduce
microbial counts compared with control, with doses of
3.3 and 5.8 kGy, this effect was more important. At day
19 a 1, 3.8 and 5.5 logarithmic cycle reduction in
psychrotrophic bacteria counts were achieved with 1.8,
3.3 and 5.8 kGy, respectively. With a dose of 1.8 kGy,
bacterial counts were lowered but no more than in one
logarithmic cycle; therefore, higher doses could be more
useful to extend squid rings microbiological shelf life.
Psychrotrophic bacteria counts after 19 days of
refrigerated storage were higher than mesophilic counts
in all samples. According to Huss (1994), psychrotroph-
ic bacteria are particularly the major group of microor-
ganisms responsible for spoilage of fresh seafood.
Refrigeration temperatures favour their growth, and so
they were at an adequate temperature range to growth
during storage conditions of this work.
Initial TVC and psychrotrophic counts reductions
because of gamma radiation found in this work are in
accordance with Kodo (1990), who explains the radia-
tion induced initial counts reduction by the inhibition of
predominant bacteria and a subsequent growth of more
radio resistant species that were initially limitated by the
others. Similar results were found by Byun et al. (2000)
who found that increasing radiation doses lowered
initial viable cell populations in fermented Todarodes
pacificus and that a dose of 5 kGy helped to improve
microbiological quality of 10% NaCl salted squid.
Like in this work, Lakshmanan et al. (1999) observed
a reduction in TVC because of gamma radiation in
whole anchovies irradiated at 2 kGy. Also Kanatt et al.
(2006) found lower counts at higher doses in marinated
Figure 2 Psychrotrophic bacteria counts (log CFU g
)1
) evolution in
vacuum-packed Illex argentinus rings during storage at 4–5 �C.
Standard error represented by bars (n = 3). ND, Not detectable
(<10 UFC g
)1
).
Gamma radiation effect on quality changes A. Tomac and M. I.
Yeannes 1553
� 2012 The Authors International Journal of Food Science and
Technology 2012
International Journal of Food Science and Technology � 2012
Institute of Food Science and Technology
precooked shrimps, using gamma irradiation at doses of
1, 2.5 and 5 kGy. Goldblith (1971) has explained that
ionising radiation inactivates microorganisms by direct
and indirect action. In direct action, it damages cells’
DNA in living organisms by an ionising particle or ray.
In indirect action, the products of radiolysis, usually of
water in most foods, affect the cell. Brewer (2009) also
explains that free radicals generated by radiation can
damage the DNA of growing cells, accomplishing a
90% reduction in spoilage bacteria with 1–1.5 kGy.
According to microbiological analyses carried out in
this work on vacuum-packed Illex argentinus mantle
rings during refrigerated storage, gamma radiation was
useful for reducing mesophilic, psychrotrophic, coli-
forms and Staphylococcus spp. bacterial counts in a
dose-dependent way. Higher doses extended the storage
period in which squid rings reached suggested microbial
counts limits. The effect of 3.3 and 5.8 kGy of shelf life
extension was more important than the one achieved
with 1.8 kGy.
Figures aforementioned support the feasibility of
extending microbiological shelf life of vacuum-packed
squid rings by gamma radiation.
Total volatile basic nitrogen
One of the most widely used parameters to evaluate fish
freshness is total volatile basic nitrogen (TVBN) that
includes the measurement of TMA, DMA and ammonia
(Huss, 1995). Woyewoda & Ke (1980) recommended the
use of TVBN as a laboratory test for squid quality
assessment. In this work, it was used as a freshness
indicator of squid rings. In Fig. 3, it is shown its
evolution in squid rings during storage at 4–5 �C for
different doses applied. TVBN initial mean value was
15.16 ± 0.16 mg per 100 g. TVBN values of control
and radiated squid rings showed an increasing behav-
iour during refrigerated storage, but the rate of TVBN
accumulation was different depending on the radiation
dose and the storage time. It was inverse to the dose
applied (i.e. with higher doses, lower TVBN values were
reached), and it was considerably accelerated after
5 days of storage in non-radiated samples, increasing
exponentially. Meanwhile, it took 8 and 12 days to
reach the TVBN accelerated accumulation phase in
samples radiated with 1.8 and 3.3 kGy, respectively. In
samples radiated with the higher dose (5.8 kGy), TVBN
increased only linearly with time and did not reach an
exponential phase during 22 days. TVBN values were
significantly higher for samples radiated with 0, 1.8, 3.3
and 5.8 kGy, respectively, from day 8 after irradiation
until day 22 (P < 0.05).
With 1.8, 3.3 and 5.8 kGy, TVBN reductions of 52%,
69% and 86% were achieved with respect to control on
storage day 15, respectively. Alur et al. (1994) found a
50% to 60% reduction in total volatile bases in
irradiated fish flesh compared with non-irradiated sam-
ples.
Gamma irradiation delayed squid spoilage with high-
er radiation doses decreasing TVBN production (Fig. 3)
in accordance with microbiological results.
Gamma radiation has been reported to have little
effect on enzymatic systems but to have a considerable
microcidal effect (Kodo, 1990; Ahn & Lee, 2006).
Hwang & Hau (1995) studied the residual activity of
proteolytic enzymes [Ca
2+
dependent proteases (CDP)
and Catepsyn D] in irradiated chicken. These proteases
are considered responsible of meat deterioration. They
found that irradiation doses up to 50 kGy did not affect
the activity of Catepsyn D. CDP activity decreased with
increasing irradiation dose, but it was not fully inacti-
vated. According to Urbain (1986), lipolytic enzymes
involved in the endogenous hydrolysis of phospholipids
and neutral lipids were not fully inactivated by an
irradiation dose of 50 kGy.
The microcidal effect was observed in this work (3.1).
Lower microorganism counts would imply a decrease in
TMA production leading to a reduction in the rate of
TVBN accumulation, also detected in this study. TVC
and psychrotrophic counts evolution correlated in a
good way with TVBN results, because exponential
TVBN production was related to high bacterial counts.
In samples radiated with 5.8 kGy (which presented
better microbial and chemical parameters), TVC and
psychrotrophic counts of 9.5 · 101 and
1.0 · 104 CFU g)1were found, respectively, at day 19
and this samples never reached exponential TVBN
production phase. Higher doses implied lower microor-
Figure 3 Total volatile basic nitrogen (TVBN) (mg per 100 g
squid
rings) evolution during storage at 4–5 �C for the different
radiation
doses (kGy). Same letters (a, b, c, d, e, f) indicate non-
significant
differences in time for the same dose. TVBN values with same
Capital
letters are not significantly different between doses (Tukey
Test,
P < 0.05). Bars represent standard error.
Gamma radiation effect on quality changes A. Tomac and M. I.
Yeannes1554
International Journal of Food Science and Technology 2012 �
2012 The Authors
International Journal of Food Science and Technology � 2012
Institute of Food Science and Technology
ganisms counts that lead to a retard in TMA accumu-
lation and hence a slowed down TVBN production rate.
The last day of analysis, day 22, TVBN of control,
1.8, 3.3 and 5.8 kGy was 152.3 ± 5.0; 133.9 ± 3.0;
79.8 ± 3.3 and 29.2 ± 2.4 mg per 100 g, respectively.
According to the scale established by Woyewoda & Ke
(1980) for squid (Illex illecebrosus), the quality of squid
can be considered excellent when TVBN is below 30 mg
per 100 g; meanwhile, it is considered unacceptable
when TVBN is higher than 45 mg per 100 g. Also,
30 mg per 100 g is the value established as limit of
acceptance in most of commercial transactions. In this
study, higher radiation doses permitted to maintain an
excellent quality during a longer storage period, by
increasing the time at which TVBN reached a value of
30 mg per 100 g. Quality of control sample was consid-
ered excellent during 6 days, while samples radiated
with 1.8, 3.3 and 5.8 kGy during 9, 12 and 22 days,
respectively.
This results would show the efficiency of gamma
radiation to delay squid spoilage and thus to increase its
shelf life.
Colour
Colour changes were analysed for being associated with
spoilage reactions. In Fig. 4, it is shown the evolution of
colour difference DE�ab of vacuum-packed Illex argenti-
nus mantle rings during storage at 4–5 �C. Colour
difference of control significantly (P < 0.05) increased
during storage, reaching a value of 14.67 on day 22. For
all treated samples, there were no significant differences
of DE�abduring the 22 days of storage at 4–5 �C
(P > 0.05). Values of DE�ab were practically constant
ranging between 1.96 and 3.81 for radiated samples
during the whole storage period. After day 8, DE�ab of
control was significantly higher than all radiated sam-
ples until the end of the analyses period (P < 0.05).
Mean value of L* on the first day was 52.7 ± 0.6. L*
significantly increased to 63.2 ± 1.9 in control sample
until day 22. Meanwhile, in irradiated samples, L* only
reached a mean value 54.7 ± 0.7 for doses 1.8, 3.3 and
5.8 kGy. L* of non-irradiated samples was significantly
higher than irradiated samples since day 5 (P < 0.05).
There were no significant differences in L* on day 22
between irradiated samples (P > 0.05). Sugiyama et al.
(1989) informed that after capture of squid, the trans-
parency of its meat is gradually lost and squid meat
becomes tinged white (related with L* increase).
The first day, b* mean value was )6.5 ± 0.9. In
control sample, b* significantly increased to )3.3 ± 1.2
(day 22), while it remained almost unchanged in
irradiated samples during the whole storage period,
reaching a mean value of )6.2 ± 0.2 on day 22. There
were no significant differences between irradiated sam-
ples (P > 0.05) at the end of the storage period.
Increases in b* have been informed during squid
spoilage. Thanonkaew et al. (2006) mentioned an
increase in b* in Loligo peali, associated with an increase
in yellowness because of deterioration and lipid oxida-
tion products reactions. They suggested that yellow
pigmentation in squid mantle could be due to non-
enzymatic browning reactions between products of
aldehydic lipid oxidation and the amines of phospho-
lipids head groups.
Mean value of a* was )2.7 ± 0.8 on the first day of
storage. Values of a* decreased in control to )4.8 ± 0.7
(day 22), but there were not significant differences
during storage time for all irradiated samples
(P > 0.05). Mean value for samples irradiated with
1.8, 3.3 and 5.8 kGy was )2.3 ± 0.4 on day 22, without
significant differences among them (P > 0.05). During
spoilage of squid, an increase in a* has been informed by
Sungsri-In et al. (2011) because of pink spots formation.
In this work, a* tended to decrease in control due
probably to the previous skinning of squid and the use
of polyphosphates that have been reported to improve
colour characteristics of fish products.
Gamma irradiation avoided colour changes of squid
rings. It permitted to keep colour parameters almost
unchanged during 22 days of storage at 4–5 �C in squid
rings. Meanwhile, colour parameters of control signif-
icantly changed during storage, with an increase in b*
and L* and a decrease in a* values. These changes in
control can be explained by the loss of quality because
of deteriorating reactions. According to results found in
this work, gamma irradiation would avoid colour
Figure 4 Squid rings Color Difference with respect to day 1
during
storage at 4–5 �C. Standard error represented by bars. Different
letters
(a, b, c) indicate significative differences in time for control.
Values
with * are significantly different between doses. No significant
differences during storage time were found for all radiated
samples
(Tukey Test, P < 0.05, n = 3).
Gamma radiation effect on quality changes A. Tomac and M. I.
Yeannes 1555
� 2012 The Authors International Journal of Food Science and
Technology 2012
International Journal of Food Science and Technology � 2012
Institute of Food Science and Technology
changes because of deteriorating reactions in squid
rings, without changing their characteristic colour.
Conclusions
Gamma irradiation permitted to improve microbiolog-
ical quality of vacuum-packed squid rings, lowering
bacterial populations, reducing immediately after radi-
ation the TVC and psychrotrophic counts and slowing
down coliforms and Staphylococcus spp. growth. A
dose-dependent reduction was observed, reaching lower
counts with higher doses. TVBN production during
storage at 4–5 �C was lower at higher doses, indicating a
deterioration delay, in accordance with microbiological
results. With higher doses, linear phase of TVBN
evolution was extended, delaying exponential phase
related to bacterial growth. Gamma radiation avoided
colour changes in vacuum-packed squid mantle rings
during 22 days of storage at 4–5 �C, while colour
significantly changed in non-irradiated sample. Gamma
irradiation helped to delay deterioration reactions that
lead to quality loss of minimally processed vacuum-
packed Illex argentinus rings, extending microbiological
shelf life.
Acknowledgments
This work was supported by UNMDP (Projects
15 ⁄ G206 ⁄ 07 and 15 ⁄ G264 ⁄ 09) and Consejo Nacional
de Investigaciones Cientı́ficas y Técnicas (CONICET,
PIP 5052), and the authors are grateful to these
Institutions. Authors are especially thankful to Mrs.
Irene Ameztoy for her collaboration with microbiolog-
ical analysis, and to Patricia Narvaiz for her assistance
at CNEA Ezeiza Atomic Center.
References
Abreu, V.K.G., Pereira, A.L.F., Vidal, T.F., Zapata, J.F.F.,
Sousa
Neto, M.A. & Freitas, E.R. (2010). Fatty acids, cholesterol,
oxidative rancidity, and color of irradiated shrimp. Ciencia y
Tecnologı́a de Alimentos, Campinas, 30, 969–973.
ADA Report (2000). Position of the American Dietetic
Association:
food Irradiation. Journal of the American Dietetic Association,
100,
246–253.
Ahn, D.U. & Lee, E.J. (2006). Mechanisms and prevention of
quality
changes in meat by irradiation. In Food Irradiation Research
and
Technology. (edited by C.H. Sommers. & X. Fan). Pp. 127–142.
IFT
Press, Blackwell Publishing: Oxford, UK.
Alur, M.D., Warier, S.B., Doke, S.N. & Nair, P.M. (1994). Role
of
bacterial proteolysis in the spoilage of irradiated flesh foods.
Journal
of Food Biochemistry, 17, 419–435.
Brewer, M.S. (2009). Irradiation effects on meat flavour: a
review.
Meat Science, 81, 1–14.
Brunetti, N.E., Ivanovic, M.L. & Sakai., M. (1999). Calamares
de
importancia comercial en la Argentina. Biologı́a, distribución,
pesquerı́as, muestreo biológico. Pp. 45. Argentina: Instituto
Nac-
ional de Investigación y Desarrollo Pesquero (INIDEP), Mar del
Plata.
Byun, M.-W., Lee, K.-H., Kim, D.-H., Kim, J.-H., Yook, H.-S.
&
Ahn, H.-J. (2000). Effects of gamma radiation on sensory
qualities,
microbiological and chemical properties of salted and fermented
squid. Journal of food protection, 63, 934–939.
Chouliara, I., Savvaidis, I.N., Panagiotakis, N. & Kontominas,
M.G.
(2004). Preservation of salted, vacuum-packed, refrigerated sea
bream (Sparus aurata) fillets by irradiation: microbiological,
chem-
ical and sensory attributes. Food Microbiology, 21, 351–359.
C.I.E. (1978) Recommendations on uniform colour spaces,
colour
difference equations, psychometric colour terms. CIE
publication
No.15 (E.-1.3.1) 1971, Supplement No.2. Viena.
Diehl, J.F. (2002). Food irradiation – past, present and future.
Radiation Physics and Chemistry, 63, 211–215.
Erkan, N. & Özden, Ö. (2007). The changes of fatty acid and
amino
acid compositions in sea bream (Sparus aurata) during
irradiation
process. Radiation Physics and Chemistry, 76, 1636–1641.
Foley, D.M. (2006). Irradiation of Seafood with a particular
emphasis
on Listeria Mocytogenes in ready-to-eat products. Charpter 11,
In
Food Irradiation Research and Technology. (Edited by C.H.
Som-
mers & X. Fan). Pp. 185–197. IFT Press, Blackwell Publishing,
Oxford, UK.
Giannini, D.H., Davidovich, L.A. & Lupı́n, H.M. (1979).
Adaptación
del método comercial para la determinación de Nitrógeno básico
Volátil en merluza (Merluccius Hubbsi). Revista de
Agroquı́mica y
Tecnologı́a de Alimentos, 19, 55–60.
Giroux, M. & Lacroix, M. (1998). Nutritional adequacy of
irradiated
meat – a review. Food Research International, 31, 257–264.
Goldblith, S.A. (1971). In: The inhibition and destruction of the
microbial cell by radiation, in Inhibition and Destruction of the
Microbial Cell (edited by W.B. Hugo). Pp. 285–305. London:
Academic Press.
Gonçalves, A.A. & Duarte Ribeiro, J.L. (2008). Optimization of
the
freezing process of red shrimp (Pleoticus muelleri) previously
treated
with phosphates. International Journal of refrigeration, 31,
1134–
1144.
Gonçalves, A.A. & Duarte Ribeiro, J.L. (2009). Effects of
phosphate
treatment on quality of red shrimp (Pleoticus muelleri)
processed
with cryomechanical freezing. LWT – Food Science and
Technolog,
42, 1435–1438.
Huss, H.H. (1994). Assurance of seafood quality. FAO fisheries
technical paper 334, Rome: FAO.
Huss, H.H. (1995). Quality and quality changes in fresh fish.
FAO
Fisheries Technical Paper – 348. Food and agriculture
organization
of the United Nations, http://www.fao.org/docrep/V7180E/
V7180e09.htm.
Hwang, H.I. & Hau, L.B. (1995). Effect of ionizing radiation on
the
enzyme activities and ultrastructural changes of poultry.
Radiation
Physics and Chemistry, 46, 713–716.
ICGFI (1999). Facts about food irradiation. International
Consulta-
tive Group on Food Irradiation. Joint FAO ⁄ IAEA Division of
Nuclear Techniques in Food and Agriculture. International
Atomic
Energy Agency.
http://www.iaea.org/Publications/Booklets/foodir-
radiation.pdf. Visited on January 2012.
ICMSF (1983). Microorganismos de los alimentos. Técnicas de
análisis
microbiológico. Ed. Spain: Acribia.
Josephson, E.S., Thomas, M.H. & Calhoun, W.K. (1978).
Nutritional
aspects of food irradiation: an overview. Journal of Food
Processing
and Preservation, 2, 299–313.
Kanatt, S.R., Chawla, S.P., Chander, R. & Sharma, A. (2006).
Development of shelf-stable, ready-to-eat (RTE) shrimps
(Penaeus
indicus) using gamma irradiation as one of the hurdles. LWT –
Food
Science and Technology, 39, 621–626.
Kilcast, D. (1995). Food irradiation: current problems and
Future
Potential. International Biodeterioration & Biodegradation, 36,
279–
296.
Kim, Y.H., Nam, K.C. & Ahn, D.U. (2002). Volatile profiles,
lipid
oxidation and sensory characteristics of irradiated meat from
different animal species. Meat Science, 61, 257–265.
Gamma radiation effect on quality changes A. Tomac and M. I.
Yeannes1556
International Journal of Food Science and Technology 2012 �
2012 The Authors
International Journal of Food Science and Technology � 2012
Institute of Food Science and Technology
Knipe, L. 2004. Use of phosphates in meat products. Presented
in the
Meat Industry Research Conference. October 2nd. Nashville.
TN:
http://scholar.google.com.ar/scholar_url?hl=es&q=http://www3.
unileon.es/personal/wwdhtjmo/MANDEFEC/docencia/Doccarne/
usodefosfatos.doc&sa=X&scisig=AAGBfm3gU7ZXN3oe8uYNt
WHvh7MN71cZxw&oi=schol. Visited on February 2011.
Kodo, J.-L. (1990). L‘ionisation des produits de la pêche.
Collection
« Valorisation des produits de la mer » ISSN: 0998-4089. ISBN
2905434260. Ifremer. http://archimer.ifremer.fr/doc/00000/649/.
Visited on January 2011.
Lakshmanan, R., Venugopal, V., Venketashvaran, K. &
Bongirwar,
D.R. (1999). Bulk preservation of small pelagic fish by gamma
irradiation: studies on a model storage system using Anchovies.
Food Research International, 32, 707–713.
Lampila, L.E. 1993. Polyphosphates: rationale for use and
function-
ality in seafood and seafood products. In: Proceedings of the
18th
annual tropical and subtropical fisheries technological
conference of
the Americas. Pp. 13–20). VA, USA.
Lapa-Guimarâes, J., Acevedo da Silva, M.A., Eduardo de
Felicio, P. &
Contreras Guzmán, E. (2002). Sensory, colour and
psychrotrophic
analyses of squids (Loligo plei) during storage in ice. LWT –
Food
Science and Technology, 35, 21–29.
Lescano, G., Kairiyama, E., Narvaiz, P. & Kaupert, N. (1990).
Studies
on quality of radurized (Refrigerated) and non-radurized
(frozen)
Hake (Merluccius merluccius hubbsi). LWT - Food Science and
Technology, 23, 317–321.
Melaj, M.A., Sánchez-Pascua, G.L., Casales, M.R. & Yeannes,
M.I.
(1997). Aspectos a considerar en la evaluación de la frescura
del
calamar (Illex argentinus). Alimentaria Mayo, 97, 93–96.
MINAGRI. (2007). Ministerio de Agricultura, Ganaderı́a y
Pesca.
Subsecretarı́a de Pesca y Acuicultura Pesquerı́as de Calamar y
Langostino. Situación actual. Presidencia de la Nación.
Argentina.
Moragas Encuentra, M. & De Pablo Busto, M.B.(1991).
Recopilación
de normas microbiológicas de los alimentos y asimilados y otros
parámetros fı́sico-quı́micos de interés sanitario. Actualized on
January 2008. BOE 15 ⁄ 08 ⁄ 91.
Paarup, T., Sanchez, J.A., Moral, A., Christensen, H., Bisgaard,
M. &
Gram, L. (2002a). ensory, chemical and bacteriological changes
during storage of iced squid (Todaropsis eblanae). Journal of
Applied
Microbiology, 92, 941–950.
Paarup, T., Sanchez, J.A., Peláez, C. & Moral, A. (2002b).
Sensory,
chemical and bacteriological changes in vacuum-packed
pressurised
squid mantle (Todaropsis eblanae) stored at 4�C. International
Journal of Food Microbiology, 74, 1–12.
Pascual, A. & del Rosario, M. (2000). Microbiologı́a
alimentaria:
metodologı́a analı́tica para alimentos y bebidas. Ed. Madrid.
Spain:
Dı́az de Santos, ISBN: 978-84-7978-424-9.
R Development Core Team (2008). R: a language and
environment for
statistical computing. Vienna, Austria: R Foundation for
Statistical
Computing, ISBN 3-900051-07-0, URL http://www.R-
project.org.
Sommers, C.H. & Fan, X. (2006). Food Irradiation Research and
Technology. IFT Press: Blackwell Publishing.
Sugiyama, M., Kòusu, S., Hanabe, M. & Okuda, Y. (1989).
Utilization
of Squid. A. Balkema ⁄ roterdam. ISBN 90 6191 479 5.
Sungsri-In, R., Benjakul, S. & Kijroongrojana, K. (2011). Pink
discoloration and quality changes of squid (Loligo formosana)
during iced storage. LWT – Food Science and Technology, 44,
206–
213.
Thanonkaew, A., Benjakul, Z., Visessanguan, W. & Decker,
E.A.
(2006). Development of yellow pigmentation in squid (Loligo
peali)
as a result of lipid oxidation. Journal of Agricultural and Food
Chemistry, 54, 956–962.
Vaz-Pires, P., Seixas, P., Mota, M. et al. (2008). ensory,
microbiolog-
ical, physical and chemical properties of cuttlefish (Sepia
officinalis)
and broadtail shortfin squid (Illex condecti) stored in ice. LWT-
Food
Science and Technology, 41, 1655–1664.
Venugopal, V., Doke, S.N. & Thomas, P. (1999). Radiation
processing
to improve the quality of fishery products. Critical Reviews in
Food
Science and Nutrition, 39, 391–440.
WHO. (1994). In Safety and nutritional adequacy of irradiated
food. pp.
81–107. Geneva, Switzerland: World Health Organization.
WHO (1999). High-dose irradiation: Wholesomeness of food
irradiated
with doses above 10 kGy. Geneva: WHO Technical Report
Series
890.
Woyewoda, A.D. & Ke, P.J. (1980). Laboratory quality
assessment of
Canadian Atlantic Squid (Illex illecebrosus) Fisheries and
Marine
Service Technical Report No 902. Department of Fisheries and
Oceans Field Services Branch, Inspection Division Research
Sec-
tion, Halifax Nova Scotia, B3J 2S7.
Gamma radiation effect on quality changes A. Tomac and M. I.
Yeannes 1557
� 2012 The Authors International Journal of Food Science and
Technology 2012
International Journal of Food Science and Technology � 2012
Institute of Food Science and Technology
Innovative Food Science and Emerging Technologies 27 (2015)
48–56
Contents lists available at ScienceDirect
Innovative Food Science and Emerging Technologies
journal homepage: www.elsevier.com/locate/ifset
The effect of thermal pasteurization and high pressure
processing at cold
and mild temperatures on the chemical composition, microbial
and
enzyme activity in strawberry purée
Krystian Marszałek a,⁎, Marta Mitek b, Sylwia Skąpska a
a Department of Fruit and Vegetable Product Technology, Prof.
Wacław Dąbrowski Institute of Agricultural and Food
Biotechnology, 36 Rakowiecka str., 02532 Warsaw, Poland
b Division of Fruit and Vegetable Technology, Department of
Food Technology, Faculty of Food Science, Warsaw University
of Life Science, 161 Nowoursynowska str., 02787 Warsaw,
Poland
⁎ Corresponding author.
E-mail address: [email protected] (K. Marsz
http://dx.doi.org/10.1016/j.ifset.2014.10.009
1466-8564/© 2014 Elsevier Ltd. All rights reserved.
a b s t r a c t
a r t i c l e i n f o
Article history:
Received 15 July 2014
Accepted 21 October 2014
Available online 5 November 2014
Editor Proof Recieve Date 17 November 2014
Keywords:
High pressure processing
Thermal processing
Strawberries
Polyphenols
Polyphenol oxidase
Peroxidase
The impact of high pressure processing (HPP) at 300 or 500
MPa for 1, 5 or 15 min at 0 or 50 °C and thermal pro-
cessing (TP) at 90 °C for 15 min on the quality of strawberry
purée was studied. TP caused the highest degrada-
tion of polyphenols (14%), anthocyanins (43%), vitamin C
(61%) and color (dE N 3) but only this method
effectively decreased the activity of polyphenol oxidase — PPO
(97.7%), peroxidase — POD (99.5%) and microor-
ganism count (b1 log cfu/g). The highest decrease of the
mentioned nutrients (4%, 14%, 30%, respectively) in
HPP-treated samples was noticed at 500 MPa/15 min/50 °C,
whereas color changes were unnoticeable
(dE b 3) and enzymes were inactivated only in 72% (PPO) and
50% (POD). Counts of yeasts and molds were re-
duced to b1 log cfu/g only after TP and HPP at 500 MPa. HPP
preservation at 0 °C affects the content of nutrients
and color to the least extent.
Industrial relevance: This study demonstrated that the
nutritional and sensory qualities of strawberry purée after
high pressure processing were much better than after thermal
pasteurization. Purée treated with HPP at 0 °C did
not show significant difference compared to fresh strawberry
purée. Greater inactivation of PPO and POD was ob-
served after thermal pasteurization, but this treatment caused
also slightly more degradation of anthocyanins, vi-
tamin C and sensory quality. The results showed that HPP might
be a useful method for preservation of
strawberry products. However, considering the residual enzyme
activity, it will be a very important point to
check the stability of the products during storage.
© 2014 Elsevier Ltd. All rights reserved.
1. Introduction
In recent years, there has been a significant increase in
consumer in-
terest in the quality and safety of foods (Boero, 2011; Wilke,
Raab,
Breuer, Hamer, & Peterson, 2013). Nowadays consumers
demand top-
quality food, which is safe to eat and which promotes bodily
health
and well-being. High quality food is usually associated with,
e.g., its nat-
uralness and freshness (Bigliardi & Galati, 2013; Farahani,
Grunow, &
Günther, 2012; Khan, Grigor, Winger, & Win, 2013). Many
fruit and veg-
etable products available on the market are however, highly-
processed,
such as clear juices, nectars, jams and preserves. The high
temperature
used for their processing and preservation (pasteurization,
sterilization,
blanching) results in undesirable changes in their organoleptic
features
(flavor, color, texture) and often in considerable losses in their
valuable
bio-active components, such as vitamin C and polyphenols,
including
anthocyanin pigments (Kalisz, Oszmiański, Hałdyszowski, &
Mitek,
2013; Tiwari, O'Donnell, & Cullen, 2009; Verbeyst, Bogaerts,
Plancken,
ałek).
Hendrickx, & Loey, 2013; Verbeyst, Oey, Plancken, Hendrickx,
& Loey,
2010).
Therefore, there is a growing interest in developing innovative,
non-
thermal methods of preserving fruit and vegetable products,
such as
high pressure processing (HPP), which can ensure product
safety,
with limited impact on the nutritional and organoleptic quality
of the
raw material used.
An important factor, which should be taken into consideration
when
preserving fruit products with HPP, is the process temperature.
High
pressure coupled with elevated processing temperatures of over
20 °C
could have a negative effect on the content of anthocyanin
pigments,
whereas treatment at less than 20 °C usually has no significant
impact
on their level (Corrales, Toepfl, Butz, Knorr, & Tauscher, 2008;
Garcia-Palazon, Suthanthangjai, Kajda, & Zabetakis, 2004). The
color of
fruit products preserved using HPP without heating often seems
even
more intense, and therefore more attractive, due to the
extraction of an-
thocyanins and flavonols from the tissues to intercellular juice
(Marigheto, Vial, Wright, & Hills, 2004; Otero & Prestamo,
2009). It
seems interesting that cold high pressure processing (at ca. 0
°C)
could be more effective for the inactivation of bacterial spores
compared
with the same process at room temperature. Generally, lower
http://crossmark.crossref.org/dialog/?doi=10.1016/j.ifset.2014.1
0.009&domain=pdf
http://dx.doi.org/10.1016/j.ifset.2014.10.009
mailto:[email protected]
http://dx.doi.org/10.1016/j.ifset.2014.10.009
http://www.sciencedirect.com/science/journal/14668564
49K. Marszałek et al. / Innovative Food Science and Emerging
Technologies 27 (2015) 48–56
temperatures raise the costs of the process but cause fewer
changes in
the chemical composition of foods (Heinz & Buckow, 2009).
Strawberries are considered a fruit with special health-
promoting
properties, because they contain many valuable antioxidants,
e.g., vitamin C and polyphenols (anthocyanins and phenolic
acids).
The preventive role of polyphenols has already been proved
against,
e.g., cancer, cardiovascular diseases, arthritis or type 2 diabetes
(Blumberg, 2003; Kaur & Kapoor, 2001; Terefe et al., 2013). A
particular-
ly valuable compound in strawberries, with proven anticancer
proper-
ties, is ellagic acid (Seeram, Lee, Scheller, & Heber, 2004).
Ellagic acid
is present both in the flesh and seeds (Klimczak, Rozpara, &
Król,
2011), therefore strawberry products, e.g. purée, obtained using
waste-free technology, have a full range of the bioactive
compounds
present in the fruits. Pelargonidin-3-glucoside, the main
strawberry an-
thocyanin, as well as other phenolics and vitamin C are
thermolabile
compounds (Terefe, Matthies, Simons, & Versteeg, 2009), so
the use of
non-thermal methods for preserving strawberry products is
particularly
reasonable.
The results of studies on the influence of HPP on strawberry
poly-
phenols reported by different authors are inconsistent. Ferrari,
Marcesca, and Ciccarone (2011) and Patras, Brunton, Pieve, and
Butler
(2009) reported that polyphenol levels in pressure-treated
strawberry
purée increased significantly, Terefe et al. (2013) observed a
significant
decrease in these compounds, while Cao et al. (2011) claimed
that it
showed no significant effect. Our preliminary studies with
juices and
nectars from ‘Senga Sengana’ strawberries – the popular
cultivar in
Poland – showed that the commercially used parameters for
HPP, 300
and 500 MPa at mild temperature, caused a small decrease in
the poly-
phenol content and color parameters of the products (Marszałek,
Mitek,
& Skąpska, 2011).
The inactivation of enzymes is of key significance to the
storage sta-
bility of HPP-preserved strawberry products. Terefe, Yang,
Knoerzer,
Buckow, and Versteeg (2010) showed that neither thermal
processing
nor combined HPP–heat treatment could effectively inactivate
polyphe-
nol oxidase (PPO) and peroxidase (POD) in strawberry purée,
even at
90 °C. Other authors showed that optimal inactivation (25%) of
straw-
berry POD was achieved using 230 MPa and 43 °C, and the best
results
in PPO inactivation (60%) were observed at 250 MPa. Some
activation
was observed for treatment carried out in 250–400 MPa for both
en-
zymes (Cano, Hernandez, & De Ancos, 1997). Cao et al. (2011)
reported
a 51.5 and 56.5% reduction in PPO and POD activity
respectively in
strawberry pulp after 600 MPa and 25 min at room temperature.
The studies presented on the use of HPP as a means of
preserving
strawberry products were based on a different matrix —
different
kinds of products, obtained with different fruit varieties, e.g.
‘Festival’,
‘Aroma’, ‘Elsanta’, ‘Pajaro’, ‘Camarosa’ and ‘Rubygem’.
Therefore quality
indicators are difficult to compare. As can be concluded from
this re-
view, there is no data available on the preservation of
strawberry prod-
ucts with HPP at near-zero temperatures and the reported effects
of HPP
at mild and high temperatures on the quality of strawberry
products are
ambiguous. Therefore the purpose of this study was to evaluate
the im-
pact of HPP at low and mild temperatures on the overall quality
of
strawberry purée, including the inactivation of native microflora
and
enzymes (PPO and POD), changes in the total and individual
phenolic
compounds and vitamin C content, as well as color parameters
and
the sensory quality.
2. Materials and methods
2.1. Production of strawberry purée
Strawberries, cv. ‘Senga Sengana’ cultivar, were harvested at
the end
of June 2010 and pre-treated (washing, destalking, freezing) at
“Ulmer”
Sp.j. company (Stare Zadybie, Poland). After freezing in a
fluidization
tunnel (UniDex, Poland), the strawberries were sorted (Niagara
Sortex,
Bühler, Switzerland) according to color and size (45–55 mm)
and stored
at −24 °C. After defrosting (at 4 °C), they were mashed up in a
food
processor (CL-30, Robot Coupe, France). The resultant semi-
liquid
strawberry pulp was homogenized (Mz-50, Fryma, Switzerland,
Ø ≤ 0.5 mm) and deaerated at 0.06 MPa (LVE, Fryma,
Switzerland).
The product temperature did not exceed 0 °C throughout the
whole
processing procedure. This strawberry purée was used as a
control sam-
ple (CS).
2.2. Preservation of strawberry purée
2.2.1. High hydrostatic pressures (HPP)
Samples were preserved in a pressure chamber (ca. 1500 mL in
vol-
ume and 110 mm in diameter, Izopress, Moscow, Russia), filled
with a
water/propylene glycol mixture (50:50, v/v) and equipped with
a
heating/cooling jacket (operating temperature range of 0–50
°C). Pres-
sure inside the chamber was measured directly with a
manometer with
a pressure transducer (type EBM 6045-700, KGT Kramer). The
pressure
and temperature parameters were registered using a
thermocouple and
manometer located in the pressure medium and processed via a
data
collection computer system (Memory Card MMC, Metronic
System
MPI-L version 1.11., Kraków, Poland). Strawberry purée was
processed
in low density polyethylene bottles (PE-LD, 50 mL), without
access to
air. The process was run using various parameters, i.e.,
pressure: 300
or 500 MPa; time of sample exposure to pressure: 1, 5 or 15
min; and
temperature: 0 or 50 °C (omitting 500 MPa, 5 min at 50 °C).
Pressure
of up to each 100 MPa was generated in 3 s; the release time
was 1 s
for each 100 MPa. The temperature increase during
pressurization mea-
sured in the chamber, was 2 °C for each 100 MPa.
2.2.2. Pasteurization (TP)
The purée was pasteurized in 100-mL glass jars in a stainless
steel,
gas-heated bath pasteurizer. Process parameters of 90 °C for 15
min as-
sured the microbial stability of the purée (Marszałek et al.,
2011). The
time and temperature data were recorded with a monitoring–
measur-
ing device (9004, Ellab, Denmark) designed for measuring the
temper-
ature inside a package and of the heating medium during the
course of
the process.
2.3. Chemical reagents
The following standards were used in the study: p-
hydroxybenzoic
acid (p-HBA), ellagic acid (EA), quercetin (Q), kaempferol (K),
pelargonidin-3-glucoside (Pg-3-Glc) and cyanidin-3-glucoside
(Cy-3-
Glc) of HPLC purity (Extrasynthese, France), L-ascorbic acid
(AA) of
HPLC purity (Supelco, USA), DL-dithiothreitol (DTT) (N99%)
and polyvi-
nylpyrrolidone (PVPP) (~110 μm) (Fluka, USA), catechol
(N99%), gallic
acid (GA) (N98%), hydrogen peroxide (30%), Triton X-100, and
Trolox
(N97%) (Sigma Aldrich, USA). The remaining reagents were
purchased
from POCh (Warsaw, Poland). Demineralized water used for the
analy-
ses was purified using a Direct-Q 3 apparatus (Millipore, USA).
2.4. Analyses
2.4.1. Total content of polyphenols (TCP)
Strawberry purée (10 g) was extracted for 5 min in an
ultrasound
bath (40 kHz, 100 W, 25 °C, ITR, Poland) using 30 g of an
extraction mix-
ture: methanol/water/hydrochloric acid (80:19.9:0.1; v/v/v) in
centri-
fuge flasks. Afterwards, the sample was centrifuged in a
laboratory
centrifuge (MPW-350R, MPW Med. Instruments, Poland) at
3670 g
and 4 °C for 5 min. Extraction was repeated five times,
supernatants
were combined and the methanol was evaporated under vacuum
(B-
481, Büchi, Switzerland). The residue was transferred
quantitatively to
a volumetric flask and filled up to 50 mL with 0.1% (v/v) o-
phosphoric
acid.
The total content of polyphenols was determined using the
Folin–
Ciocalteu method modified by Gao, Ohlander, Jeppson, Bjork,
and
50 K. Marszałek et al. / Innovative Food Science and Emerging
Technologies 27 (2015) 48–56
Trajkovski (2000). The absorbance of the mixture was measured
spec-
trophotometrically (UV-1650PC, Shimadzu, Japan) at 765 nm.
The
total content of polyphenols was expressed in milligrams of
gallic acid
equivalent per 100 g of fresh weight of the purée (mg GAE/100
g FW).
2.4.2. HPLC analysis of anthocyanins
The HPLC determination of the anthocyanin content was carried
out
using the method described by Goiffon, Mouly, and Gaydou
(1999),
with modifications consisting of changing the isocratic elution
into gra-
dient elution, and shortening the analysis time to 22 min. Ten
milliliters
of the extract (Subsection 2.4.1) was absorbed and purified on
Sep-Pak
C18 minicolumns (Waters, USA). Anthocyanins were eluted
with 5 mL of
a methanol/water/hydrochloric acid mixture (75:24.9:0.1;
v/v/v), and
then filtered on PTFE filters with a pore size of 0.45 μm
(Waters, USA).
The analysis of the anthocyanins in the HPLC system equipped
with a
DAD SPD-10Avp detector, thermostat CTD-10AsVp and
DEGASEX™
DG-4400 degasser (Shimadzu, Japan) was carried out on a
reversed-
phase Luna C18 column (250 × 4.6 mm, 5 μm, Phenomenex,
USA) at a
temperature of 25 °C, flow rate of 1 mL/min and detection at
520 nm.
A water/formic acid mixture (89:11, v/v) and acetonitrile were
used
as eluents (A and B, respectively) in the following program: 9%
B
(15 min), from 9 to 20% B (1 min), from 20 to 30% B (1 min),
from 30
to 9% B (2 min), and 9% B (4 min). Monomers of the
anthocyanins
were identified by comparing their retention times with those of
the
standards and with data from literature. Cy-3-Glc and Pg-3-Glc
contents
were calculated based on their standard calibration curves
results. Pg-3-
Rut was expressed as Pg-3-Glc. All results were expressed in
milligrams
per 100 g of fresh weight (mg/100 g FW).
2.4.3. HPLC analysis of phenolic acids and flavonols
Phenolic compounds were determined according to a modified
method of Odriozola-Serrano, Soliva-Fortuny, and Martin-
Belloso
(2008). To determine the contents of p-hydroxybenzoic acid (p-
HBA),
ellagic acid (EA), quercetin (Q) and kaempferol (K), acidic
hydrolysis
was conducted with the method used by Da Silva Pinto, Lajolo,
and
Genovese (2008). Forty milliliters of a methanol/6 M
hydrochloric
acid/water mixture (56:25:19; v/v/v) was added to 1 mL of the
extract
(Subsection 2.4.1). The sample was heated at 120 °C for 90 min,
then
cooled and neutralized with 6 M NaCl to pH ca. 3.5.
Analyses were carried out in a gradient system using the
equipment
described in Subsection 2.4.2 at 30 °C, flow rate of 1 mL/min
and detec-
tion at 260 nm (phenolic acids) and 360 nm (flavonols). The
water/
formic acid mixture (99:11, v/v) and acetonitrile were used as
eluents
(eluents A and B, respectively) in the following gradient
program: 10%
B (10 min), from 10 to 45% B (15 min), from 45 to 70% B (5
min),
from 70 to 10% B (3 min), and 10% B (4 min). Selected
phenolic com-
pounds were quantified using external p-HBA, EA, Q and K
calibration
curves. The contents of all compounds were expressed in
milligrams
per 100 g of fresh weight (mg/100 g FW). Peak identities were
as recent-
ly described by Odriozola-Serrano et al. (2008).
2.4.4. HPLC analysis of AA and DHAA
The total vitamin C content, expressed as L-ascorbic acid (AA)
and L-
dehydroascorbic acid (DHAA), was determined as described by
Odriozola-Serrano, Harnandes-Jover, and Martin-Belloso
(2007). Ap-
proximately 1 g of purée was transferred to a volumetric flask
and filled
up to 10 mL with 0.01% of m-phosphoric acid. The extract was
then fil-
tered through PTFE 0.45-μm filters. In order to assay DHAA, it
was re-
duced to AA with 0.1% DL-dithiothreitol (DTT) using 1 mL of
the
following mixture: extract/DTT (50:50; v/v) and leaving it in
the dark
for 1 h. The content of DHAA was calculated using the formula:
DHAA = (AA + DHAA) − AA.
The HPLC analysis (2695, Waters, USA) was carried out using
a
reversed-phase SunFire C18 column (250 × 4.6 mm, 5 μm,
Waters,
USA) and a photodiode detector (DAD) (2996, Waters, USA).
The anal-
ysis was conducted with the isocratic method using 0.01% m-
phosphoric acid at a flow rate of 1 mL/min and column
temperature
of 25 °C. AA was quantified using external calibration curves.
The con-
tents of AA and DHAA were expressed in milligrams of AA per
100 g
of fresh weight (mg AA/100 g FW). Peak identities were as
recently de-
scribed by Odriozola-Serrano et al. (2007).
2.4.5. Changes in color parameters
The color of the strawberry purée was determined using a CM-
3600d colorimeter (Konica Minolta, Japan), in glass cuvettes
with an op-
tical path of 10 mm. The measurement was made on the
CIEL*a*b* sys-
tem, using illuminant D65. Values of L*, a*, and b* parameters
enabled
calculating the absolute difference of the samples' color after
preserva-
tion compared to the control sample, using the following
equation:
ΔE = [(ΔL*)2 + (Δa*)2 + (Δb*)2]1/2, where L*
(lightness/darkness),
a* (red/green), and b* (yellow/blue).
2.4.6. Determination of PPO and POD activities
The activity of selected tissue enzymes was determined as
described
by Terefe et al. (2010). The extraction mixture comprised 0.2 M
phos-
phate buffer (pH = 6.5) containing 4% (w/v)
polyvinylpyrrolidone
(PVPP), 1% (v/v) Thriton X-100 and 1 M NaCl. The strawberry
purée
and the mixture (4.5: 4.5 g, w/w) were treated with ultrasound
(40 kHz, 100 W, 25 °C, ITR, Poland) for 3 min and centrifuged
(MPW-
350R, MPW Med. Instruments, Poland) at 17,700 g for 30 min
at 4 °C.
The supernatant, after filtration through blotting filter paper,
was used
to determine PPO and POD activities.
For PPO activity assay, 100 μL of the supernatant was
introduced into
3 mL of 0.05 M phosphate buffer (pH 6.5) containing 0.07 M
catechol,
and the absorbance was measured spectrophotometrically (UV-
1650PC, Shimadzu, Japan) at λ = 420 nm and 25 °C for 10 min.
A
blank sample was prepared in the same way, by substituting the
super-
natant with a phosphate buffer. The PPO activity was expressed
as a
change in absorbance/min/g of fresh weight of the analyzed
sample.
For the POD activity assay, 1.5 mL of 0.05 M phosphate buffer
(pH =
6.5) was added to 200 μL of the supernatant, 200 μL of 0.05 M
phosphate
buffer containing 1% p-phenylenediamine (w/v) and 200 μL of
1.5%
(v/v) hydrogen peroxide. Mixture absorbance was measured at λ
=
485 nm and 25 °C for 10 min. The POD activity was expressed
as a
change in absorbance/min/g of fresh weight of the analyzed
sample.
2.4.7. Microbiological analyses
Yeasts and molds were analyzed according to the ISO 21527-
1:2008
standard. Purée samples were diluted with sterile normal saline
(0.85%
sodium chloride), spread plated on sterile nutrient agar plates
(PCA)
and incubated at 25 °C for 5 to 7 days. The total microbial
count
(TMC) was determined according to the EN ISO 4833: 2003
standard.
Samples diluted with sterile normal saline were plated on DRBC
plating
medium; plates were incubated at 30 °C for 72 h. All the
experiments
were conducted in duplicates and mean values of log 10 cfu/g
sample
have been reported.
2.4.8. Sensory analysis
The sensory analysis of strawberry products was conducted as
de-
scribed in ISO 4121:1998. A 6-point scale was used to evaluate:
color,
appearance, consistency, aroma and taste, and an overall quality
assess-
ment was conducted using a 9-point hedonic scale; assessments
were
made by a trained sensory panel (eight persons). All samples
were eval-
uated independently in a test room complying with the
requirements of
ISO 8589:2007.
2.4.9. Statistical analysis
All analyses were conducted using Statistica 10 StatSoft®
software.
The significance of differences was computed based on an
analysis of
the variance with Tukey's test (p-value b 0.05), and the impact
of HPP
on the quality of strawberry purée was assessed based on a
cluster
Ta
b
le
1
C
on
te
n
ts
of
fr
ee
p
h
en
ol
ic
ac
id
s
an
d
fl
av
on
ol
s
an
d
th
ei
r
to
ta
lc
on
te
n
t
in
co
n
tr
ol
sa
m
p
le
an
d
in
TP
an
d
H
PP
-p
re
se
rv
ed
st
ra
w
b
er
ry
p
u
ré
e
(m
g/
10
0
g
FW
).
T
(°
C
)
P
(M
P
a)
t
(m
in
)
B
ef
o
re
h
yd
ro
ly
si
s
(f
re
e
co
m
p
o
u
n
d
s)
A
ft
er
h
yd
ro
ly
si
s
(t
o
ta
l
co
n
te
n
t)
TC
P
P
h
en
o
li
c
ac
id
s
Fl
av
o
n
o
ls
P
h
en
o
li
c
ac
id
s
Fl
av
o
n
o
ls
p
-H
B
A
E
A
Q
K
p
-H
B
A
E
A
Q
K
C
S
0
.1
–
n
d
2
.1
1
±
0
1
6
cd
1
.2
6
±
0
.0
2
f
0
.0
9
±
0
.0
1
d
e
1
.1
9
±
0
.0
2
b
3
3
.5
4
±
3
.6
5
d
e
6
.2
3
±
0
.6
8
e
f
2
.7
5
±
0
.1
6
a
b
c
2
2
1
.0
3
±
3
.3
3
a
b
TP
9
0
0
.1
1
5
n
d
5
.1
0
±
0
.4
8
a
1
.6
4
±
0
.0
5
a
0
.1
0
±
0
.0
1
cd
1
.8
5
±
0
.0
8
a
4
3
.7
7
±
2
.5
1
a
9
.6
1
±
0
.4
6
b
3
.0
4
±
0
.2
5
a
1
9
0
.5
5
±
3
.5
9
e
H
P
P
0
3
0
0
1
n
d
2
.3
0
±
0
.1
5
c
1
.3
4
±
0
.0
7
d
e
f
0
.1
0
±
0
.0
1
cd
1
.0
9
±
0
.0
5
b
3
5
.6
0
±
3
.3
8
cd
e
7
.8
3
±
0
.3
7
cd
2
.8
8
±
0
.0
5
a
b
2
2
1
.1
3
±
3
.9
1
a
b
5
n
d
2
.0
1
±
0
.0
5
cd
1
.3
5
±
0
.0
5
d
e
f
0
.0
8
±
0
.0
2
d
e
1
.2
6
±
0
.0
8
b
3
2
.0
8
±
2
.7
3
e
6
.4
8
±
0
.4
4
e
f
2
.8
7
±
0
.0
5
a
b
2
2
2
.1
3
±
1
.5
2
a
1
5
n
d
2
.1
2
±
0
.1
1
cd
1
.3
6
±
0
.0
5
cd
e
f
0
.1
0
±
0
.0
1
cd
1
.2
4
±
0
.0
8
b
3
4
.4
7
±
2
.1
5
cd
e
6
.9
1
±
0
.5
7
d
e
2
.8
7
±
0
.0
4
a
b
2
2
1
.3
1
±
1
.5
2
a
b
5
0
0
1
n
d
1
.7
8
±
0
.2
0
d
1
.2
8
±
0
.1
3
d
e
f
0
.0
7
±
0
.0
1
e
1
.2
1
±
0
.0
2
b
3
2
.0
8
±
1
.9
7
e
6
.8
3
±
0
.7
3
d
e
2
.5
0
±
0
.2
2
cd
2
1
8
.4
5
±
0
.5
6
a
b
5
n
d
1
.9
7
±
0
.2
2
cd
1
.4
0
±
0
.1
0
cd
e
f
0
.0
7
±
0
.0
1
e
1
.1
0
±
0
.0
9
b
3
4
.5
4
±
2
.7
7
cd
e
6
.7
8
±
0
.7
6
d
e
2
.7
2
±
0
.1
4
a
b
c
2
1
7
.3
5
±
4
.3
8
b
c
1
5
n
d
1
.9
0
±
0
.1
4
cd
1
.2
6
±
0
.1
8
e
f
0
.0
8
±
0
.0
1
d
e
1
.2
3
±
0
.1
3
b
3
3
.3
4
±
2
.7
2
d
e
5
.2
9
±
0
.2
3
f
2
.7
1
±
0
.0
5
a
b
c
2
2
0
.6
6
±
0
.8
3
a
b
5
0
3
0
0
1
n
d
3
.2
4
±
0
.1
8
b
1
.4
7
±
0
.1
2
b
cd
e
0
.0
9
±
0
.0
2
cd
1
.8
9
±
0
.2
3
a
4
3
.0
8
±
5
.0
8
a
b
7
.0
3
±
1
.2
2
d
e
1
.8
5
±
0
.3
2
e
2
1
9
.9
3
±
2
.5
1
a
b
5
n
d
3
.4
1
±
0
.3
0
b
1
.5
9
±
0
.1
9
a
b
0
.1
1
±
0
.0
1
b
c
2
.0
0
±
0
.1
7
a
4
1
.7
0
±
2
.2
8
a
b
1
1
.0
7
±
1
.3
6
a
2
.2
3
±
0
.1
7
d
2
1
8
.5
5
±
3
.6
8
a
b
1
5
n
d
3
.3
5
±
0
.2
1
b
1
.4
8
±
0
.1
7
a
b
cd
0
.1
3
±
0
.0
2
a
1
.9
2
±
0
.3
1
a
4
1
.4
7
±
2
.6
8
a
b
9
.3
4
±
1
.2
2
b
2
.2
1
±
0
.3
2
d
2
1
2
.1
0
±
1
.4
4
d
5
0
0
1
n
d
3
.3
5
±
0
.3
6
b
1
.4
7
±
0
.1
5
a
b
cd
0
.1
2
±
0
.0
3
a
b
1
.8
9
±
0
.1
9
a
3
8
.2
9
±
3
.8
7
b
cd
8
.8
5
±
0
.9
9
b
c
2
.6
0
±
0
.1
6
b
c
2
2
1
.4
9
±
1
.5
4
a
b
1
5
n
d
3
.4
8
±
0
.2
9
b
1
.5
6
±
0
.1
2
a
b
c
0
.0
9
±
0
.0
2
cd
1
.8
2
±
0
.1
1
a
3
9
.4
3
±
2
.9
4
a
b
c
9
.2
5
±
0
.2
8
b
2
.4
4
±
0
.3
4
cd
2
1
3
.3
9
±
2
.0
4
cd
D
at
a
re
p
re
se
n
t
m
ea
n
s
±
SD
(n
=
3
);
FW
:
fr
es
h
w
ei
gh
t;
p
-H
B
A
:
p
-h
yd
ro
xy
b
en
zo
ic
ac
id
;
EA
:
el
la
gi
c
ac
id
;
Q
:
q
u
er
ce
ti
n
;
K
:
ka
em
p
fe
ro
l,
TC
P:
to
ta
lc
on
te
n
t
of
p
ol
yp
h
en
ol
s,
n
d
:
n
ot
d
et
ec
te
d
;
C
S:
co
n
tr
ol
sa
m
p
le
;
TP
:
th
er
m
al
p
as
te
u
ri
za
ti
on
;
H
PP
:
h
ig
h
p
re
ss
u
re
p
ro
ce
ss
in
g.
M
ea
n
va
lu
es
d
en
ot
ed
w
it
h
th
e
sa
m
e
le
tt
er
s
d
o
n
ot
d
if
fe
r
si
gn
ifi
ca
n
tl
y
st
at
is
ti
ca
lly
,p
≤
0.
0
5
.
51K. Marszałek et al. / Innovative Food Science and Emerging
Technologies 27 (2015) 48–56
analysis in the form of tree diagrams using weighted average
linkage
and Euclidean distances.
Three independent samples subjected to simultaneous treatment
under the same conditions were analyzed in duplicate.
3. Results and discussion
3.1. Content of phenolic compounds
The TCP in the control sample (CS) was 221 mg GAE/100 g FW
(Table 1), which is consistent with the findings of other authors
(Oszmiański & Wojdyło, 2009; Oszmiański, Wojdyło, &
Matuszewski,
2007). Free p-hydroxybenzoic acid was not identified in any of
the sam-
ples, which indicates that it occurred only in the bound form.
The total
content of p-HBA (Table 1) was 1.19 mg/100 g FW and was
slightly
higher than found by Breitfellner, Solar, and Sontag (2003) and
by
Odriozola-Serrano et al. (2008), who reported 0.1–0.6 mg/100 g
FW
of this compound. The contents of free EA, Q and K in CS were
2.11,
1.26 and 0.09 mg/100 g FW, respectively. A similar content of
free EA
was determined by Amakura, Okada, Tsuji, and Tonogai (2000)
and
Pallauf, Rivas-Gonzalo, Castillo, Cano, and Pascual-Teresa
(2008). As re-
ported by Oszmiański and Wojdyło (2009), the contents of
flavonol in
strawberries may range from 0.5 to 4.0 per 100 g of fruits.
Many authors
agree that strawberries contain 0.5–7.0 times more quercetin
than
kaempferol derivatives (Breitfellner et al., 2003; Da Silva Pinto
et al.,
2008; Oszmiański et al., 2007; Pallauf et al., 2008).
During the production of concentrated strawberry juice, most of
the
ellagic acid remains in the pomace (Klimczak et al., 2011);
hence, straw-
berry purée is a very valuable source of this biologically-active
compo-
nent. Its total content in CS was 33.54 mg EA/100 g FW.
Häkkinen and
Törrönen (2000) reported that the content of ellagic acid in
straw-
berries of the ‘Senga Sengana’ variety was 39.66 mg EA/100 g
FW. Inter-
estingly, in the same strawberry cultivar, Da Silva Pinto et al.
(2008)
measured from 5.5 to 50.0 mg of ellagic acid per 100 g of
strawberries
depending on the extraction solution (acetone, methanol), the
type
and concentration of acid used for hydrolysis, and the time and
temper-
ature of the hydrolysis process. The contents of quercetin and
kaempferol increased 5 and 30 times after hydrolysis, which
indicates
that they (kaempferol in particular) occur mainly in the bound
form.
The predominant phenolic acid in strawberries is ellagic acid,
which
constitutes from 35 to 50% of the total content of phenolic acids
(Da
Silva Pinto et al., 2008; Häkkinen, Karenlampi, Mykkanen,
Heinonen,
& Torronen, 2000; Klimczak et al., 2011). In terms of levels of
this con-
stituent, strawberries are inferior only to wild strawberries,
raspberries
and pomegranate fruits (Amakura et al., 2000; Häkkinen et al.,
2000;
Törrönen, Hakkinen, Karenlampi, & Mykkanen, 1997).
Most of the studied phenolic compounds were present in the
bound
form. No free p-HBA was detected and the amount of free EA,
Q and K
was 6, 20 and 3% of their bounded form.
TP significantly increased the contents of free ellagic acid,
quercetin,
and total contents of phenolic acids and flavonols, as previously
report-
ed (Cao et al., 2011; Odriozola-Serrano et al., 2008). Purée
treated by
HPP at 0 °C showed an insignificant difference in its content of
phenolic
compounds compared to CS. HPP at 50 °C significantly
increased the
contents of free ellagic acid, quercetin and kaempferol (besides
300 MPa/1 min). The inconsistent effect of temperature on the
con-
tents of the assayed components is usually linked with the
extraction
of potentially-antioxidative compounds from fruit tissue (Cao et
al.,
2011; Patras et al., 2009). Treatment pressure and time had no
signifi-
cant effect on the levels of free phenolic acids and flavonols.
The sum of free compounds, p-hydroxybenzoic acid, ellagic
acid,
quercetin and kaempferol constituted only 1.6 to 3.7% of total
polyphe-
nols in the CS and TP-treated sample, respectively, which is in
agree-
ment with the data reported by Cao et al. (2011) The
contribution of
these polyphenols after hydrolysis in TCP was 20 and 27%
respectively,
for the CS and TP-treated sample; the most abundant compound
was
52 K. Marszałek et al. / Innovative Food Science and Emerging
Technologies 27 (2015) 48–56
EA, constituting from 15.2 to 20.5% of TCP. The contents of
studied poly-
phenols in HPP-treated samples were similar to that of CS,
especially
when treatment at 0 °C was applied.
3.2. Content of anthocyanins
As shown in Table 2, the content of Cy-3-Glc, Pg-3-Glc and Pg-
3-Rut
in the control sample (CS) was 7.81 (8.4%), 80.79 (87.2%) and
4.03
(4.4%) mg/100 g, respectively. Odriozola-Serrano et al. (2008)
reported
a similar ratio of these monomers in strawberry juices, ca.
8:88:4. Cao
et al. (2011) also found these compounds to be the most
abundant an-
thocyanins in strawberries, their concentration being as follows:
Pg-3-
Glc 23.1 mg/100 g, Pg-3-Rut 5.8 mg/100 g and Cy-3-Glc 3.7
mg/100 g,
which accounted for 71.3%, 17.9% and 11.4% of total
monomeric
anthocyanins.
The study showed a statistically significant (p-value ≤ 0.05)
effect of
the preservation temperature on the contents of all investigated
antho-
cyanin monomers (Table 2); however, the treatment pressure
and pro-
cessing time had no significant effect on their levels compared
to CS. The
content of anthocyanin monomers in TP and HPP treated
samples was
similar to the CS and reached on average ca. 8:88:4% (w/w) for
Cy-3-
Glc:Pg-3-Glc:Pg-3-Rut, respectively. The analysis of
anthocyanins dem-
onstrated losses of a total level of the analyzed pigments
compared to CS
reaching ~43, 7 and 14% in the samples treated with TP, HPP at
0 °C and
HPP at 50 °C, respectively. In other studies on the effect of
thermal pro-
cessing on anthocyanin levels in juices and strawberry purée,
the losses
ranged from 3 to 30% (Cao et al., 2011; Hartmann, Patz,
Andlauert,
Dietrich, & Ludwig, 2010; Marszałek et al., 2011; Odriozola-
Serrano
et al., 2008; Patras et al., 2009). These differences may be
caused by an-
other type of device (flow system) used by some authors, or
mild con-
ditions of the process. Pg-3-Rut appeared slightly more
susceptible to
preservation conditions than the other anthocyanins. After TP
its losses
were ca. 6% higher compared to the remaining monomers.
Losses of Pg-
3-Rut in HPP-treated strawberry purée at 50 and 0 °C were
higher com-
pared to other anthocyanin monomers by 18 and 9%,
respectively. Most
authors demonstrated, however, that Pg-3-Glc was the most
sensitive
anthocyanin in strawberries (Tiwari et al., 2009; Verbeyst,
Hendrickx,
& Loey, 2012; Verbeyst et al., 2010). The thermal stability of
anthocya-
nins also depends on the equilibrium between the three main
forms
in which they occur in the natural environment, i.e., flavylium
cations,
pseudo-bases and chalcones. Increasing the heating
temperatures dis-
turbs this equilibrium and induces the formation of colorless
chalcones,
which is accompanied by decreasing the contents of the quinoid
bases
and flavylium cations. During long-term exposure to increased
temper-
atures, the resultant chalcones are easily transformed into color
(brownish) polymers, which results in the browning of
strawberry
Table 2
Content of anthocyanins and vitamin C in control sample and
TP and HPP-preserved strawber
T (°C) P (MPa) t (min) Anthocyanins
Cy-3-Glc Pg-3-Glc Pg-3-Rut
CS – 0.1 – 7.81 ± 0.01a 80.79 ± 4.81a 4.03 ± 0.
TP 90 0.1 15 4.36 ± 0.11e 45.97 ± 1.68g 2.04 ± 0.
HPP 0 300 1 7.46 ± 0.07b 76.70 ± 2.28ab 3.23 ± 0.
5 7.74 ± 0.04a 73.69 ± 5.69bcde 3.28 ± 0.
15 7.23 ± 0.19b 76.28 ± 1.75b 3.35 ± 0.
500 1 7.25 ± 0.15b 73.85 ± 1.34bcde 3.57 ± 0.
5 7.37 ± 0.13b 75.04 ± 3.31bcd 3.60 ± 0.
15 7.35 ± 0.22b 75.17 ± 0.19bc 3.46 ± 0.
50 300 1 6.49 ± 0.11d 68.41 ± 0.54f 2.73 ± 0.
5 6.74 ± 0.34cd 71.43 ± 2.46cdef 3.03 ± 0.
15 6.84 ± 0.17c 69.79 ± 1.27ef 2.57 ± 0.
500 1 6.83 ± 0.09c 70.70 ± 0.44def 2.70 ± 0.
15 6.86 ± 0.08c 70.13 ± 1.52ef 2.80 ± 0.
Data represent means ± SD (n = 3); FW: fresh weight; Cy-3-
Glc: cyanidin-3-glucoside; Pg-3-
anthocyanins; AA: ascorbic acid; DHAA: dehydroascorbic acid;
CS: control sample; TP: therma
Mean values denoted with the same letters are not statistically
significantly different, p ≤ 0.05
products during processing and storage (Odriozola-Serrano et
al.,
2008; Özkan, 2002).
3.3. Contents of AA and DHAA
As shown in Table 2, the content of AA and DHAA in the
control
sample was 37.49 (70.2%) and 15.89 (29.8%) mg/100 g,
respectively.
These values are in the range of those previously reported by
other
authors (Hakala et al. 2003). They reported from 32.4 to 84.7
mg vi-
tamin C in six strawberry cultivars. TP significantly degraded
vitamin C
(Table 2), reducing its content by 62% compared to CS. The
level of vita-
min C (AA + DHAA) also decreased significantly in HPP-
preserved
purée, but losses reached only 15% (at 0 °C) and 16% (at 50
°C). The
AA to DHAA ratio in CS did not change significantly after TP.
However,
an increase was noted in L-dehydroascorbic acid, and a
simultaneous
decrease in L-ascorbic acid, in the HPP-preserved samples. In
strawberry
purée preserved with HPP at 50 °C, DHAA constituted 55% of
the total
vitamin C content, and in that preserved at 0 °C ~36%.
Significant differ-
ences were also determined in the contents of both forms of
vitamin C
depending on the treatment pressure and exposure time.
Considering
that DHAA is less stable and more rapidly degraded than AA,
faster ox-
idation of AA during HPP at higher temperatures may seem
undesirable.
When analyzing the quality of strawberry purée preserved with
HPP
(400–600 MPa, 15 min, 10–30 °C) and by pasteurization (70 °C,
2 min), Patras et al. (2009) reported losses of AA at 5–10%
depending
on the HPP process parameters and 22% for pasteurized purée.
Hartmann et al. (2010) showed a decrease (of 37%) in the
content of vi-
tamin C in pasteurized products (85 °C, 2 min).
3.4. Activity of PPO and POD
Enzyme activities in CS showed that POD activity (A0 POD =
1.59 OD/
min/g FW) was three times greater than PPO activity (A0 of
PPO =
0.43 OD/min/g FW). In different strawberry cultivars (‘Pajaro’,
‘Camarosa’, ‘Festival’, ‘Rubygem’, ‘Aroma’) other authors
reported from
0.27 to 2.31 OD/min/g FW and from 0.04 to 2.24 OD/min/g FW
for POD
and PPO activity, respectively (Cano et al., 1997; Terefe et al.,
2010, 2013).
Only TP led to effective inactivation of both analyzed enzymes
(Fig. 1). A significant decrease (45% on average) in PPO
activity in the
HPP-preserved strawberry purée was determined at a processing
tem-
perature of 50 °C. The higher process temperature (50 °C)
coupled
with higher pressure (500 MPa) and the longer time of its action
(15 min) were more effective in inhibiting PPO activity, with
only 28%
of its initial activity remaining. POD turned out to be more
resistant to
higher pressures than PPO. In turn, the higher temperature of
HPP pres-
ervation caused a significant decrease in POD activity of 16 to
37%.
ry purée (mg/100 g FW).
TCA Vitamin C Sum AA + DHAA
AA DHAA
71a 92.60 ± 5.49a 37.49 ± 0.77a 15.89 ± 0.72f 53.38 ± 0.95a
08f 52.36 ± 1.86g 14.93 ± 0.16j 5.55 ± 0.39h 20.48 ± 0.33i
16bcd 87.39 ± 2.19b 29.16 ± 0.19c 12.92 ± 0.74g 42.08 ± 0.65g
64bcd 84.71 ± 6.36bcd 27.09 ± 0.14d 16.36 ± 0.28f 43.45 ±
0.35f
71bc 86.86 ± 1.28b 29.36 ± 0.91c 17.63 ± 0.37e 46.99 ± 0.55cd
32ab 84.67 ± 1.70bcde 26.24 ± 0.20e 19.66 ± 0.59d 45.91 ±
0.48d
36ab 86.01 ± 3.68bc 30.91 ± 0.47b 15.34 ± 1.04f 46.26 ± 0.67d
13ab 85.98 ± 0.28bc 31.45 ± 0.62b 16.31 ± 1.48f 47.76 ± 1.94c
05de 77.63 ± 0.49f 17.49 ± 0.67i 23.96 ± 0.81c 41.45 ± 0.58g
02bcde 81.21 ± 2.82cdef 22.57 ± 0.32f 26.35 ± 0.69b 48.92 ±
0.72b
04ef 79.19 ± 1.44f 19.27 ± 0.55h 25.32 ± 1.00b 44.60 ± 0.48e
09de 80.23 ± 0.36def 17.68 ± 0.17i 32.14 ± 0.57a 49.82 ± 0.41b
07cde 79.79 ± 1.61ef 21.60 ± 0.22g 16.28 ± 0.28f 37.88 ± 0.18h
Glc: pelargonidin-3-glucoside; Pg-3-Rut: pelargonidin-3-
rutinoside; TCA: total content of
l pasteurization; HPP: high pressure processing.
.
a
g
a a a,b a,b a,b a,b
c
c,d
e
c
f
0
20
40
60
80
100
120
1 min 5 min 15 min 1 min 5 min 15 min
CS TP HPP 300 MPa HPP 500 MPa
%
re
si
du
al
a
ct
iv
ity
PPO activity0°C 50°C
a
d
a a a a a
a,bb b
b
b,c
c
1 min 5 min 15 min 1 min 5 min 15 min
CS TP HPP 300 MPa HPP 500 MPa
POD activity0°C 50°C
Fig. 1. Activity of enzymes in the control sample and in TP and
HPP-preserved strawberry purée. Data: mean ± SD (n = 3); FW:
fresh weight; CS: control sample; TP: thermal pasteur-
ization. The % residual activities ((A/A0) · 100) are presented
where A0 represents the activity of enzymes in the fresh
strawberries (A0 of PPO = 0.43 OD/min/g FW; A0 of POD =
1.59 OD/
min/g FW). Mean values denoted with the same letter do not
differ significantly statistically, p ≤ 0.05.
53K. Marszałek et al. / Innovative Food Science and Emerging
Technologies 27 (2015) 48–56
Terefe et al. (2009) obtained only a 30% reduction in PPO
activity and as
much as an 85% lower POD activity in HPP-preserved
strawberries
(600 MPa, 60 °C, 10 min). The resistance of strawberry PPO to
pressure
was also reported by Garcia-Palazon et al. (2004), who achieved
com-
plete inactivation of PPO upon pressure treatment at 800 MPa
for
10 min. These conditions were, however, insufficient to
inactivate
POD. In contrast, in the study conducted by Terefe et al. (2010),
the
PPOs in strawberry purée from two cultivars ‘Aroma’ and
‘Festival’
were found to be highly resistant to thermal inactivation at
temperature
as high as 100 °C with a maximum inactivation of 28% after a
30-min
treatment.
3.5. Changes in color
The major color of strawberry juice is a mix of red and yellow.
Thus,
Hunter a* and b* values or some combination of a* and b*
should be
considered as the physical parameters to describe the visual
color deg-
radation. But in fact, any change in a* and b* values is
associated with
a simultaneous change in the L* value, therefore representation
of qual-
ity in terms of total color may be more relevant (Rodrigo, Loey,
&
Hendrickx, 2007). Changes in food product color are best
described by
two color coefficients L* · a*/b* and ΔE. These coefficients
have already
been used by many authors studying strawberry color changes
during
processing (Rodrigo et al., 2007; Terefe et al., 2009) (Fig. 2).
The
L* · a*/b* coefficient in the control sample was 77.28 at pH
3.2.
Rodrigo et al. (2007) reported ca. 59.0 at pH 3.7 but they also
proved a
highly dependent L* · a*/b* coefficient from pH.
The L* · a*/b* coefficient increased significantly (by 4.5 units)
after TP
compared to CS. Significant changes in the L* · a*/b*
coefficient were also
determined in HPP purée at 50 °C (omitting 300 MPa at 50 °C),
but in this
e,f
a
e,f e,f
d d,e
f f
c
c
d,e,f
c
b
75
77
79
81
83
1 min 5 min 15 min 1 min 5 min 15 min
CS TP HPP 300 MPa HPP 500 MPa
L*·a*/b*0°C 50°C
Fig. 2. Color changes in TP and HPP-preserved strawberry
puree. Data: mean ± SD (n = 3); FW
the same letter do not differ significantly, p ≤ 0.05.
case these were mainly due to the increased value of the a*
parameter
from +24.12 to ca. +26, which probably resulted from the
mechanical
extraction of anthocyanin pigments from the tissue to
intercellular juice.
By contrast the a* parameter decreased to +21.77 after TP.
Similar, but
less significant changes were observed in the L* and b*
parameters. This
phenomenon was earlier described by Rodrigo et al. (2007) and
Terefe
et al. (2009) also determined increased values of color
parameters during
high pressure treatment (up to 600 MPa).
The highest value of ΔE was noted in purée after TP (ΔE = 3.0).
Slightly lesser, but statistically significant, color changes were
observed
in the samples preserved with HPP at 50 °C (ΔE = 2.3), and the
lowest
in the samples preserved at 0 °C (ΔE = 1.6). It has been shown
that, if
ΔE is lower than 1.5, changes in the sample color are
unnoticeable by in-
experienced observers (Barba, Esteve, & Frigola, 2013). Cao et
al. (2011)
reported that the ΔE was ≥5 at 400 MPa and ≤3 at 500 and 600
MPa,
and it reduced (to 1.79) with increasing pressures. By contrast
they re-
ported ΔE = 10.18 after thermal processing. Much lower
changes in
strawberry purée were noticed by Patras et al. (2009). They
reported
ΔE 5.67 and 2.44 after TP and HPP (500 MPa, 15 min, room
tempera-
ture) treatment, respectively. The changes in the color
parameters
could also be related to the higher residual activity of PPO and
POD at TP.
3.6. Microbiological quality
Yeast and mold counts and the total microbial count indicated a
sig-
nificant effect of HPP and TP on the microbiological quality of
the prod-
uct (Table 3). TP and preservation by HPP at 500 MPa (at both
temperatures) reduced the colony-forming units of yeasts and
molds
from 4.6 log cfu/g and 3.8 log cfu/g to b1 log cfu/g,
respectively. The
lower pressure allowed a significant reduction in microorganism
a
e e
d d
e
d
b
e
b
c c
0
1
2
3
4
1 min 5 min 15 min 1 min 5 min 15 min
TP HPP 300 MPa HPP 500 MPa
ΔE0°C 50°C
: fresh weight; CS: control sample; TP: thermal pasteurization.
Mean values denoted with
Table 3
Count of yeast and molds and total microbial count in fresh
strawberries and strawberry
purée pasteurized and preserved with the HPP method (log cfu/g
FW).
T
(°C)
P
(MPa)
t
(min)
Yeast Molds TMC
CS – 0.1 – 4.60 ± 0.06a 3.82 ± 0.08a 4.86 ± 0.12a
TP 90 0.1 15 b1 ± 0.05c b1 ± 0.07e b1 ± 0.06c
HPP 0 300 1 1.60 ± 0.15b 3.32 ± 0.06b 4.30 ± 0.10a
5 1 ± 0.09c 1.70 ± 0.12d 4.26 ± 0.07a
15 b1 ± 0.08c b1 ± 0.06e 4.28 ± 0.09a
500 1 b1 ± 0.07c b1 ± 0.07e 4.26 ± 0.11a
5 b1 ± 0.06c b1 ± 0.09e 4.26 ± 0.10a
15 b1 ± 0.07c b1 ± 0.06e 4.36 ± 0.08a
50 300 1 1.95 ± 0.14b 2.74 ± 0.04c 3.54 ± 0.12b
5 1.84 ± 0.12b 1.48 ± 0.12d 3.26 ± 0.14b
15 1 ± 0.07c 1 ± 0.08e 3.20 ± 0.11b
500 1 b1 ± 0.06c b1 ± 0.06e 3.40 ± 0.12b
15 b1 ± 0.07c b1 ± 0.03e 3.41 ± 0.15b
Data represent means (n = 3); FW: fresh weight; TMC: total
microbial count; CS: control
sample; TP: thermal pasteurization; HPP: high pressure
processing. TMC — DRBC plating
medium, incubation at 30 °C for 72 h; yeasts and molds — PCA
plating medium, incuba-
tion at 25 °C for 5 to 7 days.
Mean values denoted with the same letter are not statistically
significantly different,
p ≤ 0.05.
54 K. Marszałek et al. / Innovative Food Science and Emerging
Technologies 27 (2015) 48–56
counts, minimum 2.6 and 0.5 log cfu/g for yeast and molds,
respectively.
HPP treated at 0 °C was ineffective to reduce TMC, compared
to HPP at
50 °C and TP treated where TMC was reduced by 1.5 and 4.8
log cfu/g,
respectively.
3.7. Sensory quality
The sensory assessment conducted after preservation
demonstrated
that the greatest changes, compared to the control sample,
occurred in
purée after TP (Table 4). The color, taste and aroma of
pasteurized
purée were scored from 0.5 to 1.0 pts lower than CS. Only the
purée con-
sistency remained unaffected. In the overall quality assessment
with a
hedonic scale, pasteurized purée was scored as 7.8. In turn, no
signifi-
cant changes were noted in the color and consistency of HPP-
preserved purée at 0 °C, and the statistical analysis revealed a
small de-
crease in the scores given for aroma and taste. According to
Table 4, the
color, taste, aroma and consistency of all samples treated with
HPP at
50 °C, either at 300 or 500 MPa, show no significant differences
com-
pared to the fresh samples. The overall acceptability of the
products pre-
served using this method was significantly lower than that of
the
unprocessed material, but still at a high level (8.5 on average).
However,
some examples showed an adverse effect of the HPP method on
taste
and smell. As a result of high pressure a rancid smell appears in
Table 4
Sensory quality of fresh strawberries and strawberry purée TP
and preserved with the HPP me
-point hedonic scale).
T
(°C)
P
(MPa)
t
(min)
Color
CS – 0.1 – 6.0 ± 0.0a
TP 90 0.1 15 5.5 ± 0.4b
HPP 0 300 1 6.0 ± 0.0a
5 6.0 ± 0.0a
15 6.0 ± 0.0a
500 1 5.9 ± 0.2a
5 6.0 ± 0.0a
15 6.0 ± 0.0a
50 300 1 5.8 ± 0.4a
5 5.8 ± 0.4a
15 5.8 ± 0.4a
500 1 5.8 ± 0.4a
15 5.8 ± 0.4a
Data represent means ± SD (n = 8); CS: control sample; TP:
thermal pasteurization; HPP: hig
Mean values denoted with the same letter are not statistically
different, p ≤ 0.05.
tomatoes (Poretta, Birzi, Ghizzoni, & Vicini, 1995). On the
other hand,
the smell of HPP-treated onions (350 MPa, 30 min, 25 and 40
°C) was
less intense and was like frozen onions (Butz, Koller, Tauscher,
& Wolf,
1994). Pressure above 100 MPa damages cell structures such as
mem-
branes and provokes a massive release of enzymes leading to
numerous
enzymatic reactions that influence flavor and product stability.
UHP
processing (30 min/300 MPa/25 and 40 °C) changes the odor of
fresh
onions towards that of braised or fried onions. The excess
increase in
the content of n-hexane in tomatoes is what gives them an
unpleasant
smell. During HPP, very high n-hexanal and cis-3-hexenal
concentra-
tions were formed from free fatty acid oxidation. In the case of
onions,
the authors noted two reasons: a reduction in dipropyl sulfides
and an
increase in trans-propylene disulfide and 3.4-
dimethylthiophene.
3.8. Statistical analysis
The cluster analysis conducted using the method of weighted
aver-
age linkage and Euclidean distance for analyzing the contents of
pheno-
lic acids, flavonols, anthocyanins, vitamin C, color, enzymatic
activity
and sensory assessment (Fig. 3) showed explicitly the greatest
changes
in the quality of strawberry purée upon thermal pasteurization
(TP).
The HPP-treated sample, especially at 0 °C, showed the lowest
differ-
ences compared to the control sample. The analysis of variance
conduct-
ed for results concerning the chemical composition of purée did
not
show any significant effect of the pressure value and duration of
the
time of treatment on phenolic acids, flavonols, the total content
of poly-
phenols, anthocyanins and the total microbial count.
4. Conclusions
The study showed the effects of high pressure and thermal
pasteur-
ization on the chemical compounds, color, sensorial quality and
micro-
bial count in strawberry (‘Senga Sengana’ cv.) purée. The level
of
phenolic acids, flavonols, total polyphenols, anthocyanins,
vitamin C,
color and taste depended on the temperature, whereas pressure
and
time were not significant factors. Pressure, temperature and
time influ-
enced the PPO and POD activity and the microbial count. The
measure-
ment of the activities of PPO and POD demonstrated, however,
greatest
inactivation at the longest exposure time (15 min). Although the
senso-
ry quality of all strawberry purée samples preserved with the
HPP
method was very high compared to TP, taking into account the
results
of microbiological analyses and tissue enzyme activity, the
recommend-
ed pressure treatment is that applied at 500 MPa and 50 °C.
Milder con-
ditions of the process may result in the product being equally
valuable
in terms of its chemical quality, but with a shorter shelf-life due
to mi-
crobiological quality and enzymatic activity. Further studies
are,
thod (color, taste, aroma, consistency in a 6-point scale, overall
quality assessment in a 9-
Taste Aroma Consistency Overall quality
6.0 ± 0.0a 6.0 ± 0.0a 6.0 ± 0.0a 9.0 ± 0.0a
5.0 ± 0.0c 5.3 ± 0.4b 6.0 ± 0.0a 7.8 ± 0.4b
5.6 ± 0.4ab 5.4 ± 0.4b 5.8 ± 0.4a 8.5 ± 0.4ab
5.4 ± 0.4bc 5.4 ± 0.4b 5.8 ± 0.4a 8.5 ± 0.4ab
5.5 ± 0.4abc 5.6 ± 0.4ab 5.8 ± 0.4a 8.3 ± 0.4ab
5.5 ± 0.4abc 5.4 ± 0.4b 5.8 ± 0.4a 8.5 ± 0.4ab
5.8 ± 0.4ab 5.6 ± 0.4ab 5.8 ± 0.4a 8.5 ± 0.4ab
5.6 ± 0.4ab 5.5 ± 0.4ab 5.8 ± 0.4a 8.5 ± 0.4ab
6.0 ± 0.0a 5.8 ± 0.4ab 5.8 ± 0.4a 8.5 ± 0.4ab
6.0 ± 0.0a 5.8 ± 0.4ab 6.0 ± 0.0a 8.5 ± 0.4ab
6.0 ± 0.0a 6.0 ± 0.4a 5.8 ± 0.4a 8.3 ± 0.4ab
6.0 ± 0.0a 6.0 ± 0.4a 5.8 ± 0.4a 8.5 ± 0.4ab
6.0 ± 0.0a 5.8 ± 0.4ab 6.0 ± 0.0a 8.5 ± 0.4ab
h pressure processing.
Fig. 3. Cluster analysis conducted with the method of weighted
average linkage using the
Euclidean distance for analyzing the contents of polyphenols,
anthocyanins, vitamin C,
color, enzymatic activity and sensory assessment. Data: CS:
control sample; TP: thermal
pasteurization; HPP/pressure/time/temperature.
55K. Marszałek et al. / Innovative Food Science and Emerging
Technologies 27 (2015) 48–56
therefore, recommended to evaluate the quality of strawberry
purée
preserved with HPP at 500 MPa, 50 °C, and 15 min during
storage. The
most distinct advantage of the HPP method was the good
preservation
of the sensory attributes, which were similar to the control
sample
and much better than after thermal pasteurization.
Acknowledgments
The Project was financed from funds of the National Research
Center
(grant No. NN 312 252540) and co-financed from funds of the
European
Union within the European Social Fund (contract No. 78/ES/ZS-
II/W-
2151.1/11). Authors would like to thank Prof. Monika Fonberg-
Broczek (Institute of High Pressures PAS UNIPRESS, Poland)
for the pos-
sibility of using the pressure chamber. We are also grateful to
Prof. Alan
Kelly (UCC, Cork, Ireland) for his valuable remarks during
manuscript
preparation.
References
Amakura, Y., Okada, M., Tsuji, S., & Tonogai, Y. (2000). High-
performance liquid chro-
matographic determination with photodiode array detection of
ellagic acid in fresh
and processed fruits. Journal of Chromatography A, 896, 87–93.
Barba, F.J., Esteve, M.J., & Frigola, A. (2013).
Physicochemical and nutritional characteris-
tics of blueberry juice after high pressure processing. Food
Research International,
50, 545–549.
Bigliardi, B., & Galati, F. (2013). Innovation trends in the food
industry: The case of func-
tional foods. Trends in Food Science and Technology, 31, 118–
129.
Blumberg, J. (2003). Dietary antioxidants of fruits and
vegetable in prevention of chronic
diseases. Horticultural Science, 38(5), 771.
Boero, R. (2011). Food quality as a public good: Cooperation
dynamics and economic de-
velopment in a rural community. Mind & Society, 10, 203–215.
Breitfellner, F., Solar, S., & Sontag, G. (2003). Radiation
induced chemical changes of phe-
nolic compounds in strawberries. Radiation Physics and
Chemistry, 67, 497–499.
Butz, P., Koller, W.D., Tauscher, B., & Wolf, S. (1994). Ultra-
high pressure processing of on-
ions: Chemical and sensory changes. Food Science and
Technology, 27, 463–467.
Cao, X., Zhang, Y., Zhang, F., Wang, Y., Yi, J., & Liao, X.
(2011). Effects of high hydrostatic
pressure on enzymes, phenolic compounds, anthocyanins,
polymeric color and
color of strawberry pulps. Journal of the Science and Food
Agriculture, 91, 877–885.
Cano, M.P., Hernandez, A., & De Ancos, B. (1997). High
pressure and temperature effects
on enzyme inactivation in strawberry and orange products.
Journal of Food Science,
62(1), 85–88.
Corrales, M., Toepfl, S., Butz, P., Knorr, D., & Tauscher, B.
(2008). Extraction of anthocya-
nins from grape by-products assisted by ultrasonic, high
hydrostatic pressure or
pulsed electric fields: A comparison. Innovative Food Science
& Emerging
Technologies, 9, 85–91.
Da Silva Pinto, M., Lajolo, F.M., & Genovese, M.I. (2008).
Bioactive compounds and quan-
tification of total ellagic acid in strawberries (Fragaria ×
ananassa Duch.). Food
Chemistry, 107, 1629–1635.
Farahani, P., Grunow, M., & Günther, H.O. (2012). Integrated
production and distribution
planning for perishable food products. Flexible Services and
Manufacturing Journal, 24,
28–51.
Ferrari, G., Marcesca, P., & Ciccarone, R. (2011). The effects
of high hydrostatic pressure on the
polyphenols and anthocyanins in red fruit products. Procedia
Food Science, 1, 847–853.
Gao, X., Ohlander, M., Jeppson, N., Bjork, L., & Trajkovski, V.
(2000). Changes in antioxidant
effect and their relationship to phytonutrients in fruit of sea
buckthorn (Hippophae
rhamnoides L.) during maturation. Journal of Agriculture and
Food Chemistry, 48,
1845–1890.
Garcia-Palazon, A., Suthanthangjai, W., Kajda, P., & Zabetakis,
I. (2004). The effects of high
pressure on β-glucosidase, peroxidase and polyphenoloxidase in
red raspberry
(Rubus idaeus) and strawberry (Fragaria × ananassa). Food
Chemistry, 88, 7–10.
Goiffon, J.P., Mouly, P.P., & Gaydou, E.M. (1999).
Anthocyanic pigment determination in
red fruit juices, concentrated juices and syrups using liquid
chromatography.
Analytica Chimica Acta, 382, 39–50.
Hakala, M., Lapveteläinen, A., Huopalahti, R., Kallio, H., &
Tahovonen, R. (2003). Effects of
varieties and cultivation conditions on the composition of
strawberries. Journal of
Food Composition and Analysis, 16, 67–80.
Hartmann, A., Patz, C., Andlauert, H., Dietrich, H., & Ludwig,
M. (2010). Change of ascorbic
acid and phenolic compounds during the processing of
strawberry purée and juice.
Fruit Processing, 4–6, 102–109.
Häkkinen, S.H., Karenlampi, S.O., Mykkanen, H.M., Heinonen,
I.M., & Torronen, A.R.
(2000). Ellagic acid content in berries: Influence of domestic
processing and storage.
European Food Research and Technology, 212, 75–80.
Häkkinen, S.H., & Törrönen, A.R. (2000). Content of flavonols
and selected phenolic acids
in strawberries and Vaccinium species: Influence of cultivar,
cultivation site and tech-
nique. Food Research International, 33, 517–524.
Heinz, V., & Buckow, R. (2009). Food preservation by high
pressure. Journal für
Verbraucherschutz und Lebensmittelsicherheit, 10(1007), 3–9.
Kaur, C., & Kapoor, H.C. (2001). Antioxidants in fruits and
Original articleGamma radiation effect on quality changes .docx

Más contenido relacionado

Similar a Original articleGamma radiation effect on quality changes .docx

Growth Response of Heterotis Niloticus (Cuvier 1829) Fingerlings to Artificia...
Growth Response of Heterotis Niloticus (Cuvier 1829) Fingerlings to Artificia...Growth Response of Heterotis Niloticus (Cuvier 1829) Fingerlings to Artificia...
Growth Response of Heterotis Niloticus (Cuvier 1829) Fingerlings to Artificia...AI Publications
 
Impact of pulsed light treatment on quality characteristics and oxidative sta...
Impact of pulsed light treatment on quality characteristics and oxidative sta...Impact of pulsed light treatment on quality characteristics and oxidative sta...
Impact of pulsed light treatment on quality characteristics and oxidative sta...ljmonking
 
Impact of different preservation treatments on lipids of the
Impact of different preservation treatments on lipids of theImpact of different preservation treatments on lipids of the
Impact of different preservation treatments on lipids of theChristos Papaioannou
 
Protective Effects of Alpha Lipoic Acid (α -LA) Against Lead Neuro-Toxicity i...
Protective Effects of Alpha Lipoic Acid (α -LA) Against Lead Neuro-Toxicity i...Protective Effects of Alpha Lipoic Acid (α -LA) Against Lead Neuro-Toxicity i...
Protective Effects of Alpha Lipoic Acid (α -LA) Against Lead Neuro-Toxicity i...inventionjournals
 
EFFECT OF HEAT SHOCK TREATMENT AND ALOE VERA COATING TO CHILLING INJURY SYMTO...
EFFECT OF HEAT SHOCK TREATMENT AND ALOE VERA COATING TO CHILLING INJURY SYMTO...EFFECT OF HEAT SHOCK TREATMENT AND ALOE VERA COATING TO CHILLING INJURY SYMTO...
EFFECT OF HEAT SHOCK TREATMENT AND ALOE VERA COATING TO CHILLING INJURY SYMTO...Repository Ipb
 
Uptake and Fate of Diarrhetic Shellfish Poisoning
Uptake and Fate of Diarrhetic Shellfish PoisoningUptake and Fate of Diarrhetic Shellfish Poisoning
Uptake and Fate of Diarrhetic Shellfish Poisoningv2zq
 
Effects of organic and mineral fertilizers on total antioxidant, polyphenolic...
Effects of organic and mineral fertilizers on total antioxidant, polyphenolic...Effects of organic and mineral fertilizers on total antioxidant, polyphenolic...
Effects of organic and mineral fertilizers on total antioxidant, polyphenolic...Alexander Decker
 
Use of Silage Acid Devil Fish (Pterygoplichthys spp.) as Protein Supplement i...
Use of Silage Acid Devil Fish (Pterygoplichthys spp.) as Protein Supplement i...Use of Silage Acid Devil Fish (Pterygoplichthys spp.) as Protein Supplement i...
Use of Silage Acid Devil Fish (Pterygoplichthys spp.) as Protein Supplement i...criollito
 
The content of total phenols and antioxidant activity three types sea algae t...
The content of total phenols and antioxidant activity three types sea algae t...The content of total phenols and antioxidant activity three types sea algae t...
The content of total phenols and antioxidant activity three types sea algae t...Alexander Decker
 
Influence of low dose of gamma radiation and storage on some vitamins and min...
Influence of low dose of gamma radiation and storage on some vitamins and min...Influence of low dose of gamma radiation and storage on some vitamins and min...
Influence of low dose of gamma radiation and storage on some vitamins and min...Nii Korley Kortei
 
Isolation and identification of bacteria in the rotifer mass culture medium
Isolation and identification of bacteria in the rotifer mass culture mediumIsolation and identification of bacteria in the rotifer mass culture medium
Isolation and identification of bacteria in the rotifer mass culture mediumAlexander Decker
 
Alteration in Protein Metabolic Profiles in Liver Tissue of Rats during Dimet...
Alteration in Protein Metabolic Profiles in Liver Tissue of Rats during Dimet...Alteration in Protein Metabolic Profiles in Liver Tissue of Rats during Dimet...
Alteration in Protein Metabolic Profiles in Liver Tissue of Rats during Dimet...iosrjce
 
A study on length weight relationships (lwr) and growth responses of major ca...
A study on length weight relationships (lwr) and growth responses of major ca...A study on length weight relationships (lwr) and growth responses of major ca...
A study on length weight relationships (lwr) and growth responses of major ca...Alexander Decker
 
Levels of PAHs and Potentially Toxic Metals in Three Species of Fresh and Smo...
Levels of PAHs and Potentially Toxic Metals in Three Species of Fresh and Smo...Levels of PAHs and Potentially Toxic Metals in Three Species of Fresh and Smo...
Levels of PAHs and Potentially Toxic Metals in Three Species of Fresh and Smo...IOSR Journals
 
Population dynamics of tinfoil barb, barbonymus schwanenfeldii (bleeker, 1853...
Population dynamics of tinfoil barb, barbonymus schwanenfeldii (bleeker, 1853...Population dynamics of tinfoil barb, barbonymus schwanenfeldii (bleeker, 1853...
Population dynamics of tinfoil barb, barbonymus schwanenfeldii (bleeker, 1853...Alexander Decker
 
F03402042047
F03402042047F03402042047
F03402042047theijes
 
Effect of spice treatment on the quality of solar dried african catfish, clar...
Effect of spice treatment on the quality of solar dried african catfish, clar...Effect of spice treatment on the quality of solar dried african catfish, clar...
Effect of spice treatment on the quality of solar dried african catfish, clar...Alexander Decker
 
New Spectrophotometric Determination of Tenofovir Disoproxil Fumaratein Bulk ...
New Spectrophotometric Determination of Tenofovir Disoproxil Fumaratein Bulk ...New Spectrophotometric Determination of Tenofovir Disoproxil Fumaratein Bulk ...
New Spectrophotometric Determination of Tenofovir Disoproxil Fumaratein Bulk ...IOSRJAC
 
nii korley kortei (microbiology)
nii korley kortei (microbiology)nii korley kortei (microbiology)
nii korley kortei (microbiology)Nii Korley Kortei
 
Studies on combined effect of Aeromonas hydrophila and cadmium on lipid per...
	 Studies on combined effect of Aeromonas hydrophila and cadmium on lipid per...	 Studies on combined effect of Aeromonas hydrophila and cadmium on lipid per...
Studies on combined effect of Aeromonas hydrophila and cadmium on lipid per...iosrphr_editor
 

Similar a Original articleGamma radiation effect on quality changes .docx (20)

Growth Response of Heterotis Niloticus (Cuvier 1829) Fingerlings to Artificia...
Growth Response of Heterotis Niloticus (Cuvier 1829) Fingerlings to Artificia...Growth Response of Heterotis Niloticus (Cuvier 1829) Fingerlings to Artificia...
Growth Response of Heterotis Niloticus (Cuvier 1829) Fingerlings to Artificia...
 
Impact of pulsed light treatment on quality characteristics and oxidative sta...
Impact of pulsed light treatment on quality characteristics and oxidative sta...Impact of pulsed light treatment on quality characteristics and oxidative sta...
Impact of pulsed light treatment on quality characteristics and oxidative sta...
 
Impact of different preservation treatments on lipids of the
Impact of different preservation treatments on lipids of theImpact of different preservation treatments on lipids of the
Impact of different preservation treatments on lipids of the
 
Protective Effects of Alpha Lipoic Acid (α -LA) Against Lead Neuro-Toxicity i...
Protective Effects of Alpha Lipoic Acid (α -LA) Against Lead Neuro-Toxicity i...Protective Effects of Alpha Lipoic Acid (α -LA) Against Lead Neuro-Toxicity i...
Protective Effects of Alpha Lipoic Acid (α -LA) Against Lead Neuro-Toxicity i...
 
EFFECT OF HEAT SHOCK TREATMENT AND ALOE VERA COATING TO CHILLING INJURY SYMTO...
EFFECT OF HEAT SHOCK TREATMENT AND ALOE VERA COATING TO CHILLING INJURY SYMTO...EFFECT OF HEAT SHOCK TREATMENT AND ALOE VERA COATING TO CHILLING INJURY SYMTO...
EFFECT OF HEAT SHOCK TREATMENT AND ALOE VERA COATING TO CHILLING INJURY SYMTO...
 
Uptake and Fate of Diarrhetic Shellfish Poisoning
Uptake and Fate of Diarrhetic Shellfish PoisoningUptake and Fate of Diarrhetic Shellfish Poisoning
Uptake and Fate of Diarrhetic Shellfish Poisoning
 
Effects of organic and mineral fertilizers on total antioxidant, polyphenolic...
Effects of organic and mineral fertilizers on total antioxidant, polyphenolic...Effects of organic and mineral fertilizers on total antioxidant, polyphenolic...
Effects of organic and mineral fertilizers on total antioxidant, polyphenolic...
 
Use of Silage Acid Devil Fish (Pterygoplichthys spp.) as Protein Supplement i...
Use of Silage Acid Devil Fish (Pterygoplichthys spp.) as Protein Supplement i...Use of Silage Acid Devil Fish (Pterygoplichthys spp.) as Protein Supplement i...
Use of Silage Acid Devil Fish (Pterygoplichthys spp.) as Protein Supplement i...
 
The content of total phenols and antioxidant activity three types sea algae t...
The content of total phenols and antioxidant activity three types sea algae t...The content of total phenols and antioxidant activity three types sea algae t...
The content of total phenols and antioxidant activity three types sea algae t...
 
Influence of low dose of gamma radiation and storage on some vitamins and min...
Influence of low dose of gamma radiation and storage on some vitamins and min...Influence of low dose of gamma radiation and storage on some vitamins and min...
Influence of low dose of gamma radiation and storage on some vitamins and min...
 
Isolation and identification of bacteria in the rotifer mass culture medium
Isolation and identification of bacteria in the rotifer mass culture mediumIsolation and identification of bacteria in the rotifer mass culture medium
Isolation and identification of bacteria in the rotifer mass culture medium
 
Alteration in Protein Metabolic Profiles in Liver Tissue of Rats during Dimet...
Alteration in Protein Metabolic Profiles in Liver Tissue of Rats during Dimet...Alteration in Protein Metabolic Profiles in Liver Tissue of Rats during Dimet...
Alteration in Protein Metabolic Profiles in Liver Tissue of Rats during Dimet...
 
A study on length weight relationships (lwr) and growth responses of major ca...
A study on length weight relationships (lwr) and growth responses of major ca...A study on length weight relationships (lwr) and growth responses of major ca...
A study on length weight relationships (lwr) and growth responses of major ca...
 
Levels of PAHs and Potentially Toxic Metals in Three Species of Fresh and Smo...
Levels of PAHs and Potentially Toxic Metals in Three Species of Fresh and Smo...Levels of PAHs and Potentially Toxic Metals in Three Species of Fresh and Smo...
Levels of PAHs and Potentially Toxic Metals in Three Species of Fresh and Smo...
 
Population dynamics of tinfoil barb, barbonymus schwanenfeldii (bleeker, 1853...
Population dynamics of tinfoil barb, barbonymus schwanenfeldii (bleeker, 1853...Population dynamics of tinfoil barb, barbonymus schwanenfeldii (bleeker, 1853...
Population dynamics of tinfoil barb, barbonymus schwanenfeldii (bleeker, 1853...
 
F03402042047
F03402042047F03402042047
F03402042047
 
Effect of spice treatment on the quality of solar dried african catfish, clar...
Effect of spice treatment on the quality of solar dried african catfish, clar...Effect of spice treatment on the quality of solar dried african catfish, clar...
Effect of spice treatment on the quality of solar dried african catfish, clar...
 
New Spectrophotometric Determination of Tenofovir Disoproxil Fumaratein Bulk ...
New Spectrophotometric Determination of Tenofovir Disoproxil Fumaratein Bulk ...New Spectrophotometric Determination of Tenofovir Disoproxil Fumaratein Bulk ...
New Spectrophotometric Determination of Tenofovir Disoproxil Fumaratein Bulk ...
 
nii korley kortei (microbiology)
nii korley kortei (microbiology)nii korley kortei (microbiology)
nii korley kortei (microbiology)
 
Studies on combined effect of Aeromonas hydrophila and cadmium on lipid per...
	 Studies on combined effect of Aeromonas hydrophila and cadmium on lipid per...	 Studies on combined effect of Aeromonas hydrophila and cadmium on lipid per...
Studies on combined effect of Aeromonas hydrophila and cadmium on lipid per...
 

Más de gerardkortney

· Describe strategies to build rapport with inmates and offenders .docx
· Describe strategies to build rapport with inmates and offenders .docx· Describe strategies to build rapport with inmates and offenders .docx
· Describe strategies to build rapport with inmates and offenders .docxgerardkortney
 
· Debates continue regarding what constitutes an appropriate rol.docx
· Debates continue regarding what constitutes an appropriate rol.docx· Debates continue regarding what constitutes an appropriate rol.docx
· Debates continue regarding what constitutes an appropriate rol.docxgerardkortney
 
· Critical thinking paper ·  ·  · 1. A case study..docx
· Critical thinking paper ·  ·  · 1. A case study..docx· Critical thinking paper ·  ·  · 1. A case study..docx
· Critical thinking paper ·  ·  · 1. A case study..docxgerardkortney
 
· Create a Press Release for your event - refer to slide 24 in thi.docx
· Create a Press Release for your event - refer to slide 24 in thi.docx· Create a Press Release for your event - refer to slide 24 in thi.docx
· Create a Press Release for your event - refer to slide 24 in thi.docxgerardkortney
 
· Coronel & Morris Chapter 7, Problems 1, 2 and 3.docx
· Coronel & Morris Chapter 7, Problems 1, 2 and 3.docx· Coronel & Morris Chapter 7, Problems 1, 2 and 3.docx
· Coronel & Morris Chapter 7, Problems 1, 2 and 3.docxgerardkortney
 
· Complete the following problems from your textbook· Pages 378.docx
· Complete the following problems from your textbook· Pages 378.docx· Complete the following problems from your textbook· Pages 378.docx
· Complete the following problems from your textbook· Pages 378.docxgerardkortney
 
· Consider how different countries approach aging. As you consid.docx
· Consider how different countries approach aging. As you consid.docx· Consider how different countries approach aging. As you consid.docx
· Consider how different countries approach aging. As you consid.docxgerardkortney
 
· Clarifying some things on the Revolution I am going to say som.docx
· Clarifying some things on the Revolution I am going to say som.docx· Clarifying some things on the Revolution I am going to say som.docx
· Clarifying some things on the Revolution I am going to say som.docxgerardkortney
 
· Chapter 9 – Review the section on Establishing a Security Cultur.docx
· Chapter 9 – Review the section on Establishing a Security Cultur.docx· Chapter 9 – Review the section on Establishing a Security Cultur.docx
· Chapter 9 – Review the section on Establishing a Security Cultur.docxgerardkortney
 
· Chapter 10 The Early Elementary Grades 1-3The primary grades.docx
· Chapter 10 The Early Elementary Grades 1-3The primary grades.docx· Chapter 10 The Early Elementary Grades 1-3The primary grades.docx
· Chapter 10 The Early Elementary Grades 1-3The primary grades.docxgerardkortney
 
· Chapter 5, Formulating the Research Design”· Section 5.2, Ch.docx
· Chapter 5, Formulating the Research Design”· Section 5.2, Ch.docx· Chapter 5, Formulating the Research Design”· Section 5.2, Ch.docx
· Chapter 5, Formulating the Research Design”· Section 5.2, Ch.docxgerardkortney
 
· Chap 2 and 3· what barriers are there in terms of the inter.docx
· Chap 2 and  3· what barriers are there in terms of the inter.docx· Chap 2 and  3· what barriers are there in terms of the inter.docx
· Chap 2 and 3· what barriers are there in terms of the inter.docxgerardkortney
 
· Case Study 2 Improving E-Mail Marketing ResponseDue Week 8 an.docx
· Case Study 2 Improving E-Mail Marketing ResponseDue Week 8 an.docx· Case Study 2 Improving E-Mail Marketing ResponseDue Week 8 an.docx
· Case Study 2 Improving E-Mail Marketing ResponseDue Week 8 an.docxgerardkortney
 
· Briefly describe the technologies that are leading businesses in.docx
· Briefly describe the technologies that are leading businesses in.docx· Briefly describe the technologies that are leading businesses in.docx
· Briefly describe the technologies that are leading businesses in.docxgerardkortney
 
· Assignment List· My Personality Theory Paper (Week Four)My.docx
· Assignment List· My Personality Theory Paper (Week Four)My.docx· Assignment List· My Personality Theory Paper (Week Four)My.docx
· Assignment List· My Personality Theory Paper (Week Four)My.docxgerardkortney
 
· Assignment List· Week 7 - Philosophical EssayWeek 7 - Philos.docx
· Assignment List· Week 7 - Philosophical EssayWeek 7 - Philos.docx· Assignment List· Week 7 - Philosophical EssayWeek 7 - Philos.docx
· Assignment List· Week 7 - Philosophical EssayWeek 7 - Philos.docxgerardkortney
 
· Assignment 3 Creating a Compelling VisionLeaders today must be .docx
· Assignment 3 Creating a Compelling VisionLeaders today must be .docx· Assignment 3 Creating a Compelling VisionLeaders today must be .docx
· Assignment 3 Creating a Compelling VisionLeaders today must be .docxgerardkortney
 
· Assignment 4· Week 4 – Assignment Explain Theoretical Perspec.docx
· Assignment 4· Week 4 – Assignment Explain Theoretical Perspec.docx· Assignment 4· Week 4 – Assignment Explain Theoretical Perspec.docx
· Assignment 4· Week 4 – Assignment Explain Theoretical Perspec.docxgerardkortney
 
· Assignment 2 Leader ProfileMany argue that the single largest v.docx
· Assignment 2 Leader ProfileMany argue that the single largest v.docx· Assignment 2 Leader ProfileMany argue that the single largest v.docx
· Assignment 2 Leader ProfileMany argue that the single largest v.docxgerardkortney
 
· Assignment 1 Diversity Issues in Treating AddictionThe comple.docx
· Assignment 1 Diversity Issues in Treating AddictionThe comple.docx· Assignment 1 Diversity Issues in Treating AddictionThe comple.docx
· Assignment 1 Diversity Issues in Treating AddictionThe comple.docxgerardkortney
 

Más de gerardkortney (20)

· Describe strategies to build rapport with inmates and offenders .docx
· Describe strategies to build rapport with inmates and offenders .docx· Describe strategies to build rapport with inmates and offenders .docx
· Describe strategies to build rapport with inmates and offenders .docx
 
· Debates continue regarding what constitutes an appropriate rol.docx
· Debates continue regarding what constitutes an appropriate rol.docx· Debates continue regarding what constitutes an appropriate rol.docx
· Debates continue regarding what constitutes an appropriate rol.docx
 
· Critical thinking paper ·  ·  · 1. A case study..docx
· Critical thinking paper ·  ·  · 1. A case study..docx· Critical thinking paper ·  ·  · 1. A case study..docx
· Critical thinking paper ·  ·  · 1. A case study..docx
 
· Create a Press Release for your event - refer to slide 24 in thi.docx
· Create a Press Release for your event - refer to slide 24 in thi.docx· Create a Press Release for your event - refer to slide 24 in thi.docx
· Create a Press Release for your event - refer to slide 24 in thi.docx
 
· Coronel & Morris Chapter 7, Problems 1, 2 and 3.docx
· Coronel & Morris Chapter 7, Problems 1, 2 and 3.docx· Coronel & Morris Chapter 7, Problems 1, 2 and 3.docx
· Coronel & Morris Chapter 7, Problems 1, 2 and 3.docx
 
· Complete the following problems from your textbook· Pages 378.docx
· Complete the following problems from your textbook· Pages 378.docx· Complete the following problems from your textbook· Pages 378.docx
· Complete the following problems from your textbook· Pages 378.docx
 
· Consider how different countries approach aging. As you consid.docx
· Consider how different countries approach aging. As you consid.docx· Consider how different countries approach aging. As you consid.docx
· Consider how different countries approach aging. As you consid.docx
 
· Clarifying some things on the Revolution I am going to say som.docx
· Clarifying some things on the Revolution I am going to say som.docx· Clarifying some things on the Revolution I am going to say som.docx
· Clarifying some things on the Revolution I am going to say som.docx
 
· Chapter 9 – Review the section on Establishing a Security Cultur.docx
· Chapter 9 – Review the section on Establishing a Security Cultur.docx· Chapter 9 – Review the section on Establishing a Security Cultur.docx
· Chapter 9 – Review the section on Establishing a Security Cultur.docx
 
· Chapter 10 The Early Elementary Grades 1-3The primary grades.docx
· Chapter 10 The Early Elementary Grades 1-3The primary grades.docx· Chapter 10 The Early Elementary Grades 1-3The primary grades.docx
· Chapter 10 The Early Elementary Grades 1-3The primary grades.docx
 
· Chapter 5, Formulating the Research Design”· Section 5.2, Ch.docx
· Chapter 5, Formulating the Research Design”· Section 5.2, Ch.docx· Chapter 5, Formulating the Research Design”· Section 5.2, Ch.docx
· Chapter 5, Formulating the Research Design”· Section 5.2, Ch.docx
 
· Chap 2 and 3· what barriers are there in terms of the inter.docx
· Chap 2 and  3· what barriers are there in terms of the inter.docx· Chap 2 and  3· what barriers are there in terms of the inter.docx
· Chap 2 and 3· what barriers are there in terms of the inter.docx
 
· Case Study 2 Improving E-Mail Marketing ResponseDue Week 8 an.docx
· Case Study 2 Improving E-Mail Marketing ResponseDue Week 8 an.docx· Case Study 2 Improving E-Mail Marketing ResponseDue Week 8 an.docx
· Case Study 2 Improving E-Mail Marketing ResponseDue Week 8 an.docx
 
· Briefly describe the technologies that are leading businesses in.docx
· Briefly describe the technologies that are leading businesses in.docx· Briefly describe the technologies that are leading businesses in.docx
· Briefly describe the technologies that are leading businesses in.docx
 
· Assignment List· My Personality Theory Paper (Week Four)My.docx
· Assignment List· My Personality Theory Paper (Week Four)My.docx· Assignment List· My Personality Theory Paper (Week Four)My.docx
· Assignment List· My Personality Theory Paper (Week Four)My.docx
 
· Assignment List· Week 7 - Philosophical EssayWeek 7 - Philos.docx
· Assignment List· Week 7 - Philosophical EssayWeek 7 - Philos.docx· Assignment List· Week 7 - Philosophical EssayWeek 7 - Philos.docx
· Assignment List· Week 7 - Philosophical EssayWeek 7 - Philos.docx
 
· Assignment 3 Creating a Compelling VisionLeaders today must be .docx
· Assignment 3 Creating a Compelling VisionLeaders today must be .docx· Assignment 3 Creating a Compelling VisionLeaders today must be .docx
· Assignment 3 Creating a Compelling VisionLeaders today must be .docx
 
· Assignment 4· Week 4 – Assignment Explain Theoretical Perspec.docx
· Assignment 4· Week 4 – Assignment Explain Theoretical Perspec.docx· Assignment 4· Week 4 – Assignment Explain Theoretical Perspec.docx
· Assignment 4· Week 4 – Assignment Explain Theoretical Perspec.docx
 
· Assignment 2 Leader ProfileMany argue that the single largest v.docx
· Assignment 2 Leader ProfileMany argue that the single largest v.docx· Assignment 2 Leader ProfileMany argue that the single largest v.docx
· Assignment 2 Leader ProfileMany argue that the single largest v.docx
 
· Assignment 1 Diversity Issues in Treating AddictionThe comple.docx
· Assignment 1 Diversity Issues in Treating AddictionThe comple.docx· Assignment 1 Diversity Issues in Treating AddictionThe comple.docx
· Assignment 1 Diversity Issues in Treating AddictionThe comple.docx
 

Último

The basics of sentences session 2pptx copy.pptx
The basics of sentences session 2pptx copy.pptxThe basics of sentences session 2pptx copy.pptx
The basics of sentences session 2pptx copy.pptxheathfieldcps1
 
Beyond the EU: DORA and NIS 2 Directive's Global Impact
Beyond the EU: DORA and NIS 2 Directive's Global ImpactBeyond the EU: DORA and NIS 2 Directive's Global Impact
Beyond the EU: DORA and NIS 2 Directive's Global ImpactPECB
 
9548086042 for call girls in Indira Nagar with room service
9548086042  for call girls in Indira Nagar  with room service9548086042  for call girls in Indira Nagar  with room service
9548086042 for call girls in Indira Nagar with room servicediscovermytutordmt
 
social pharmacy d-pharm 1st year by Pragati K. Mahajan
social pharmacy d-pharm 1st year by Pragati K. Mahajansocial pharmacy d-pharm 1st year by Pragati K. Mahajan
social pharmacy d-pharm 1st year by Pragati K. Mahajanpragatimahajan3
 
Sports & Fitness Value Added Course FY..
Sports & Fitness Value Added Course FY..Sports & Fitness Value Added Course FY..
Sports & Fitness Value Added Course FY..Disha Kariya
 
Interactive Powerpoint_How to Master effective communication
Interactive Powerpoint_How to Master effective communicationInteractive Powerpoint_How to Master effective communication
Interactive Powerpoint_How to Master effective communicationnomboosow
 
mini mental status format.docx
mini    mental       status     format.docxmini    mental       status     format.docx
mini mental status format.docxPoojaSen20
 
Ecosystem Interactions Class Discussion Presentation in Blue Green Lined Styl...
Ecosystem Interactions Class Discussion Presentation in Blue Green Lined Styl...Ecosystem Interactions Class Discussion Presentation in Blue Green Lined Styl...
Ecosystem Interactions Class Discussion Presentation in Blue Green Lined Styl...fonyou31
 
Software Engineering Methodologies (overview)
Software Engineering Methodologies (overview)Software Engineering Methodologies (overview)
Software Engineering Methodologies (overview)eniolaolutunde
 
POINT- BIOCHEMISTRY SEM 2 ENZYMES UNIT 5.pptx
POINT- BIOCHEMISTRY SEM 2 ENZYMES UNIT 5.pptxPOINT- BIOCHEMISTRY SEM 2 ENZYMES UNIT 5.pptx
POINT- BIOCHEMISTRY SEM 2 ENZYMES UNIT 5.pptxSayali Powar
 
Paris 2024 Olympic Geographies - an activity
Paris 2024 Olympic Geographies - an activityParis 2024 Olympic Geographies - an activity
Paris 2024 Olympic Geographies - an activityGeoBlogs
 
Web & Social Media Analytics Previous Year Question Paper.pdf
Web & Social Media Analytics Previous Year Question Paper.pdfWeb & Social Media Analytics Previous Year Question Paper.pdf
Web & Social Media Analytics Previous Year Question Paper.pdfJayanti Pande
 
The Most Excellent Way | 1 Corinthians 13
The Most Excellent Way | 1 Corinthians 13The Most Excellent Way | 1 Corinthians 13
The Most Excellent Way | 1 Corinthians 13Steve Thomason
 
Kisan Call Centre - To harness potential of ICT in Agriculture by answer farm...
Kisan Call Centre - To harness potential of ICT in Agriculture by answer farm...Kisan Call Centre - To harness potential of ICT in Agriculture by answer farm...
Kisan Call Centre - To harness potential of ICT in Agriculture by answer farm...Krashi Coaching
 
1029-Danh muc Sach Giao Khoa khoi 6.pdf
1029-Danh muc Sach Giao Khoa khoi  6.pdf1029-Danh muc Sach Giao Khoa khoi  6.pdf
1029-Danh muc Sach Giao Khoa khoi 6.pdfQucHHunhnh
 
1029 - Danh muc Sach Giao Khoa 10 . pdf
1029 -  Danh muc Sach Giao Khoa 10 . pdf1029 -  Danh muc Sach Giao Khoa 10 . pdf
1029 - Danh muc Sach Giao Khoa 10 . pdfQucHHunhnh
 
Student login on Anyboli platform.helpin
Student login on Anyboli platform.helpinStudent login on Anyboli platform.helpin
Student login on Anyboli platform.helpinRaunakKeshri1
 
Measures of Dispersion and Variability: Range, QD, AD and SD
Measures of Dispersion and Variability: Range, QD, AD and SDMeasures of Dispersion and Variability: Range, QD, AD and SD
Measures of Dispersion and Variability: Range, QD, AD and SDThiyagu K
 

Último (20)

The basics of sentences session 2pptx copy.pptx
The basics of sentences session 2pptx copy.pptxThe basics of sentences session 2pptx copy.pptx
The basics of sentences session 2pptx copy.pptx
 
Beyond the EU: DORA and NIS 2 Directive's Global Impact
Beyond the EU: DORA and NIS 2 Directive's Global ImpactBeyond the EU: DORA and NIS 2 Directive's Global Impact
Beyond the EU: DORA and NIS 2 Directive's Global Impact
 
9548086042 for call girls in Indira Nagar with room service
9548086042  for call girls in Indira Nagar  with room service9548086042  for call girls in Indira Nagar  with room service
9548086042 for call girls in Indira Nagar with room service
 
social pharmacy d-pharm 1st year by Pragati K. Mahajan
social pharmacy d-pharm 1st year by Pragati K. Mahajansocial pharmacy d-pharm 1st year by Pragati K. Mahajan
social pharmacy d-pharm 1st year by Pragati K. Mahajan
 
Sports & Fitness Value Added Course FY..
Sports & Fitness Value Added Course FY..Sports & Fitness Value Added Course FY..
Sports & Fitness Value Added Course FY..
 
Interactive Powerpoint_How to Master effective communication
Interactive Powerpoint_How to Master effective communicationInteractive Powerpoint_How to Master effective communication
Interactive Powerpoint_How to Master effective communication
 
mini mental status format.docx
mini    mental       status     format.docxmini    mental       status     format.docx
mini mental status format.docx
 
Ecosystem Interactions Class Discussion Presentation in Blue Green Lined Styl...
Ecosystem Interactions Class Discussion Presentation in Blue Green Lined Styl...Ecosystem Interactions Class Discussion Presentation in Blue Green Lined Styl...
Ecosystem Interactions Class Discussion Presentation in Blue Green Lined Styl...
 
Código Creativo y Arte de Software | Unidad 1
Código Creativo y Arte de Software | Unidad 1Código Creativo y Arte de Software | Unidad 1
Código Creativo y Arte de Software | Unidad 1
 
Software Engineering Methodologies (overview)
Software Engineering Methodologies (overview)Software Engineering Methodologies (overview)
Software Engineering Methodologies (overview)
 
POINT- BIOCHEMISTRY SEM 2 ENZYMES UNIT 5.pptx
POINT- BIOCHEMISTRY SEM 2 ENZYMES UNIT 5.pptxPOINT- BIOCHEMISTRY SEM 2 ENZYMES UNIT 5.pptx
POINT- BIOCHEMISTRY SEM 2 ENZYMES UNIT 5.pptx
 
Paris 2024 Olympic Geographies - an activity
Paris 2024 Olympic Geographies - an activityParis 2024 Olympic Geographies - an activity
Paris 2024 Olympic Geographies - an activity
 
Mattingly "AI & Prompt Design: Structured Data, Assistants, & RAG"
Mattingly "AI & Prompt Design: Structured Data, Assistants, & RAG"Mattingly "AI & Prompt Design: Structured Data, Assistants, & RAG"
Mattingly "AI & Prompt Design: Structured Data, Assistants, & RAG"
 
Web & Social Media Analytics Previous Year Question Paper.pdf
Web & Social Media Analytics Previous Year Question Paper.pdfWeb & Social Media Analytics Previous Year Question Paper.pdf
Web & Social Media Analytics Previous Year Question Paper.pdf
 
The Most Excellent Way | 1 Corinthians 13
The Most Excellent Way | 1 Corinthians 13The Most Excellent Way | 1 Corinthians 13
The Most Excellent Way | 1 Corinthians 13
 
Kisan Call Centre - To harness potential of ICT in Agriculture by answer farm...
Kisan Call Centre - To harness potential of ICT in Agriculture by answer farm...Kisan Call Centre - To harness potential of ICT in Agriculture by answer farm...
Kisan Call Centre - To harness potential of ICT in Agriculture by answer farm...
 
1029-Danh muc Sach Giao Khoa khoi 6.pdf
1029-Danh muc Sach Giao Khoa khoi  6.pdf1029-Danh muc Sach Giao Khoa khoi  6.pdf
1029-Danh muc Sach Giao Khoa khoi 6.pdf
 
1029 - Danh muc Sach Giao Khoa 10 . pdf
1029 -  Danh muc Sach Giao Khoa 10 . pdf1029 -  Danh muc Sach Giao Khoa 10 . pdf
1029 - Danh muc Sach Giao Khoa 10 . pdf
 
Student login on Anyboli platform.helpin
Student login on Anyboli platform.helpinStudent login on Anyboli platform.helpin
Student login on Anyboli platform.helpin
 
Measures of Dispersion and Variability: Range, QD, AD and SD
Measures of Dispersion and Variability: Range, QD, AD and SDMeasures of Dispersion and Variability: Range, QD, AD and SD
Measures of Dispersion and Variability: Range, QD, AD and SD
 

Original articleGamma radiation effect on quality changes .docx

  • 1. Original article Gamma radiation effect on quality changes in vacuum-packed squid (Illex argentinus) mantle rings during refrigerated (4–5 �C) storage Alejandra Tomac* & Marı́a Isabel Yeannes Grupo de Investigación Preservación y Calidad de Alimentos, Facultad de Ingenierı́a, Universidad Nacional de Mar del Plata, Consejo Nacional de Investigaciones Cientı́ficas y Técnicas (CONICET), Juan B. Justo 4302, B7608FDQ, Mar del Plata, Argentina (Received 14 October 2011; Accepted in revised form 21 February 2012) Summary The effect of gamma radiation (0, 1.8, 3.3 and 5.8 kGy) on microbiological, chemical and colour characteristics of vacuum-packed squid (Illex argentinus) mantle rings was studied. Total viable counts; psychrotrophic bacteria counts, Escherichia Coli, Staphylococcus aureus and Clostridium perfringens; total volatile basic nitrogen (TVBN) and colour differenceDE�ab were analysed during 29 days of storage at
  • 2. 4–5 �C. Higher doses of gamma radiation significantly reduced Total Viable, phychrotrophic counts and TVBN production (P < 0.05) in a dose-dependent way, delaying squid spoilage. Colour difference of non- irradiated samples with respect to first day significantly increased while it was constant in radiated samples during 22 days (P < 0.05). Independently from the dose, radiation avoided colour changes of squid rings. Gamma irradiation was effective in delaying deterioration reactions, improving microbiological, chemical and colour quality of vacuum-packed squid rings stored at 4–5 �C. Keywords Colour, Illex argentinus, ionising radiation, microbial activity, quality, refrigeration. Introduction Food irradiation has been widely studied as a food preservation method for the last five decades. It has certainly proved its toxicological safety as well as it efficiency in shelf life extension by decreasing microbial counts. At present, more than 60 countries have approved irradiation of one or more foods (WHO, 1994, 1999, Diehl, 2002; Sommers & Fan, 2006). Nutritional adequacy of irradiated food has also been largely investigated. Irradiation can induce changes in proteins, lipids, carbohydrates and vitamins due mainly to free radicals produced by water radiolysis. However, no significant losses of the nutritional quality of lipid, carbohydrate and protein constituents have been re-
  • 3. ported at irradiation doses intended for food preservation (£10 kGy) (Josephson et al., 1978; Kilcast, 1995; Giroux & Lacroix, 1998; ICGFI, 1999; ADA Report, 2000). Among lipids, polyunsaturated fatty acids (PUFAs) are more sensitive to oxidation by free radicals. The absence of oxygen can minimise this effect, as observed by Kim et al. (2002) in raw beef, turkey and pork meats. Erkan & Özden (2007) concluded that irradiation had only marginal effects on the lipids of fishery products, including the essential alpha-linolenic acid. Abreu et al. (2010) found that irradiation doses up to 6 kGy did not compromise negatively the fatty acid composition, omega three long chain PUFAs and lipid stability of frozen headed shrimps. In proteins, irradiation can promote cleavage of peptide and disulphide bonds as well as aggregation reactions, without drastic changes in the amino acid content. According to various research works, no considerable losses were detected in essential and non- essential amino acids of different food systems (Giroux & Lacroix, 1998; Josephson et al., 1978; Kilcast, 1995; Urbain, 1986). Haddok fillets irradiated with 53 kGy did not show significant differences in their amino acid content (Venugopal et al., 1999). Erkan & Özden (2007) studied the amino acid composition of Sparus aurata irradiated with 2.5 and 5 kGy and observed that, in general, it was slightly increased by gamma irradiation. Vitamins sensitivity to irradiation depends on their solubility in water or fat and the complexity of the food. Vitamins B1 (thiamin), C (ascorbic acid), A (retinol) and E (a-tocopherol) are sensitive to irradiation. Thiamin is considered the most radiation labile water-soluble vita-
  • 4. min. However, it is more sensitive to heat than to irradiation. Alpha-tocopherol is recognised as the most radiation sensitive fat-soluble vitamin (Giroux & Lac- roix, 1998; ICGFI, 1999). *Correspondent: E-mails: [email protected]; [email protected] International Journal of Food Science and Technology 2012, 47, 1550–15571550 doi:10.1111/j.1365-2621.2012.03005.x � 2012 The Authors. International Journal of Food Science and Technology � 2012 Institute of Food Science and Technology Considering the aforementioned, the effects of irradi- ation on the nutritional value of foods are minimal and these observations are substantiated by the results of many feeding studies that have been undertaken to establish the wholesomeness of irradiated food (ICGFI, 1999). Radiation processing benefits on the preservation and microbial quality improvement of fish and seafood have been supported by more than 40 years of scientific studies. Some of these were reviewed by Foley (2006). Doses of 1–3 kGy have been used in fish and of 2–7 kGy in shellfish with satisfactory results in shelf life extension (Kilcast, 1995). Shelf life of Sea bream (Chouliara et al., 2004), Merluccius hubbsi (Lescano et al., 1990) and whole anchovies (Lakshmanan et al., 1999) was im- proved by gamma irradiation, and shelf-stable ready-to- eat shrimps were developed using this technology by
  • 5. Kanatt et al. (2006). Byun et al. (2000) have preserved salted and fermented squid (Todarodes pacificus) by gamma irradiation, but no studies on shelf life improve- ment of fresh minimally processed squid have been made to the moment. In the last decades, the world market of squid has considerably risen, making of the Southwest Atlantic Ocean region one of the most important fishery zones. Illex argentinus is the most abundant squid species of the region, representing the second fishery in volume, after Merluccius hubbsi. It is frequently found between the 52�S and the 35�S over the Argentinean continental platform and slope (Brunetti et al., 1999). In 2006, total marine captures exceeded one million tons, of which squid represented 27.3% (MINAGRI, 2007). Many different squid products are found in the market. Squid tubes and rings are usually treated with polyphosphates solutions that are largely used in the fishery industry to improve water-holding capacity of proteins. This fact benefits the final quality of the product by retaining natural moisture, flavour and nutrients, improving texture and reducing the cooking loss. In addition, phosphates delay lipid oxidation and stabilise colour by quelling enzyme (metal) cofactors (Lampila, 1993; Knipe, 2004; Gonçalves & Duarte Ribeiro, 2008, 2009). After catch, quality of squid decreases because of chemical and microbiological deteriorating reactions. Research has been done on quality of fresh and spoiling squid (Melaj et al., 1997; Lapa-Guimarâes et al., 2002; Paarup et al., 2002a,b; Vaz-Pires et al., 2008). During spoilage, the main chemical change is the gradual accumulation of certain volatile amines in the flesh,
  • 6. which regroup mainly trimethylamine (TMA), dimeth- ylamine (DMA) and ammonia (Huss, 1995). Spoilage is also characterised by the decrease in sensory quality because of changes in squid skin and muscle colour. These colour changes associated with quality loss have been studied by Lapa-Guimarâes et al. (2002) in Loligo plei, by Sungsri-In et al. (2011) in Loligo formosana and by Thanonkaew et al. (2006) in Loligo peali. The objective of this work was to analyse the effect of different gamma radiation doses on microbial activity and colour changes of vacuum-packed squid (Illex argentinus) rings during refrigerated storage. Materials and methods Raw material source, treatment and storage Peeled squid mantle rings of Illex argentinus specimens (width = 1.2 cm approximately.) pretreated with com- mercial polyphosphates solutions were acquired in the port of Mar del Plata (Argentina). They were covered in ice flakes and transported to laboratory in polystyrene containers. Samples of approximately 110 ± 2 g were vacuum packed in Cryovac bags of LDPE and nylon (125 lm) using a packaging machine MINIMAX 430M (SERVIVAC, Argentina). Samples were transported and refrigerated (4 ± 3 �C) to the semi-industrial Eze- iza Atomic Centre facility [National Atomic Energy Commission (CNEA) of Argentina; activity: 600 000 Ci]. They were gamma irradiated with a Cobalt 60 source at 1.8, 3.3 and 5.8 kGy (minimum doses absorbed). Doses were determined with Amber Persex dosimeters. Irradiated and non-irradiated samples (con- trol, 0 kGy) were stored at 4–5 �C for 29 days. Samples
  • 7. were analysed days 0, 1, 5, 8, 12, 15, 19, 22, 26 and 29 after irradiation. Each sample consisted of a 110 ± 2 g bag of vacuum-packed squid rings (approximately 20 squid rings). There were three samples for each day of analysis and each radiation dose. Microbiological analysis The following analyses were performed to monitor bacterial flora changes during refrigerated storage. Ten grams of sample in saline solution (0.85%) with 0.1% w ⁄ v peptone (ICMSF, 1983) made to 100 mL were macerated in a Stomacher 400 Circulator Homogenizer. Microbiological analyses were done in triplicate and expressed as log CFU per gram. The counts of total microorganisms and isolations of particular microbial groups were performed using the following culture media and culture conditions. Psychrotrophic bacteria on plate count agar incu- bated at 7 ± 0.5 �C for 10 days, total viable counts aerobic mesophilic bacteria (TVC) incubating at 35 ± 0.5 �C during 48 h (ICMSF, 1983), coliforms on violet red bile agar incubated at 35 ± 0.5 �C for 24 h (ICMSF, 1983), faecal coliforms in brilliant green bile broth incubated at 44 ± 0.5 �C for 48 h (ICMSF, 1983), and Staphylococcus spp. on Baird-Parker agar incubated at 35 ± 0.5 �C for 48 h (ICMSF, 1983). Coagulase test and manitol salt agar were used for Gamma radiation effect on quality changes A. Tomac and M. I. Yeannes 1551 � 2012 The Authors International Journal of Food Science and Technology 2012
  • 8. International Journal of Food Science and Technology � 2012 Institute of Food Science and Technology identification of S. aureus (ICMSF, 1983). Sulphite- reducing Clostridium on SPS Agar (Merck) was incu- bated in anaerobic jars at 35 ± 0.5 �C and 45 ± 0.5 �C for 48 h (ICMSF, 1983; Pascual & del Rosario, 2000). Colonies were confirmed by motility-nitrate test (IC- MSF, 1983). Total volatile basic nitrogen It was determined by the commercial method for TVBN adapted from the direct distillation method (Giannini et al., 1979). Ten grams of processed squid rings were homogenised with 300 mL of distilled water, 2 mL of antifoaming, porous plate and 5 g of Magnesium oxide. Distillate was collected in 50 mL of boric acid 2% w ⁄ v and 1 mL of indicator (100 mL ethanol, 0.05 g methyl red and 0.075 g bromocresol green) to a final volume of 230 mL. Then, it was titrated with sulphuric acid 0.1 N. TVBN was determined by duplicate. Results were expressed in milligrams of total volatile basic nitrogen per 100 g of wet sample. Colour analysis CIELAB colour space system parameters, (L* = lightness, a* = red (+) and green (-) colour intensity, and b*= yellow (+) and blue (-) colour intensity) were determined with a portable colorimeter (NR-3000; Nipon Denshoku Kogyo Co. Ltd., Tokiyo, Japan). Measurements were made on five rings of each sample. These values were used to calculate colour differences
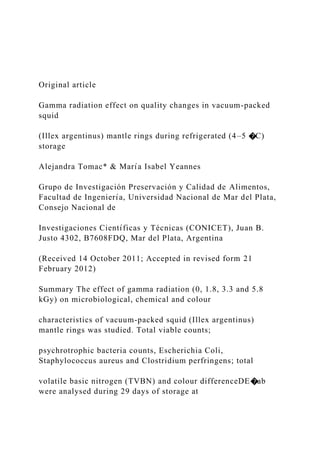
  • 9. DE�ab (C.I.E., 1978) for each storage time analysed with respect to reference (day 1) using DE�ab ¼ ½ðL � � L�rÞ 2 þða� � a�rÞ 2 þðb� � b�rÞ 2�1=2. Statistical analysis Results were analysed by a completely aleatorised design with two main factors: Radiation Dose (0, 1.8, 3.3 and 5.8 kGy) and Days of Storage (0, 1, 5, 8, 12, 15, 19, 22, 26 and 29 days). Interaction between them was also analysed. A two-ways anova test was used with 5% significance level. Tukey test was used to compare means (P < 0.05). The R-Project software was used (R Development Core Team, 2008). Results and discussion Microbiological analysis Total viable aerobic counts of mesophilic bacteria evolution during storage at 4–5 �C for different doses are shown in Fig. 1. Before irradiation was applied, initial TVC of squid rings was 2.12 · 104 ± 6.5 · 102 CFU g)1. In Fig. 1, it can be seen that with doses of 1.8, 3.3 and 5.8 kGy, logarithmic cycle’s reductions of 0.9, 1.6 and 2.2 were achieved in initial TVC, respec- tively, 1 day after irradiation. This fact shows the significant effect of radiation to reduce initial TVC
  • 10. values compared with control, in which TVC increased on day 1 with respect to day 0 (P < 0.05). Initial TVC of control significantly increased up to 9.1 · 107 ± 2.1 · 106 CFU g)1 after 19 days of refriger- ated storage. It was significantly higher than TVC of radiated samples during the whole storage period because its increment was faster than in radiated samples (P < 0.05). TVC of samples radiated with 1.8 kGy significantly increased during 19 days but in a lower rate than it did in control (P < 0.05). Total viable counts of samples radiated with 3.3 kGy significantly increased during 22 days but tended to decrease on days 26 and 29 due possibly to nutrient depletion. At day 19 after radiation, a reduction of one logarithmic cycle was achieved with a dose of 1.8 kGy. With 3.3 and 5.8 kGy, TVC counts were reduced in three and six logarithmic cycles compared with control, respectively. Samples radi- ated with higher doses reached lower viable counts. During storage, samples radiated with 1.8 and 3.3 kGy had a similar tendency to control, showing exponential growth (lower counts with higher dose, as aforementioned). However, samples radiated with 5.8 kGy presented a different behaviour, with decreasing mesophilic counts during storage, reaching a reduction under TVC values of day 1. In samples radiated with 5.8 kGy, TVC values of days 8, 12 and 15 were significantly lower than TVC of days 1 and 5 (P < 0.05). This behaviour was also commented by Kodo (1990) with a dose of 3 kGy in mackerel fillets. Different microbiological counts limits have been sug- gested for different fish and mollusc species, and they vary Figure 1 Total Viable Mesophilic Counts (log CFU g )1 ) evolution in
  • 11. vacuum-packed Illex argentinus rings during storage at 4–5 �C. Standard error represented by bars (n = 3). ND, Not detectable (<10 UFC g )1 ). Gamma radiation effect on quality changes A. Tomac and M. I. Yeannes1552 International Journal of Food Science and Technology 2012 � 2012 The Authors International Journal of Food Science and Technology � 2012 Institute of Food Science and Technology according to many factors, such as, species, sample treatment and storage conditions, among others. Moragas Encuentra & De Pablo Busto (1991) mentioned a limit of 10 6 CFU g )1 for fresh fishery products (dotted line in Fig. 1). In this work, TVC of 10 6 CFU g )1 was found in
  • 12. control at day 8, while with a dose of 1.8 kGy that value was reached after 15 days of storage. It was not reached during 29 days of refrigerated storage with doses of 3.3 and 5.8 kGy, which highest TVC were 5.3 · 105 and 2.3 · 104 CFU g)1, at days 22 and 29 after irradiation, respectively. Considering these values, gamma irradiation extended microbiological shelf life of squid rings in seven and in more than 21 days with respect to control, using doses of 1.8 and 3.3 or 5.8 kGy, respectively. In control Staphylococcus spp. colonies developed on day 8 and after 12, 15 and 19 days in samples radiated with 1.8, 3.3 and 5.8 kGy, respectively. Coliforms were detected on day 5 in control, on day 12 in samples irradiated with 1.8 kGy and on day 19 in samples irradiated with 3.3 kGy. Coliforms were not detected in samples irradiated with 5.8 kGy during 29 days of storage. Gamma radiation reduced the rate of growth of Staphylococcus spp. and coliforms. Pathogens microorganisms investigated (Staphylococ- cus aureus, Clostridium perfringens and Escherichia coli) were not found during the whole storage period, neither in control nor in radiated samples. Gamma radiation significantly reduced TVC counts in a dose-dependent way. During the whole storage period, TVC of control was higher than radiated samples. The higher dose applied the lower bacterial counts found in vacuum-packed Illex argentinus rings (P < 0.05). In Fig. 2, it is shown psychrotrophic bacteria counts evolution during refrigerated storage of control and radiated Illex argentinus rings.
  • 13. Initial psychrotrophic counts were 2.8 · 104 ± 4.6 · 10 2 CFU g )1 . One day after radiation, logarithmic cycle’s reductions of 1, 1.8 and 3.4 were achieved with 1.8, 3.3 and 5.8 kGy, respectively; meanwhile, psychro- trophic counts of control increased in the same period. After radiation induced initial counts reduction, psy- chrotrophic counts of samples 0, 1.8 and 3.3 kGy significantly increased up to 3.9 · 109 ± 1.3 · 108, 1.8 · 10 8 ± 2.1 · 106 and 5.1 · 105 ± 2.1 · 104 CFU g)1, respectively, during 19 days of refrigerated storage (P < 0.05). In samples radiated with 5.8 kGy, colonies were not detected at days 1, 5 and 8 after radiation, but after that period counts significantly increased up to 1.4 · 104 ± 1.5 · 102 CFU g)1 on day 19. Psychrotrophic counts for control were significantly higher than 1.8, 3.3 and 5.8 kGy during the whole storage period after irradiation was applied. Psychro- trophic counts of samples radiated with 1.8 kGy were significantly higher than 3.3 kGy and 5.8 kGy. Samples radiated with 3.3 kGy had significantly higher counts than 5.8 kGy during 29 days of refrigerated storage (P < 0.05). Statistical results indicated that gamma radiation significantly reduced psychrotrophic counts in a dose-dependent way (P < 0.05).
  • 14. Even when a dose of 1.8 kGy was enough to reduce microbial counts compared with control, with doses of 3.3 and 5.8 kGy, this effect was more important. At day 19 a 1, 3.8 and 5.5 logarithmic cycle reduction in psychrotrophic bacteria counts were achieved with 1.8, 3.3 and 5.8 kGy, respectively. With a dose of 1.8 kGy, bacterial counts were lowered but no more than in one logarithmic cycle; therefore, higher doses could be more useful to extend squid rings microbiological shelf life. Psychrotrophic bacteria counts after 19 days of refrigerated storage were higher than mesophilic counts in all samples. According to Huss (1994), psychrotroph- ic bacteria are particularly the major group of microor- ganisms responsible for spoilage of fresh seafood. Refrigeration temperatures favour their growth, and so they were at an adequate temperature range to growth during storage conditions of this work. Initial TVC and psychrotrophic counts reductions because of gamma radiation found in this work are in accordance with Kodo (1990), who explains the radia- tion induced initial counts reduction by the inhibition of predominant bacteria and a subsequent growth of more radio resistant species that were initially limitated by the others. Similar results were found by Byun et al. (2000) who found that increasing radiation doses lowered initial viable cell populations in fermented Todarodes pacificus and that a dose of 5 kGy helped to improve microbiological quality of 10% NaCl salted squid. Like in this work, Lakshmanan et al. (1999) observed a reduction in TVC because of gamma radiation in whole anchovies irradiated at 2 kGy. Also Kanatt et al. (2006) found lower counts at higher doses in marinated
  • 15. Figure 2 Psychrotrophic bacteria counts (log CFU g )1 ) evolution in vacuum-packed Illex argentinus rings during storage at 4–5 �C. Standard error represented by bars (n = 3). ND, Not detectable (<10 UFC g )1 ). Gamma radiation effect on quality changes A. Tomac and M. I. Yeannes 1553 � 2012 The Authors International Journal of Food Science and Technology 2012 International Journal of Food Science and Technology � 2012 Institute of Food Science and Technology precooked shrimps, using gamma irradiation at doses of 1, 2.5 and 5 kGy. Goldblith (1971) has explained that ionising radiation inactivates microorganisms by direct and indirect action. In direct action, it damages cells’ DNA in living organisms by an ionising particle or ray. In indirect action, the products of radiolysis, usually of water in most foods, affect the cell. Brewer (2009) also explains that free radicals generated by radiation can damage the DNA of growing cells, accomplishing a 90% reduction in spoilage bacteria with 1–1.5 kGy. According to microbiological analyses carried out in this work on vacuum-packed Illex argentinus mantle
  • 16. rings during refrigerated storage, gamma radiation was useful for reducing mesophilic, psychrotrophic, coli- forms and Staphylococcus spp. bacterial counts in a dose-dependent way. Higher doses extended the storage period in which squid rings reached suggested microbial counts limits. The effect of 3.3 and 5.8 kGy of shelf life extension was more important than the one achieved with 1.8 kGy. Figures aforementioned support the feasibility of extending microbiological shelf life of vacuum-packed squid rings by gamma radiation. Total volatile basic nitrogen One of the most widely used parameters to evaluate fish freshness is total volatile basic nitrogen (TVBN) that includes the measurement of TMA, DMA and ammonia (Huss, 1995). Woyewoda & Ke (1980) recommended the use of TVBN as a laboratory test for squid quality assessment. In this work, it was used as a freshness indicator of squid rings. In Fig. 3, it is shown its evolution in squid rings during storage at 4–5 �C for different doses applied. TVBN initial mean value was 15.16 ± 0.16 mg per 100 g. TVBN values of control and radiated squid rings showed an increasing behav- iour during refrigerated storage, but the rate of TVBN accumulation was different depending on the radiation dose and the storage time. It was inverse to the dose applied (i.e. with higher doses, lower TVBN values were reached), and it was considerably accelerated after 5 days of storage in non-radiated samples, increasing exponentially. Meanwhile, it took 8 and 12 days to reach the TVBN accelerated accumulation phase in samples radiated with 1.8 and 3.3 kGy, respectively. In samples radiated with the higher dose (5.8 kGy), TVBN
  • 17. increased only linearly with time and did not reach an exponential phase during 22 days. TVBN values were significantly higher for samples radiated with 0, 1.8, 3.3 and 5.8 kGy, respectively, from day 8 after irradiation until day 22 (P < 0.05). With 1.8, 3.3 and 5.8 kGy, TVBN reductions of 52%, 69% and 86% were achieved with respect to control on storage day 15, respectively. Alur et al. (1994) found a 50% to 60% reduction in total volatile bases in irradiated fish flesh compared with non-irradiated sam- ples. Gamma irradiation delayed squid spoilage with high- er radiation doses decreasing TVBN production (Fig. 3) in accordance with microbiological results. Gamma radiation has been reported to have little effect on enzymatic systems but to have a considerable microcidal effect (Kodo, 1990; Ahn & Lee, 2006). Hwang & Hau (1995) studied the residual activity of proteolytic enzymes [Ca 2+ dependent proteases (CDP) and Catepsyn D] in irradiated chicken. These proteases are considered responsible of meat deterioration. They found that irradiation doses up to 50 kGy did not affect the activity of Catepsyn D. CDP activity decreased with increasing irradiation dose, but it was not fully inacti- vated. According to Urbain (1986), lipolytic enzymes involved in the endogenous hydrolysis of phospholipids and neutral lipids were not fully inactivated by an irradiation dose of 50 kGy.
  • 18. The microcidal effect was observed in this work (3.1). Lower microorganism counts would imply a decrease in TMA production leading to a reduction in the rate of TVBN accumulation, also detected in this study. TVC and psychrotrophic counts evolution correlated in a good way with TVBN results, because exponential TVBN production was related to high bacterial counts. In samples radiated with 5.8 kGy (which presented better microbial and chemical parameters), TVC and psychrotrophic counts of 9.5 · 101 and 1.0 · 104 CFU g)1were found, respectively, at day 19 and this samples never reached exponential TVBN production phase. Higher doses implied lower microor- Figure 3 Total volatile basic nitrogen (TVBN) (mg per 100 g squid rings) evolution during storage at 4–5 �C for the different radiation doses (kGy). Same letters (a, b, c, d, e, f) indicate non- significant differences in time for the same dose. TVBN values with same Capital letters are not significantly different between doses (Tukey Test, P < 0.05). Bars represent standard error. Gamma radiation effect on quality changes A. Tomac and M. I. Yeannes1554 International Journal of Food Science and Technology 2012 � 2012 The Authors
  • 19. International Journal of Food Science and Technology � 2012 Institute of Food Science and Technology ganisms counts that lead to a retard in TMA accumu- lation and hence a slowed down TVBN production rate. The last day of analysis, day 22, TVBN of control, 1.8, 3.3 and 5.8 kGy was 152.3 ± 5.0; 133.9 ± 3.0; 79.8 ± 3.3 and 29.2 ± 2.4 mg per 100 g, respectively. According to the scale established by Woyewoda & Ke (1980) for squid (Illex illecebrosus), the quality of squid can be considered excellent when TVBN is below 30 mg per 100 g; meanwhile, it is considered unacceptable when TVBN is higher than 45 mg per 100 g. Also, 30 mg per 100 g is the value established as limit of acceptance in most of commercial transactions. In this study, higher radiation doses permitted to maintain an excellent quality during a longer storage period, by increasing the time at which TVBN reached a value of 30 mg per 100 g. Quality of control sample was consid- ered excellent during 6 days, while samples radiated with 1.8, 3.3 and 5.8 kGy during 9, 12 and 22 days, respectively. This results would show the efficiency of gamma radiation to delay squid spoilage and thus to increase its shelf life. Colour Colour changes were analysed for being associated with spoilage reactions. In Fig. 4, it is shown the evolution of colour difference DE�ab of vacuum-packed Illex argenti-
  • 20. nus mantle rings during storage at 4–5 �C. Colour difference of control significantly (P < 0.05) increased during storage, reaching a value of 14.67 on day 22. For all treated samples, there were no significant differences of DE�abduring the 22 days of storage at 4–5 �C (P > 0.05). Values of DE�ab were practically constant ranging between 1.96 and 3.81 for radiated samples during the whole storage period. After day 8, DE�ab of control was significantly higher than all radiated sam- ples until the end of the analyses period (P < 0.05). Mean value of L* on the first day was 52.7 ± 0.6. L* significantly increased to 63.2 ± 1.9 in control sample until day 22. Meanwhile, in irradiated samples, L* only reached a mean value 54.7 ± 0.7 for doses 1.8, 3.3 and 5.8 kGy. L* of non-irradiated samples was significantly higher than irradiated samples since day 5 (P < 0.05). There were no significant differences in L* on day 22 between irradiated samples (P > 0.05). Sugiyama et al. (1989) informed that after capture of squid, the trans- parency of its meat is gradually lost and squid meat becomes tinged white (related with L* increase). The first day, b* mean value was )6.5 ± 0.9. In control sample, b* significantly increased to )3.3 ± 1.2 (day 22), while it remained almost unchanged in irradiated samples during the whole storage period, reaching a mean value of )6.2 ± 0.2 on day 22. There were no significant differences between irradiated sam- ples (P > 0.05) at the end of the storage period. Increases in b* have been informed during squid spoilage. Thanonkaew et al. (2006) mentioned an increase in b* in Loligo peali, associated with an increase in yellowness because of deterioration and lipid oxida- tion products reactions. They suggested that yellow
  • 21. pigmentation in squid mantle could be due to non- enzymatic browning reactions between products of aldehydic lipid oxidation and the amines of phospho- lipids head groups. Mean value of a* was )2.7 ± 0.8 on the first day of storage. Values of a* decreased in control to )4.8 ± 0.7 (day 22), but there were not significant differences during storage time for all irradiated samples (P > 0.05). Mean value for samples irradiated with 1.8, 3.3 and 5.8 kGy was )2.3 ± 0.4 on day 22, without significant differences among them (P > 0.05). During spoilage of squid, an increase in a* has been informed by Sungsri-In et al. (2011) because of pink spots formation. In this work, a* tended to decrease in control due probably to the previous skinning of squid and the use of polyphosphates that have been reported to improve colour characteristics of fish products. Gamma irradiation avoided colour changes of squid rings. It permitted to keep colour parameters almost unchanged during 22 days of storage at 4–5 �C in squid rings. Meanwhile, colour parameters of control signif- icantly changed during storage, with an increase in b* and L* and a decrease in a* values. These changes in control can be explained by the loss of quality because of deteriorating reactions. According to results found in this work, gamma irradiation would avoid colour Figure 4 Squid rings Color Difference with respect to day 1 during storage at 4–5 �C. Standard error represented by bars. Different letters (a, b, c) indicate significative differences in time for control. Values
  • 22. with * are significantly different between doses. No significant differences during storage time were found for all radiated samples (Tukey Test, P < 0.05, n = 3). Gamma radiation effect on quality changes A. Tomac and M. I. Yeannes 1555 � 2012 The Authors International Journal of Food Science and Technology 2012 International Journal of Food Science and Technology � 2012 Institute of Food Science and Technology changes because of deteriorating reactions in squid rings, without changing their characteristic colour. Conclusions Gamma irradiation permitted to improve microbiolog- ical quality of vacuum-packed squid rings, lowering bacterial populations, reducing immediately after radi- ation the TVC and psychrotrophic counts and slowing down coliforms and Staphylococcus spp. growth. A dose-dependent reduction was observed, reaching lower counts with higher doses. TVBN production during storage at 4–5 �C was lower at higher doses, indicating a deterioration delay, in accordance with microbiological results. With higher doses, linear phase of TVBN evolution was extended, delaying exponential phase related to bacterial growth. Gamma radiation avoided
  • 23. colour changes in vacuum-packed squid mantle rings during 22 days of storage at 4–5 �C, while colour significantly changed in non-irradiated sample. Gamma irradiation helped to delay deterioration reactions that lead to quality loss of minimally processed vacuum- packed Illex argentinus rings, extending microbiological shelf life. Acknowledgments This work was supported by UNMDP (Projects 15 ⁄ G206 ⁄ 07 and 15 ⁄ G264 ⁄ 09) and Consejo Nacional de Investigaciones Cientı́ficas y Técnicas (CONICET, PIP 5052), and the authors are grateful to these Institutions. Authors are especially thankful to Mrs. Irene Ameztoy for her collaboration with microbiolog- ical analysis, and to Patricia Narvaiz for her assistance at CNEA Ezeiza Atomic Center. References Abreu, V.K.G., Pereira, A.L.F., Vidal, T.F., Zapata, J.F.F., Sousa Neto, M.A. & Freitas, E.R. (2010). Fatty acids, cholesterol, oxidative rancidity, and color of irradiated shrimp. Ciencia y Tecnologı́a de Alimentos, Campinas, 30, 969–973. ADA Report (2000). Position of the American Dietetic Association: food Irradiation. Journal of the American Dietetic Association, 100, 246–253. Ahn, D.U. & Lee, E.J. (2006). Mechanisms and prevention of quality changes in meat by irradiation. In Food Irradiation Research
  • 24. and Technology. (edited by C.H. Sommers. & X. Fan). Pp. 127–142. IFT Press, Blackwell Publishing: Oxford, UK. Alur, M.D., Warier, S.B., Doke, S.N. & Nair, P.M. (1994). Role of bacterial proteolysis in the spoilage of irradiated flesh foods. Journal of Food Biochemistry, 17, 419–435. Brewer, M.S. (2009). Irradiation effects on meat flavour: a review. Meat Science, 81, 1–14. Brunetti, N.E., Ivanovic, M.L. & Sakai., M. (1999). Calamares de importancia comercial en la Argentina. Biologı́a, distribución, pesquerı́as, muestreo biológico. Pp. 45. Argentina: Instituto Nac- ional de Investigación y Desarrollo Pesquero (INIDEP), Mar del Plata. Byun, M.-W., Lee, K.-H., Kim, D.-H., Kim, J.-H., Yook, H.-S. & Ahn, H.-J. (2000). Effects of gamma radiation on sensory qualities, microbiological and chemical properties of salted and fermented squid. Journal of food protection, 63, 934–939. Chouliara, I., Savvaidis, I.N., Panagiotakis, N. & Kontominas, M.G. (2004). Preservation of salted, vacuum-packed, refrigerated sea bream (Sparus aurata) fillets by irradiation: microbiological, chem- ical and sensory attributes. Food Microbiology, 21, 351–359.
  • 25. C.I.E. (1978) Recommendations on uniform colour spaces, colour difference equations, psychometric colour terms. CIE publication No.15 (E.-1.3.1) 1971, Supplement No.2. Viena. Diehl, J.F. (2002). Food irradiation – past, present and future. Radiation Physics and Chemistry, 63, 211–215. Erkan, N. & Özden, Ö. (2007). The changes of fatty acid and amino acid compositions in sea bream (Sparus aurata) during irradiation process. Radiation Physics and Chemistry, 76, 1636–1641. Foley, D.M. (2006). Irradiation of Seafood with a particular emphasis on Listeria Mocytogenes in ready-to-eat products. Charpter 11, In Food Irradiation Research and Technology. (Edited by C.H. Som- mers & X. Fan). Pp. 185–197. IFT Press, Blackwell Publishing, Oxford, UK. Giannini, D.H., Davidovich, L.A. & Lupı́n, H.M. (1979). Adaptación del método comercial para la determinación de Nitrógeno básico Volátil en merluza (Merluccius Hubbsi). Revista de Agroquı́mica y Tecnologı́a de Alimentos, 19, 55–60. Giroux, M. & Lacroix, M. (1998). Nutritional adequacy of irradiated meat – a review. Food Research International, 31, 257–264.
  • 26. Goldblith, S.A. (1971). In: The inhibition and destruction of the microbial cell by radiation, in Inhibition and Destruction of the Microbial Cell (edited by W.B. Hugo). Pp. 285–305. London: Academic Press. Gonçalves, A.A. & Duarte Ribeiro, J.L. (2008). Optimization of the freezing process of red shrimp (Pleoticus muelleri) previously treated with phosphates. International Journal of refrigeration, 31, 1134– 1144. Gonçalves, A.A. & Duarte Ribeiro, J.L. (2009). Effects of phosphate treatment on quality of red shrimp (Pleoticus muelleri) processed with cryomechanical freezing. LWT – Food Science and Technolog, 42, 1435–1438. Huss, H.H. (1994). Assurance of seafood quality. FAO fisheries technical paper 334, Rome: FAO. Huss, H.H. (1995). Quality and quality changes in fresh fish. FAO Fisheries Technical Paper – 348. Food and agriculture organization of the United Nations, http://www.fao.org/docrep/V7180E/ V7180e09.htm. Hwang, H.I. & Hau, L.B. (1995). Effect of ionizing radiation on the enzyme activities and ultrastructural changes of poultry. Radiation Physics and Chemistry, 46, 713–716.
  • 27. ICGFI (1999). Facts about food irradiation. International Consulta- tive Group on Food Irradiation. Joint FAO ⁄ IAEA Division of Nuclear Techniques in Food and Agriculture. International Atomic Energy Agency. http://www.iaea.org/Publications/Booklets/foodir- radiation.pdf. Visited on January 2012. ICMSF (1983). Microorganismos de los alimentos. Técnicas de análisis microbiológico. Ed. Spain: Acribia. Josephson, E.S., Thomas, M.H. & Calhoun, W.K. (1978). Nutritional aspects of food irradiation: an overview. Journal of Food Processing and Preservation, 2, 299–313. Kanatt, S.R., Chawla, S.P., Chander, R. & Sharma, A. (2006). Development of shelf-stable, ready-to-eat (RTE) shrimps (Penaeus indicus) using gamma irradiation as one of the hurdles. LWT – Food Science and Technology, 39, 621–626. Kilcast, D. (1995). Food irradiation: current problems and Future Potential. International Biodeterioration & Biodegradation, 36, 279– 296. Kim, Y.H., Nam, K.C. & Ahn, D.U. (2002). Volatile profiles, lipid oxidation and sensory characteristics of irradiated meat from
  • 28. different animal species. Meat Science, 61, 257–265. Gamma radiation effect on quality changes A. Tomac and M. I. Yeannes1556 International Journal of Food Science and Technology 2012 � 2012 The Authors International Journal of Food Science and Technology � 2012 Institute of Food Science and Technology Knipe, L. 2004. Use of phosphates in meat products. Presented in the Meat Industry Research Conference. October 2nd. Nashville. TN: http://scholar.google.com.ar/scholar_url?hl=es&q=http://www3. unileon.es/personal/wwdhtjmo/MANDEFEC/docencia/Doccarne/ usodefosfatos.doc&sa=X&scisig=AAGBfm3gU7ZXN3oe8uYNt WHvh7MN71cZxw&oi=schol. Visited on February 2011. Kodo, J.-L. (1990). L‘ionisation des produits de la pêche. Collection « Valorisation des produits de la mer » ISSN: 0998-4089. ISBN 2905434260. Ifremer. http://archimer.ifremer.fr/doc/00000/649/. Visited on January 2011. Lakshmanan, R., Venugopal, V., Venketashvaran, K. & Bongirwar, D.R. (1999). Bulk preservation of small pelagic fish by gamma irradiation: studies on a model storage system using Anchovies. Food Research International, 32, 707–713. Lampila, L.E. 1993. Polyphosphates: rationale for use and function-
  • 29. ality in seafood and seafood products. In: Proceedings of the 18th annual tropical and subtropical fisheries technological conference of the Americas. Pp. 13–20). VA, USA. Lapa-Guimarâes, J., Acevedo da Silva, M.A., Eduardo de Felicio, P. & Contreras Guzmán, E. (2002). Sensory, colour and psychrotrophic analyses of squids (Loligo plei) during storage in ice. LWT – Food Science and Technology, 35, 21–29. Lescano, G., Kairiyama, E., Narvaiz, P. & Kaupert, N. (1990). Studies on quality of radurized (Refrigerated) and non-radurized (frozen) Hake (Merluccius merluccius hubbsi). LWT - Food Science and Technology, 23, 317–321. Melaj, M.A., Sánchez-Pascua, G.L., Casales, M.R. & Yeannes, M.I. (1997). Aspectos a considerar en la evaluación de la frescura del calamar (Illex argentinus). Alimentaria Mayo, 97, 93–96. MINAGRI. (2007). Ministerio de Agricultura, Ganaderı́a y Pesca. Subsecretarı́a de Pesca y Acuicultura Pesquerı́as de Calamar y Langostino. Situación actual. Presidencia de la Nación. Argentina. Moragas Encuentra, M. & De Pablo Busto, M.B.(1991). Recopilación de normas microbiológicas de los alimentos y asimilados y otros
  • 30. parámetros fı́sico-quı́micos de interés sanitario. Actualized on January 2008. BOE 15 ⁄ 08 ⁄ 91. Paarup, T., Sanchez, J.A., Moral, A., Christensen, H., Bisgaard, M. & Gram, L. (2002a). ensory, chemical and bacteriological changes during storage of iced squid (Todaropsis eblanae). Journal of Applied Microbiology, 92, 941–950. Paarup, T., Sanchez, J.A., Peláez, C. & Moral, A. (2002b). Sensory, chemical and bacteriological changes in vacuum-packed pressurised squid mantle (Todaropsis eblanae) stored at 4�C. International Journal of Food Microbiology, 74, 1–12. Pascual, A. & del Rosario, M. (2000). Microbiologı́a alimentaria: metodologı́a analı́tica para alimentos y bebidas. Ed. Madrid. Spain: Dı́az de Santos, ISBN: 978-84-7978-424-9. R Development Core Team (2008). R: a language and environment for statistical computing. Vienna, Austria: R Foundation for Statistical Computing, ISBN 3-900051-07-0, URL http://www.R- project.org. Sommers, C.H. & Fan, X. (2006). Food Irradiation Research and Technology. IFT Press: Blackwell Publishing. Sugiyama, M., Kòusu, S., Hanabe, M. & Okuda, Y. (1989). Utilization of Squid. A. Balkema ⁄ roterdam. ISBN 90 6191 479 5.
  • 31. Sungsri-In, R., Benjakul, S. & Kijroongrojana, K. (2011). Pink discoloration and quality changes of squid (Loligo formosana) during iced storage. LWT – Food Science and Technology, 44, 206– 213. Thanonkaew, A., Benjakul, Z., Visessanguan, W. & Decker, E.A. (2006). Development of yellow pigmentation in squid (Loligo peali) as a result of lipid oxidation. Journal of Agricultural and Food Chemistry, 54, 956–962. Vaz-Pires, P., Seixas, P., Mota, M. et al. (2008). ensory, microbiolog- ical, physical and chemical properties of cuttlefish (Sepia officinalis) and broadtail shortfin squid (Illex condecti) stored in ice. LWT- Food Science and Technology, 41, 1655–1664. Venugopal, V., Doke, S.N. & Thomas, P. (1999). Radiation processing to improve the quality of fishery products. Critical Reviews in Food Science and Nutrition, 39, 391–440. WHO. (1994). In Safety and nutritional adequacy of irradiated food. pp. 81–107. Geneva, Switzerland: World Health Organization. WHO (1999). High-dose irradiation: Wholesomeness of food irradiated with doses above 10 kGy. Geneva: WHO Technical Report Series
  • 32. 890. Woyewoda, A.D. & Ke, P.J. (1980). Laboratory quality assessment of Canadian Atlantic Squid (Illex illecebrosus) Fisheries and Marine Service Technical Report No 902. Department of Fisheries and Oceans Field Services Branch, Inspection Division Research Sec- tion, Halifax Nova Scotia, B3J 2S7. Gamma radiation effect on quality changes A. Tomac and M. I. Yeannes 1557 � 2012 The Authors International Journal of Food Science and Technology 2012 International Journal of Food Science and Technology � 2012 Institute of Food Science and Technology Innovative Food Science and Emerging Technologies 27 (2015) 48–56 Contents lists available at ScienceDirect Innovative Food Science and Emerging Technologies journal homepage: www.elsevier.com/locate/ifset The effect of thermal pasteurization and high pressure processing at cold and mild temperatures on the chemical composition, microbial and enzyme activity in strawberry purée
  • 33. Krystian Marszałek a,⁎, Marta Mitek b, Sylwia Skąpska a a Department of Fruit and Vegetable Product Technology, Prof. Wacław Dąbrowski Institute of Agricultural and Food Biotechnology, 36 Rakowiecka str., 02532 Warsaw, Poland b Division of Fruit and Vegetable Technology, Department of Food Technology, Faculty of Food Science, Warsaw University of Life Science, 161 Nowoursynowska str., 02787 Warsaw, Poland ⁎ Corresponding author. E-mail address: [email protected] (K. Marsz http://dx.doi.org/10.1016/j.ifset.2014.10.009 1466-8564/© 2014 Elsevier Ltd. All rights reserved. a b s t r a c t a r t i c l e i n f o Article history: Received 15 July 2014 Accepted 21 October 2014 Available online 5 November 2014 Editor Proof Recieve Date 17 November 2014 Keywords: High pressure processing Thermal processing Strawberries Polyphenols Polyphenol oxidase Peroxidase The impact of high pressure processing (HPP) at 300 or 500 MPa for 1, 5 or 15 min at 0 or 50 °C and thermal pro- cessing (TP) at 90 °C for 15 min on the quality of strawberry purée was studied. TP caused the highest degrada- tion of polyphenols (14%), anthocyanins (43%), vitamin C (61%) and color (dE N 3) but only this method
  • 34. effectively decreased the activity of polyphenol oxidase — PPO (97.7%), peroxidase — POD (99.5%) and microor- ganism count (b1 log cfu/g). The highest decrease of the mentioned nutrients (4%, 14%, 30%, respectively) in HPP-treated samples was noticed at 500 MPa/15 min/50 °C, whereas color changes were unnoticeable (dE b 3) and enzymes were inactivated only in 72% (PPO) and 50% (POD). Counts of yeasts and molds were re- duced to b1 log cfu/g only after TP and HPP at 500 MPa. HPP preservation at 0 °C affects the content of nutrients and color to the least extent. Industrial relevance: This study demonstrated that the nutritional and sensory qualities of strawberry purée after high pressure processing were much better than after thermal pasteurization. Purée treated with HPP at 0 °C did not show significant difference compared to fresh strawberry purée. Greater inactivation of PPO and POD was ob- served after thermal pasteurization, but this treatment caused also slightly more degradation of anthocyanins, vi- tamin C and sensory quality. The results showed that HPP might be a useful method for preservation of strawberry products. However, considering the residual enzyme activity, it will be a very important point to check the stability of the products during storage. © 2014 Elsevier Ltd. All rights reserved. 1. Introduction In recent years, there has been a significant increase in consumer in- terest in the quality and safety of foods (Boero, 2011; Wilke, Raab, Breuer, Hamer, & Peterson, 2013). Nowadays consumers demand top- quality food, which is safe to eat and which promotes bodily health
  • 35. and well-being. High quality food is usually associated with, e.g., its nat- uralness and freshness (Bigliardi & Galati, 2013; Farahani, Grunow, & Günther, 2012; Khan, Grigor, Winger, & Win, 2013). Many fruit and veg- etable products available on the market are however, highly- processed, such as clear juices, nectars, jams and preserves. The high temperature used for their processing and preservation (pasteurization, sterilization, blanching) results in undesirable changes in their organoleptic features (flavor, color, texture) and often in considerable losses in their valuable bio-active components, such as vitamin C and polyphenols, including anthocyanin pigments (Kalisz, Oszmiański, Hałdyszowski, & Mitek, 2013; Tiwari, O'Donnell, & Cullen, 2009; Verbeyst, Bogaerts, Plancken, ałek). Hendrickx, & Loey, 2013; Verbeyst, Oey, Plancken, Hendrickx, & Loey, 2010). Therefore, there is a growing interest in developing innovative, non- thermal methods of preserving fruit and vegetable products, such as high pressure processing (HPP), which can ensure product safety, with limited impact on the nutritional and organoleptic quality of the raw material used.
  • 36. An important factor, which should be taken into consideration when preserving fruit products with HPP, is the process temperature. High pressure coupled with elevated processing temperatures of over 20 °C could have a negative effect on the content of anthocyanin pigments, whereas treatment at less than 20 °C usually has no significant impact on their level (Corrales, Toepfl, Butz, Knorr, & Tauscher, 2008; Garcia-Palazon, Suthanthangjai, Kajda, & Zabetakis, 2004). The color of fruit products preserved using HPP without heating often seems even more intense, and therefore more attractive, due to the extraction of an- thocyanins and flavonols from the tissues to intercellular juice (Marigheto, Vial, Wright, & Hills, 2004; Otero & Prestamo, 2009). It seems interesting that cold high pressure processing (at ca. 0 °C) could be more effective for the inactivation of bacterial spores compared with the same process at room temperature. Generally, lower http://crossmark.crossref.org/dialog/?doi=10.1016/j.ifset.2014.1 0.009&domain=pdf http://dx.doi.org/10.1016/j.ifset.2014.10.009 mailto:[email protected] http://dx.doi.org/10.1016/j.ifset.2014.10.009 http://www.sciencedirect.com/science/journal/14668564 49K. Marszałek et al. / Innovative Food Science and Emerging
  • 37. Technologies 27 (2015) 48–56 temperatures raise the costs of the process but cause fewer changes in the chemical composition of foods (Heinz & Buckow, 2009). Strawberries are considered a fruit with special health- promoting properties, because they contain many valuable antioxidants, e.g., vitamin C and polyphenols (anthocyanins and phenolic acids). The preventive role of polyphenols has already been proved against, e.g., cancer, cardiovascular diseases, arthritis or type 2 diabetes (Blumberg, 2003; Kaur & Kapoor, 2001; Terefe et al., 2013). A particular- ly valuable compound in strawberries, with proven anticancer proper- ties, is ellagic acid (Seeram, Lee, Scheller, & Heber, 2004). Ellagic acid is present both in the flesh and seeds (Klimczak, Rozpara, & Król, 2011), therefore strawberry products, e.g. purée, obtained using waste-free technology, have a full range of the bioactive compounds present in the fruits. Pelargonidin-3-glucoside, the main strawberry an- thocyanin, as well as other phenolics and vitamin C are thermolabile compounds (Terefe, Matthies, Simons, & Versteeg, 2009), so the use of non-thermal methods for preserving strawberry products is particularly reasonable. The results of studies on the influence of HPP on strawberry poly-
  • 38. phenols reported by different authors are inconsistent. Ferrari, Marcesca, and Ciccarone (2011) and Patras, Brunton, Pieve, and Butler (2009) reported that polyphenol levels in pressure-treated strawberry purée increased significantly, Terefe et al. (2013) observed a significant decrease in these compounds, while Cao et al. (2011) claimed that it showed no significant effect. Our preliminary studies with juices and nectars from ‘Senga Sengana’ strawberries – the popular cultivar in Poland – showed that the commercially used parameters for HPP, 300 and 500 MPa at mild temperature, caused a small decrease in the poly- phenol content and color parameters of the products (Marszałek, Mitek, & Skąpska, 2011). The inactivation of enzymes is of key significance to the storage sta- bility of HPP-preserved strawberry products. Terefe, Yang, Knoerzer, Buckow, and Versteeg (2010) showed that neither thermal processing nor combined HPP–heat treatment could effectively inactivate polyphe- nol oxidase (PPO) and peroxidase (POD) in strawberry purée, even at 90 °C. Other authors showed that optimal inactivation (25%) of straw- berry POD was achieved using 230 MPa and 43 °C, and the best results in PPO inactivation (60%) were observed at 250 MPa. Some
  • 39. activation was observed for treatment carried out in 250–400 MPa for both en- zymes (Cano, Hernandez, & De Ancos, 1997). Cao et al. (2011) reported a 51.5 and 56.5% reduction in PPO and POD activity respectively in strawberry pulp after 600 MPa and 25 min at room temperature. The studies presented on the use of HPP as a means of preserving strawberry products were based on a different matrix — different kinds of products, obtained with different fruit varieties, e.g. ‘Festival’, ‘Aroma’, ‘Elsanta’, ‘Pajaro’, ‘Camarosa’ and ‘Rubygem’. Therefore quality indicators are difficult to compare. As can be concluded from this re- view, there is no data available on the preservation of strawberry prod- ucts with HPP at near-zero temperatures and the reported effects of HPP at mild and high temperatures on the quality of strawberry products are ambiguous. Therefore the purpose of this study was to evaluate the im- pact of HPP at low and mild temperatures on the overall quality of strawberry purée, including the inactivation of native microflora and enzymes (PPO and POD), changes in the total and individual phenolic compounds and vitamin C content, as well as color parameters and the sensory quality.
  • 40. 2. Materials and methods 2.1. Production of strawberry purée Strawberries, cv. ‘Senga Sengana’ cultivar, were harvested at the end of June 2010 and pre-treated (washing, destalking, freezing) at “Ulmer” Sp.j. company (Stare Zadybie, Poland). After freezing in a fluidization tunnel (UniDex, Poland), the strawberries were sorted (Niagara Sortex, Bühler, Switzerland) according to color and size (45–55 mm) and stored at −24 °C. After defrosting (at 4 °C), they were mashed up in a food processor (CL-30, Robot Coupe, France). The resultant semi- liquid strawberry pulp was homogenized (Mz-50, Fryma, Switzerland, Ø ≤ 0.5 mm) and deaerated at 0.06 MPa (LVE, Fryma, Switzerland). The product temperature did not exceed 0 °C throughout the whole processing procedure. This strawberry purée was used as a control sam- ple (CS). 2.2. Preservation of strawberry purée 2.2.1. High hydrostatic pressures (HPP) Samples were preserved in a pressure chamber (ca. 1500 mL in vol- ume and 110 mm in diameter, Izopress, Moscow, Russia), filled with a
  • 41. water/propylene glycol mixture (50:50, v/v) and equipped with a heating/cooling jacket (operating temperature range of 0–50 °C). Pres- sure inside the chamber was measured directly with a manometer with a pressure transducer (type EBM 6045-700, KGT Kramer). The pressure and temperature parameters were registered using a thermocouple and manometer located in the pressure medium and processed via a data collection computer system (Memory Card MMC, Metronic System MPI-L version 1.11., Kraków, Poland). Strawberry purée was processed in low density polyethylene bottles (PE-LD, 50 mL), without access to air. The process was run using various parameters, i.e., pressure: 300 or 500 MPa; time of sample exposure to pressure: 1, 5 or 15 min; and temperature: 0 or 50 °C (omitting 500 MPa, 5 min at 50 °C). Pressure of up to each 100 MPa was generated in 3 s; the release time was 1 s for each 100 MPa. The temperature increase during pressurization mea- sured in the chamber, was 2 °C for each 100 MPa. 2.2.2. Pasteurization (TP) The purée was pasteurized in 100-mL glass jars in a stainless steel, gas-heated bath pasteurizer. Process parameters of 90 °C for 15 min as-
  • 42. sured the microbial stability of the purée (Marszałek et al., 2011). The time and temperature data were recorded with a monitoring– measur- ing device (9004, Ellab, Denmark) designed for measuring the temper- ature inside a package and of the heating medium during the course of the process. 2.3. Chemical reagents The following standards were used in the study: p- hydroxybenzoic acid (p-HBA), ellagic acid (EA), quercetin (Q), kaempferol (K), pelargonidin-3-glucoside (Pg-3-Glc) and cyanidin-3-glucoside (Cy-3- Glc) of HPLC purity (Extrasynthese, France), L-ascorbic acid (AA) of HPLC purity (Supelco, USA), DL-dithiothreitol (DTT) (N99%) and polyvi- nylpyrrolidone (PVPP) (~110 μm) (Fluka, USA), catechol (N99%), gallic acid (GA) (N98%), hydrogen peroxide (30%), Triton X-100, and Trolox (N97%) (Sigma Aldrich, USA). The remaining reagents were purchased from POCh (Warsaw, Poland). Demineralized water used for the analy- ses was purified using a Direct-Q 3 apparatus (Millipore, USA). 2.4. Analyses 2.4.1. Total content of polyphenols (TCP) Strawberry purée (10 g) was extracted for 5 min in an ultrasound
  • 43. bath (40 kHz, 100 W, 25 °C, ITR, Poland) using 30 g of an extraction mix- ture: methanol/water/hydrochloric acid (80:19.9:0.1; v/v/v) in centri- fuge flasks. Afterwards, the sample was centrifuged in a laboratory centrifuge (MPW-350R, MPW Med. Instruments, Poland) at 3670 g and 4 °C for 5 min. Extraction was repeated five times, supernatants were combined and the methanol was evaporated under vacuum (B- 481, Büchi, Switzerland). The residue was transferred quantitatively to a volumetric flask and filled up to 50 mL with 0.1% (v/v) o- phosphoric acid. The total content of polyphenols was determined using the Folin– Ciocalteu method modified by Gao, Ohlander, Jeppson, Bjork, and 50 K. Marszałek et al. / Innovative Food Science and Emerging Technologies 27 (2015) 48–56 Trajkovski (2000). The absorbance of the mixture was measured spec- trophotometrically (UV-1650PC, Shimadzu, Japan) at 765 nm. The total content of polyphenols was expressed in milligrams of gallic acid equivalent per 100 g of fresh weight of the purée (mg GAE/100 g FW).
  • 44. 2.4.2. HPLC analysis of anthocyanins The HPLC determination of the anthocyanin content was carried out using the method described by Goiffon, Mouly, and Gaydou (1999), with modifications consisting of changing the isocratic elution into gra- dient elution, and shortening the analysis time to 22 min. Ten milliliters of the extract (Subsection 2.4.1) was absorbed and purified on Sep-Pak C18 minicolumns (Waters, USA). Anthocyanins were eluted with 5 mL of a methanol/water/hydrochloric acid mixture (75:24.9:0.1; v/v/v), and then filtered on PTFE filters with a pore size of 0.45 μm (Waters, USA). The analysis of the anthocyanins in the HPLC system equipped with a DAD SPD-10Avp detector, thermostat CTD-10AsVp and DEGASEX™ DG-4400 degasser (Shimadzu, Japan) was carried out on a reversed- phase Luna C18 column (250 × 4.6 mm, 5 μm, Phenomenex, USA) at a temperature of 25 °C, flow rate of 1 mL/min and detection at 520 nm. A water/formic acid mixture (89:11, v/v) and acetonitrile were used as eluents (A and B, respectively) in the following program: 9% B (15 min), from 9 to 20% B (1 min), from 20 to 30% B (1 min), from 30 to 9% B (2 min), and 9% B (4 min). Monomers of the
  • 45. anthocyanins were identified by comparing their retention times with those of the standards and with data from literature. Cy-3-Glc and Pg-3-Glc contents were calculated based on their standard calibration curves results. Pg-3- Rut was expressed as Pg-3-Glc. All results were expressed in milligrams per 100 g of fresh weight (mg/100 g FW). 2.4.3. HPLC analysis of phenolic acids and flavonols Phenolic compounds were determined according to a modified method of Odriozola-Serrano, Soliva-Fortuny, and Martin- Belloso (2008). To determine the contents of p-hydroxybenzoic acid (p- HBA), ellagic acid (EA), quercetin (Q) and kaempferol (K), acidic hydrolysis was conducted with the method used by Da Silva Pinto, Lajolo, and Genovese (2008). Forty milliliters of a methanol/6 M hydrochloric acid/water mixture (56:25:19; v/v/v) was added to 1 mL of the extract (Subsection 2.4.1). The sample was heated at 120 °C for 90 min, then cooled and neutralized with 6 M NaCl to pH ca. 3.5. Analyses were carried out in a gradient system using the equipment described in Subsection 2.4.2 at 30 °C, flow rate of 1 mL/min and detec- tion at 260 nm (phenolic acids) and 360 nm (flavonols). The water/
  • 46. formic acid mixture (99:11, v/v) and acetonitrile were used as eluents (eluents A and B, respectively) in the following gradient program: 10% B (10 min), from 10 to 45% B (15 min), from 45 to 70% B (5 min), from 70 to 10% B (3 min), and 10% B (4 min). Selected phenolic com- pounds were quantified using external p-HBA, EA, Q and K calibration curves. The contents of all compounds were expressed in milligrams per 100 g of fresh weight (mg/100 g FW). Peak identities were as recent- ly described by Odriozola-Serrano et al. (2008). 2.4.4. HPLC analysis of AA and DHAA The total vitamin C content, expressed as L-ascorbic acid (AA) and L- dehydroascorbic acid (DHAA), was determined as described by Odriozola-Serrano, Harnandes-Jover, and Martin-Belloso (2007). Ap- proximately 1 g of purée was transferred to a volumetric flask and filled up to 10 mL with 0.01% of m-phosphoric acid. The extract was then fil- tered through PTFE 0.45-μm filters. In order to assay DHAA, it was re- duced to AA with 0.1% DL-dithiothreitol (DTT) using 1 mL of the following mixture: extract/DTT (50:50; v/v) and leaving it in the dark for 1 h. The content of DHAA was calculated using the formula: DHAA = (AA + DHAA) − AA.
  • 47. The HPLC analysis (2695, Waters, USA) was carried out using a reversed-phase SunFire C18 column (250 × 4.6 mm, 5 μm, Waters, USA) and a photodiode detector (DAD) (2996, Waters, USA). The anal- ysis was conducted with the isocratic method using 0.01% m- phosphoric acid at a flow rate of 1 mL/min and column temperature of 25 °C. AA was quantified using external calibration curves. The con- tents of AA and DHAA were expressed in milligrams of AA per 100 g of fresh weight (mg AA/100 g FW). Peak identities were as recently de- scribed by Odriozola-Serrano et al. (2007). 2.4.5. Changes in color parameters The color of the strawberry purée was determined using a CM- 3600d colorimeter (Konica Minolta, Japan), in glass cuvettes with an op- tical path of 10 mm. The measurement was made on the CIEL*a*b* sys- tem, using illuminant D65. Values of L*, a*, and b* parameters enabled calculating the absolute difference of the samples' color after preserva- tion compared to the control sample, using the following equation: ΔE = [(ΔL*)2 + (Δa*)2 + (Δb*)2]1/2, where L* (lightness/darkness), a* (red/green), and b* (yellow/blue). 2.4.6. Determination of PPO and POD activities The activity of selected tissue enzymes was determined as
  • 48. described by Terefe et al. (2010). The extraction mixture comprised 0.2 M phos- phate buffer (pH = 6.5) containing 4% (w/v) polyvinylpyrrolidone (PVPP), 1% (v/v) Thriton X-100 and 1 M NaCl. The strawberry purée and the mixture (4.5: 4.5 g, w/w) were treated with ultrasound (40 kHz, 100 W, 25 °C, ITR, Poland) for 3 min and centrifuged (MPW- 350R, MPW Med. Instruments, Poland) at 17,700 g for 30 min at 4 °C. The supernatant, after filtration through blotting filter paper, was used to determine PPO and POD activities. For PPO activity assay, 100 μL of the supernatant was introduced into 3 mL of 0.05 M phosphate buffer (pH 6.5) containing 0.07 M catechol, and the absorbance was measured spectrophotometrically (UV- 1650PC, Shimadzu, Japan) at λ = 420 nm and 25 °C for 10 min. A blank sample was prepared in the same way, by substituting the super- natant with a phosphate buffer. The PPO activity was expressed as a change in absorbance/min/g of fresh weight of the analyzed sample. For the POD activity assay, 1.5 mL of 0.05 M phosphate buffer (pH = 6.5) was added to 200 μL of the supernatant, 200 μL of 0.05 M phosphate buffer containing 1% p-phenylenediamine (w/v) and 200 μL of
  • 49. 1.5% (v/v) hydrogen peroxide. Mixture absorbance was measured at λ = 485 nm and 25 °C for 10 min. The POD activity was expressed as a change in absorbance/min/g of fresh weight of the analyzed sample. 2.4.7. Microbiological analyses Yeasts and molds were analyzed according to the ISO 21527- 1:2008 standard. Purée samples were diluted with sterile normal saline (0.85% sodium chloride), spread plated on sterile nutrient agar plates (PCA) and incubated at 25 °C for 5 to 7 days. The total microbial count (TMC) was determined according to the EN ISO 4833: 2003 standard. Samples diluted with sterile normal saline were plated on DRBC plating medium; plates were incubated at 30 °C for 72 h. All the experiments were conducted in duplicates and mean values of log 10 cfu/g sample have been reported. 2.4.8. Sensory analysis The sensory analysis of strawberry products was conducted as de- scribed in ISO 4121:1998. A 6-point scale was used to evaluate: color, appearance, consistency, aroma and taste, and an overall quality assess-
  • 50. ment was conducted using a 9-point hedonic scale; assessments were made by a trained sensory panel (eight persons). All samples were eval- uated independently in a test room complying with the requirements of ISO 8589:2007. 2.4.9. Statistical analysis All analyses were conducted using Statistica 10 StatSoft® software. The significance of differences was computed based on an analysis of the variance with Tukey's test (p-value b 0.05), and the impact of HPP on the quality of strawberry purée was assessed based on a cluster Ta b le 1 C on te n ts of fr ee
  • 97. d if fe r si gn ifi ca n tl y st at is ti ca lly ,p ≤ 0. 0 5 . 51K. Marszałek et al. / Innovative Food Science and Emerging Technologies 27 (2015) 48–56 analysis in the form of tree diagrams using weighted average linkage and Euclidean distances. Three independent samples subjected to simultaneous treatment under the same conditions were analyzed in duplicate.
  • 98. 3. Results and discussion 3.1. Content of phenolic compounds The TCP in the control sample (CS) was 221 mg GAE/100 g FW (Table 1), which is consistent with the findings of other authors (Oszmiański & Wojdyło, 2009; Oszmiański, Wojdyło, & Matuszewski, 2007). Free p-hydroxybenzoic acid was not identified in any of the sam- ples, which indicates that it occurred only in the bound form. The total content of p-HBA (Table 1) was 1.19 mg/100 g FW and was slightly higher than found by Breitfellner, Solar, and Sontag (2003) and by Odriozola-Serrano et al. (2008), who reported 0.1–0.6 mg/100 g FW of this compound. The contents of free EA, Q and K in CS were 2.11, 1.26 and 0.09 mg/100 g FW, respectively. A similar content of free EA was determined by Amakura, Okada, Tsuji, and Tonogai (2000) and Pallauf, Rivas-Gonzalo, Castillo, Cano, and Pascual-Teresa (2008). As re- ported by Oszmiański and Wojdyło (2009), the contents of flavonol in strawberries may range from 0.5 to 4.0 per 100 g of fruits. Many authors agree that strawberries contain 0.5–7.0 times more quercetin than kaempferol derivatives (Breitfellner et al., 2003; Da Silva Pinto et al., 2008; Oszmiański et al., 2007; Pallauf et al., 2008).
  • 99. During the production of concentrated strawberry juice, most of the ellagic acid remains in the pomace (Klimczak et al., 2011); hence, straw- berry purée is a very valuable source of this biologically-active compo- nent. Its total content in CS was 33.54 mg EA/100 g FW. Häkkinen and Törrönen (2000) reported that the content of ellagic acid in straw- berries of the ‘Senga Sengana’ variety was 39.66 mg EA/100 g FW. Inter- estingly, in the same strawberry cultivar, Da Silva Pinto et al. (2008) measured from 5.5 to 50.0 mg of ellagic acid per 100 g of strawberries depending on the extraction solution (acetone, methanol), the type and concentration of acid used for hydrolysis, and the time and temper- ature of the hydrolysis process. The contents of quercetin and kaempferol increased 5 and 30 times after hydrolysis, which indicates that they (kaempferol in particular) occur mainly in the bound form. The predominant phenolic acid in strawberries is ellagic acid, which constitutes from 35 to 50% of the total content of phenolic acids (Da Silva Pinto et al., 2008; Häkkinen, Karenlampi, Mykkanen, Heinonen, & Torronen, 2000; Klimczak et al., 2011). In terms of levels of this con- stituent, strawberries are inferior only to wild strawberries, raspberries
  • 100. and pomegranate fruits (Amakura et al., 2000; Häkkinen et al., 2000; Törrönen, Hakkinen, Karenlampi, & Mykkanen, 1997). Most of the studied phenolic compounds were present in the bound form. No free p-HBA was detected and the amount of free EA, Q and K was 6, 20 and 3% of their bounded form. TP significantly increased the contents of free ellagic acid, quercetin, and total contents of phenolic acids and flavonols, as previously report- ed (Cao et al., 2011; Odriozola-Serrano et al., 2008). Purée treated by HPP at 0 °C showed an insignificant difference in its content of phenolic compounds compared to CS. HPP at 50 °C significantly increased the contents of free ellagic acid, quercetin and kaempferol (besides 300 MPa/1 min). The inconsistent effect of temperature on the con- tents of the assayed components is usually linked with the extraction of potentially-antioxidative compounds from fruit tissue (Cao et al., 2011; Patras et al., 2009). Treatment pressure and time had no signifi- cant effect on the levels of free phenolic acids and flavonols. The sum of free compounds, p-hydroxybenzoic acid, ellagic acid, quercetin and kaempferol constituted only 1.6 to 3.7% of total polyphe- nols in the CS and TP-treated sample, respectively, which is in
  • 101. agree- ment with the data reported by Cao et al. (2011) The contribution of these polyphenols after hydrolysis in TCP was 20 and 27% respectively, for the CS and TP-treated sample; the most abundant compound was 52 K. Marszałek et al. / Innovative Food Science and Emerging Technologies 27 (2015) 48–56 EA, constituting from 15.2 to 20.5% of TCP. The contents of studied poly- phenols in HPP-treated samples were similar to that of CS, especially when treatment at 0 °C was applied. 3.2. Content of anthocyanins As shown in Table 2, the content of Cy-3-Glc, Pg-3-Glc and Pg- 3-Rut in the control sample (CS) was 7.81 (8.4%), 80.79 (87.2%) and 4.03 (4.4%) mg/100 g, respectively. Odriozola-Serrano et al. (2008) reported a similar ratio of these monomers in strawberry juices, ca. 8:88:4. Cao et al. (2011) also found these compounds to be the most abundant an- thocyanins in strawberries, their concentration being as follows: Pg-3- Glc 23.1 mg/100 g, Pg-3-Rut 5.8 mg/100 g and Cy-3-Glc 3.7 mg/100 g, which accounted for 71.3%, 17.9% and 11.4% of total monomeric
  • 102. anthocyanins. The study showed a statistically significant (p-value ≤ 0.05) effect of the preservation temperature on the contents of all investigated antho- cyanin monomers (Table 2); however, the treatment pressure and pro- cessing time had no significant effect on their levels compared to CS. The content of anthocyanin monomers in TP and HPP treated samples was similar to the CS and reached on average ca. 8:88:4% (w/w) for Cy-3- Glc:Pg-3-Glc:Pg-3-Rut, respectively. The analysis of anthocyanins dem- onstrated losses of a total level of the analyzed pigments compared to CS reaching ~43, 7 and 14% in the samples treated with TP, HPP at 0 °C and HPP at 50 °C, respectively. In other studies on the effect of thermal pro- cessing on anthocyanin levels in juices and strawberry purée, the losses ranged from 3 to 30% (Cao et al., 2011; Hartmann, Patz, Andlauert, Dietrich, & Ludwig, 2010; Marszałek et al., 2011; Odriozola- Serrano et al., 2008; Patras et al., 2009). These differences may be caused by an- other type of device (flow system) used by some authors, or mild con- ditions of the process. Pg-3-Rut appeared slightly more susceptible to preservation conditions than the other anthocyanins. After TP its losses
  • 103. were ca. 6% higher compared to the remaining monomers. Losses of Pg- 3-Rut in HPP-treated strawberry purée at 50 and 0 °C were higher com- pared to other anthocyanin monomers by 18 and 9%, respectively. Most authors demonstrated, however, that Pg-3-Glc was the most sensitive anthocyanin in strawberries (Tiwari et al., 2009; Verbeyst, Hendrickx, & Loey, 2012; Verbeyst et al., 2010). The thermal stability of anthocya- nins also depends on the equilibrium between the three main forms in which they occur in the natural environment, i.e., flavylium cations, pseudo-bases and chalcones. Increasing the heating temperatures dis- turbs this equilibrium and induces the formation of colorless chalcones, which is accompanied by decreasing the contents of the quinoid bases and flavylium cations. During long-term exposure to increased temper- atures, the resultant chalcones are easily transformed into color (brownish) polymers, which results in the browning of strawberry Table 2 Content of anthocyanins and vitamin C in control sample and TP and HPP-preserved strawber T (°C) P (MPa) t (min) Anthocyanins Cy-3-Glc Pg-3-Glc Pg-3-Rut CS – 0.1 – 7.81 ± 0.01a 80.79 ± 4.81a 4.03 ± 0.
  • 104. TP 90 0.1 15 4.36 ± 0.11e 45.97 ± 1.68g 2.04 ± 0. HPP 0 300 1 7.46 ± 0.07b 76.70 ± 2.28ab 3.23 ± 0. 5 7.74 ± 0.04a 73.69 ± 5.69bcde 3.28 ± 0. 15 7.23 ± 0.19b 76.28 ± 1.75b 3.35 ± 0. 500 1 7.25 ± 0.15b 73.85 ± 1.34bcde 3.57 ± 0. 5 7.37 ± 0.13b 75.04 ± 3.31bcd 3.60 ± 0. 15 7.35 ± 0.22b 75.17 ± 0.19bc 3.46 ± 0. 50 300 1 6.49 ± 0.11d 68.41 ± 0.54f 2.73 ± 0. 5 6.74 ± 0.34cd 71.43 ± 2.46cdef 3.03 ± 0. 15 6.84 ± 0.17c 69.79 ± 1.27ef 2.57 ± 0. 500 1 6.83 ± 0.09c 70.70 ± 0.44def 2.70 ± 0. 15 6.86 ± 0.08c 70.13 ± 1.52ef 2.80 ± 0. Data represent means ± SD (n = 3); FW: fresh weight; Cy-3- Glc: cyanidin-3-glucoside; Pg-3- anthocyanins; AA: ascorbic acid; DHAA: dehydroascorbic acid; CS: control sample; TP: therma Mean values denoted with the same letters are not statistically significantly different, p ≤ 0.05 products during processing and storage (Odriozola-Serrano et al., 2008; Özkan, 2002). 3.3. Contents of AA and DHAA As shown in Table 2, the content of AA and DHAA in the control sample was 37.49 (70.2%) and 15.89 (29.8%) mg/100 g, respectively. These values are in the range of those previously reported by other authors (Hakala et al. 2003). They reported from 32.4 to 84.7
  • 105. mg vi- tamin C in six strawberry cultivars. TP significantly degraded vitamin C (Table 2), reducing its content by 62% compared to CS. The level of vita- min C (AA + DHAA) also decreased significantly in HPP- preserved purée, but losses reached only 15% (at 0 °C) and 16% (at 50 °C). The AA to DHAA ratio in CS did not change significantly after TP. However, an increase was noted in L-dehydroascorbic acid, and a simultaneous decrease in L-ascorbic acid, in the HPP-preserved samples. In strawberry purée preserved with HPP at 50 °C, DHAA constituted 55% of the total vitamin C content, and in that preserved at 0 °C ~36%. Significant differ- ences were also determined in the contents of both forms of vitamin C depending on the treatment pressure and exposure time. Considering that DHAA is less stable and more rapidly degraded than AA, faster ox- idation of AA during HPP at higher temperatures may seem undesirable. When analyzing the quality of strawberry purée preserved with HPP (400–600 MPa, 15 min, 10–30 °C) and by pasteurization (70 °C, 2 min), Patras et al. (2009) reported losses of AA at 5–10% depending on the HPP process parameters and 22% for pasteurized purée. Hartmann et al. (2010) showed a decrease (of 37%) in the content of vi- tamin C in pasteurized products (85 °C, 2 min).
  • 106. 3.4. Activity of PPO and POD Enzyme activities in CS showed that POD activity (A0 POD = 1.59 OD/ min/g FW) was three times greater than PPO activity (A0 of PPO = 0.43 OD/min/g FW). In different strawberry cultivars (‘Pajaro’, ‘Camarosa’, ‘Festival’, ‘Rubygem’, ‘Aroma’) other authors reported from 0.27 to 2.31 OD/min/g FW and from 0.04 to 2.24 OD/min/g FW for POD and PPO activity, respectively (Cano et al., 1997; Terefe et al., 2010, 2013). Only TP led to effective inactivation of both analyzed enzymes (Fig. 1). A significant decrease (45% on average) in PPO activity in the HPP-preserved strawberry purée was determined at a processing tem- perature of 50 °C. The higher process temperature (50 °C) coupled with higher pressure (500 MPa) and the longer time of its action (15 min) were more effective in inhibiting PPO activity, with only 28% of its initial activity remaining. POD turned out to be more resistant to higher pressures than PPO. In turn, the higher temperature of HPP pres- ervation caused a significant decrease in POD activity of 16 to 37%. ry purée (mg/100 g FW). TCA Vitamin C Sum AA + DHAA AA DHAA
  • 107. 71a 92.60 ± 5.49a 37.49 ± 0.77a 15.89 ± 0.72f 53.38 ± 0.95a 08f 52.36 ± 1.86g 14.93 ± 0.16j 5.55 ± 0.39h 20.48 ± 0.33i 16bcd 87.39 ± 2.19b 29.16 ± 0.19c 12.92 ± 0.74g 42.08 ± 0.65g 64bcd 84.71 ± 6.36bcd 27.09 ± 0.14d 16.36 ± 0.28f 43.45 ± 0.35f 71bc 86.86 ± 1.28b 29.36 ± 0.91c 17.63 ± 0.37e 46.99 ± 0.55cd 32ab 84.67 ± 1.70bcde 26.24 ± 0.20e 19.66 ± 0.59d 45.91 ± 0.48d 36ab 86.01 ± 3.68bc 30.91 ± 0.47b 15.34 ± 1.04f 46.26 ± 0.67d 13ab 85.98 ± 0.28bc 31.45 ± 0.62b 16.31 ± 1.48f 47.76 ± 1.94c 05de 77.63 ± 0.49f 17.49 ± 0.67i 23.96 ± 0.81c 41.45 ± 0.58g 02bcde 81.21 ± 2.82cdef 22.57 ± 0.32f 26.35 ± 0.69b 48.92 ± 0.72b 04ef 79.19 ± 1.44f 19.27 ± 0.55h 25.32 ± 1.00b 44.60 ± 0.48e 09de 80.23 ± 0.36def 17.68 ± 0.17i 32.14 ± 0.57a 49.82 ± 0.41b 07cde 79.79 ± 1.61ef 21.60 ± 0.22g 16.28 ± 0.28f 37.88 ± 0.18h Glc: pelargonidin-3-glucoside; Pg-3-Rut: pelargonidin-3- rutinoside; TCA: total content of l pasteurization; HPP: high pressure processing. .
  • 108. a g a a a,b a,b a,b a,b c c,d e c f 0 20 40 60 80 100 120 1 min 5 min 15 min 1 min 5 min 15 min CS TP HPP 300 MPa HPP 500 MPa % re
  • 109. si du al a ct iv ity PPO activity0°C 50°C a d a a a a a a,bb b b b,c c 1 min 5 min 15 min 1 min 5 min 15 min CS TP HPP 300 MPa HPP 500 MPa POD activity0°C 50°C Fig. 1. Activity of enzymes in the control sample and in TP and HPP-preserved strawberry purée. Data: mean ± SD (n = 3); FW: fresh weight; CS: control sample; TP: thermal pasteur- ization. The % residual activities ((A/A0) · 100) are presented
  • 110. where A0 represents the activity of enzymes in the fresh strawberries (A0 of PPO = 0.43 OD/min/g FW; A0 of POD = 1.59 OD/ min/g FW). Mean values denoted with the same letter do not differ significantly statistically, p ≤ 0.05. 53K. Marszałek et al. / Innovative Food Science and Emerging Technologies 27 (2015) 48–56 Terefe et al. (2009) obtained only a 30% reduction in PPO activity and as much as an 85% lower POD activity in HPP-preserved strawberries (600 MPa, 60 °C, 10 min). The resistance of strawberry PPO to pressure was also reported by Garcia-Palazon et al. (2004), who achieved com- plete inactivation of PPO upon pressure treatment at 800 MPa for 10 min. These conditions were, however, insufficient to inactivate POD. In contrast, in the study conducted by Terefe et al. (2010), the PPOs in strawberry purée from two cultivars ‘Aroma’ and ‘Festival’ were found to be highly resistant to thermal inactivation at temperature as high as 100 °C with a maximum inactivation of 28% after a 30-min treatment. 3.5. Changes in color The major color of strawberry juice is a mix of red and yellow. Thus, Hunter a* and b* values or some combination of a* and b* should be considered as the physical parameters to describe the visual
  • 111. color deg- radation. But in fact, any change in a* and b* values is associated with a simultaneous change in the L* value, therefore representation of qual- ity in terms of total color may be more relevant (Rodrigo, Loey, & Hendrickx, 2007). Changes in food product color are best described by two color coefficients L* · a*/b* and ΔE. These coefficients have already been used by many authors studying strawberry color changes during processing (Rodrigo et al., 2007; Terefe et al., 2009) (Fig. 2). The L* · a*/b* coefficient in the control sample was 77.28 at pH 3.2. Rodrigo et al. (2007) reported ca. 59.0 at pH 3.7 but they also proved a highly dependent L* · a*/b* coefficient from pH. The L* · a*/b* coefficient increased significantly (by 4.5 units) after TP compared to CS. Significant changes in the L* · a*/b* coefficient were also determined in HPP purée at 50 °C (omitting 300 MPa at 50 °C), but in this e,f a e,f e,f d d,e f f
  • 112. c c d,e,f c b 75 77 79 81 83 1 min 5 min 15 min 1 min 5 min 15 min CS TP HPP 300 MPa HPP 500 MPa L*·a*/b*0°C 50°C Fig. 2. Color changes in TP and HPP-preserved strawberry puree. Data: mean ± SD (n = 3); FW the same letter do not differ significantly, p ≤ 0.05. case these were mainly due to the increased value of the a* parameter from +24.12 to ca. +26, which probably resulted from the mechanical extraction of anthocyanin pigments from the tissue to intercellular juice. By contrast the a* parameter decreased to +21.77 after TP. Similar, but less significant changes were observed in the L* and b*
  • 113. parameters. This phenomenon was earlier described by Rodrigo et al. (2007) and Terefe et al. (2009) also determined increased values of color parameters during high pressure treatment (up to 600 MPa). The highest value of ΔE was noted in purée after TP (ΔE = 3.0). Slightly lesser, but statistically significant, color changes were observed in the samples preserved with HPP at 50 °C (ΔE = 2.3), and the lowest in the samples preserved at 0 °C (ΔE = 1.6). It has been shown that, if ΔE is lower than 1.5, changes in the sample color are unnoticeable by in- experienced observers (Barba, Esteve, & Frigola, 2013). Cao et al. (2011) reported that the ΔE was ≥5 at 400 MPa and ≤3 at 500 and 600 MPa, and it reduced (to 1.79) with increasing pressures. By contrast they re- ported ΔE = 10.18 after thermal processing. Much lower changes in strawberry purée were noticed by Patras et al. (2009). They reported ΔE 5.67 and 2.44 after TP and HPP (500 MPa, 15 min, room tempera- ture) treatment, respectively. The changes in the color parameters could also be related to the higher residual activity of PPO and POD at TP. 3.6. Microbiological quality Yeast and mold counts and the total microbial count indicated a sig-
  • 114. nificant effect of HPP and TP on the microbiological quality of the prod- uct (Table 3). TP and preservation by HPP at 500 MPa (at both temperatures) reduced the colony-forming units of yeasts and molds from 4.6 log cfu/g and 3.8 log cfu/g to b1 log cfu/g, respectively. The lower pressure allowed a significant reduction in microorganism a e e d d e d b e b c c 0 1 2 3 4 1 min 5 min 15 min 1 min 5 min 15 min
  • 115. TP HPP 300 MPa HPP 500 MPa ΔE0°C 50°C : fresh weight; CS: control sample; TP: thermal pasteurization. Mean values denoted with Table 3 Count of yeast and molds and total microbial count in fresh strawberries and strawberry purée pasteurized and preserved with the HPP method (log cfu/g FW). T (°C) P (MPa) t (min) Yeast Molds TMC CS – 0.1 – 4.60 ± 0.06a 3.82 ± 0.08a 4.86 ± 0.12a TP 90 0.1 15 b1 ± 0.05c b1 ± 0.07e b1 ± 0.06c HPP 0 300 1 1.60 ± 0.15b 3.32 ± 0.06b 4.30 ± 0.10a 5 1 ± 0.09c 1.70 ± 0.12d 4.26 ± 0.07a 15 b1 ± 0.08c b1 ± 0.06e 4.28 ± 0.09a
  • 116. 500 1 b1 ± 0.07c b1 ± 0.07e 4.26 ± 0.11a 5 b1 ± 0.06c b1 ± 0.09e 4.26 ± 0.10a 15 b1 ± 0.07c b1 ± 0.06e 4.36 ± 0.08a 50 300 1 1.95 ± 0.14b 2.74 ± 0.04c 3.54 ± 0.12b 5 1.84 ± 0.12b 1.48 ± 0.12d 3.26 ± 0.14b 15 1 ± 0.07c 1 ± 0.08e 3.20 ± 0.11b 500 1 b1 ± 0.06c b1 ± 0.06e 3.40 ± 0.12b 15 b1 ± 0.07c b1 ± 0.03e 3.41 ± 0.15b Data represent means (n = 3); FW: fresh weight; TMC: total microbial count; CS: control sample; TP: thermal pasteurization; HPP: high pressure processing. TMC — DRBC plating medium, incubation at 30 °C for 72 h; yeasts and molds — PCA plating medium, incuba- tion at 25 °C for 5 to 7 days. Mean values denoted with the same letter are not statistically significantly different, p ≤ 0.05. 54 K. Marszałek et al. / Innovative Food Science and Emerging Technologies 27 (2015) 48–56 counts, minimum 2.6 and 0.5 log cfu/g for yeast and molds, respectively. HPP treated at 0 °C was ineffective to reduce TMC, compared to HPP at 50 °C and TP treated where TMC was reduced by 1.5 and 4.8 log cfu/g, respectively.
  • 117. 3.7. Sensory quality The sensory assessment conducted after preservation demonstrated that the greatest changes, compared to the control sample, occurred in purée after TP (Table 4). The color, taste and aroma of pasteurized purée were scored from 0.5 to 1.0 pts lower than CS. Only the purée con- sistency remained unaffected. In the overall quality assessment with a hedonic scale, pasteurized purée was scored as 7.8. In turn, no signifi- cant changes were noted in the color and consistency of HPP- preserved purée at 0 °C, and the statistical analysis revealed a small de- crease in the scores given for aroma and taste. According to Table 4, the color, taste, aroma and consistency of all samples treated with HPP at 50 °C, either at 300 or 500 MPa, show no significant differences com- pared to the fresh samples. The overall acceptability of the products pre- served using this method was significantly lower than that of the unprocessed material, but still at a high level (8.5 on average). However, some examples showed an adverse effect of the HPP method on taste and smell. As a result of high pressure a rancid smell appears in Table 4 Sensory quality of fresh strawberries and strawberry purée TP and preserved with the HPP me
  • 118. -point hedonic scale). T (°C) P (MPa) t (min) Color CS – 0.1 – 6.0 ± 0.0a TP 90 0.1 15 5.5 ± 0.4b HPP 0 300 1 6.0 ± 0.0a 5 6.0 ± 0.0a 15 6.0 ± 0.0a 500 1 5.9 ± 0.2a 5 6.0 ± 0.0a 15 6.0 ± 0.0a 50 300 1 5.8 ± 0.4a 5 5.8 ± 0.4a 15 5.8 ± 0.4a 500 1 5.8 ± 0.4a
  • 119. 15 5.8 ± 0.4a Data represent means ± SD (n = 8); CS: control sample; TP: thermal pasteurization; HPP: hig Mean values denoted with the same letter are not statistically different, p ≤ 0.05. tomatoes (Poretta, Birzi, Ghizzoni, & Vicini, 1995). On the other hand, the smell of HPP-treated onions (350 MPa, 30 min, 25 and 40 °C) was less intense and was like frozen onions (Butz, Koller, Tauscher, & Wolf, 1994). Pressure above 100 MPa damages cell structures such as mem- branes and provokes a massive release of enzymes leading to numerous enzymatic reactions that influence flavor and product stability. UHP processing (30 min/300 MPa/25 and 40 °C) changes the odor of fresh onions towards that of braised or fried onions. The excess increase in the content of n-hexane in tomatoes is what gives them an unpleasant smell. During HPP, very high n-hexanal and cis-3-hexenal concentra- tions were formed from free fatty acid oxidation. In the case of onions, the authors noted two reasons: a reduction in dipropyl sulfides and an increase in trans-propylene disulfide and 3.4- dimethylthiophene. 3.8. Statistical analysis
  • 120. The cluster analysis conducted using the method of weighted aver- age linkage and Euclidean distance for analyzing the contents of pheno- lic acids, flavonols, anthocyanins, vitamin C, color, enzymatic activity and sensory assessment (Fig. 3) showed explicitly the greatest changes in the quality of strawberry purée upon thermal pasteurization (TP). The HPP-treated sample, especially at 0 °C, showed the lowest differ- ences compared to the control sample. The analysis of variance conduct- ed for results concerning the chemical composition of purée did not show any significant effect of the pressure value and duration of the time of treatment on phenolic acids, flavonols, the total content of poly- phenols, anthocyanins and the total microbial count. 4. Conclusions The study showed the effects of high pressure and thermal pasteur- ization on the chemical compounds, color, sensorial quality and micro- bial count in strawberry (‘Senga Sengana’ cv.) purée. The level of phenolic acids, flavonols, total polyphenols, anthocyanins, vitamin C, color and taste depended on the temperature, whereas pressure and time were not significant factors. Pressure, temperature and time influ-
  • 121. enced the PPO and POD activity and the microbial count. The measure- ment of the activities of PPO and POD demonstrated, however, greatest inactivation at the longest exposure time (15 min). Although the senso- ry quality of all strawberry purée samples preserved with the HPP method was very high compared to TP, taking into account the results of microbiological analyses and tissue enzyme activity, the recommend- ed pressure treatment is that applied at 500 MPa and 50 °C. Milder con- ditions of the process may result in the product being equally valuable in terms of its chemical quality, but with a shorter shelf-life due to mi- crobiological quality and enzymatic activity. Further studies are, thod (color, taste, aroma, consistency in a 6-point scale, overall quality assessment in a 9- Taste Aroma Consistency Overall quality 6.0 ± 0.0a 6.0 ± 0.0a 6.0 ± 0.0a 9.0 ± 0.0a 5.0 ± 0.0c 5.3 ± 0.4b 6.0 ± 0.0a 7.8 ± 0.4b 5.6 ± 0.4ab 5.4 ± 0.4b 5.8 ± 0.4a 8.5 ± 0.4ab 5.4 ± 0.4bc 5.4 ± 0.4b 5.8 ± 0.4a 8.5 ± 0.4ab 5.5 ± 0.4abc 5.6 ± 0.4ab 5.8 ± 0.4a 8.3 ± 0.4ab 5.5 ± 0.4abc 5.4 ± 0.4b 5.8 ± 0.4a 8.5 ± 0.4ab
  • 122. 5.8 ± 0.4ab 5.6 ± 0.4ab 5.8 ± 0.4a 8.5 ± 0.4ab 5.6 ± 0.4ab 5.5 ± 0.4ab 5.8 ± 0.4a 8.5 ± 0.4ab 6.0 ± 0.0a 5.8 ± 0.4ab 5.8 ± 0.4a 8.5 ± 0.4ab 6.0 ± 0.0a 5.8 ± 0.4ab 6.0 ± 0.0a 8.5 ± 0.4ab 6.0 ± 0.0a 6.0 ± 0.4a 5.8 ± 0.4a 8.3 ± 0.4ab 6.0 ± 0.0a 6.0 ± 0.4a 5.8 ± 0.4a 8.5 ± 0.4ab 6.0 ± 0.0a 5.8 ± 0.4ab 6.0 ± 0.0a 8.5 ± 0.4ab h pressure processing. Fig. 3. Cluster analysis conducted with the method of weighted average linkage using the Euclidean distance for analyzing the contents of polyphenols, anthocyanins, vitamin C, color, enzymatic activity and sensory assessment. Data: CS: control sample; TP: thermal pasteurization; HPP/pressure/time/temperature. 55K. Marszałek et al. / Innovative Food Science and Emerging Technologies 27 (2015) 48–56 therefore, recommended to evaluate the quality of strawberry purée preserved with HPP at 500 MPa, 50 °C, and 15 min during storage. The most distinct advantage of the HPP method was the good preservation of the sensory attributes, which were similar to the control
  • 123. sample and much better than after thermal pasteurization. Acknowledgments The Project was financed from funds of the National Research Center (grant No. NN 312 252540) and co-financed from funds of the European Union within the European Social Fund (contract No. 78/ES/ZS- II/W- 2151.1/11). Authors would like to thank Prof. Monika Fonberg- Broczek (Institute of High Pressures PAS UNIPRESS, Poland) for the pos- sibility of using the pressure chamber. We are also grateful to Prof. Alan Kelly (UCC, Cork, Ireland) for his valuable remarks during manuscript preparation. References Amakura, Y., Okada, M., Tsuji, S., & Tonogai, Y. (2000). High- performance liquid chro- matographic determination with photodiode array detection of ellagic acid in fresh and processed fruits. Journal of Chromatography A, 896, 87–93. Barba, F.J., Esteve, M.J., & Frigola, A. (2013). Physicochemical and nutritional characteris- tics of blueberry juice after high pressure processing. Food Research International, 50, 545–549. Bigliardi, B., & Galati, F. (2013). Innovation trends in the food industry: The case of func-
  • 124. tional foods. Trends in Food Science and Technology, 31, 118– 129. Blumberg, J. (2003). Dietary antioxidants of fruits and vegetable in prevention of chronic diseases. Horticultural Science, 38(5), 771. Boero, R. (2011). Food quality as a public good: Cooperation dynamics and economic de- velopment in a rural community. Mind & Society, 10, 203–215. Breitfellner, F., Solar, S., & Sontag, G. (2003). Radiation induced chemical changes of phe- nolic compounds in strawberries. Radiation Physics and Chemistry, 67, 497–499. Butz, P., Koller, W.D., Tauscher, B., & Wolf, S. (1994). Ultra- high pressure processing of on- ions: Chemical and sensory changes. Food Science and Technology, 27, 463–467. Cao, X., Zhang, Y., Zhang, F., Wang, Y., Yi, J., & Liao, X. (2011). Effects of high hydrostatic pressure on enzymes, phenolic compounds, anthocyanins, polymeric color and color of strawberry pulps. Journal of the Science and Food Agriculture, 91, 877–885. Cano, M.P., Hernandez, A., & De Ancos, B. (1997). High pressure and temperature effects on enzyme inactivation in strawberry and orange products. Journal of Food Science, 62(1), 85–88. Corrales, M., Toepfl, S., Butz, P., Knorr, D., & Tauscher, B. (2008). Extraction of anthocya-
  • 125. nins from grape by-products assisted by ultrasonic, high hydrostatic pressure or pulsed electric fields: A comparison. Innovative Food Science & Emerging Technologies, 9, 85–91. Da Silva Pinto, M., Lajolo, F.M., & Genovese, M.I. (2008). Bioactive compounds and quan- tification of total ellagic acid in strawberries (Fragaria × ananassa Duch.). Food Chemistry, 107, 1629–1635. Farahani, P., Grunow, M., & Günther, H.O. (2012). Integrated production and distribution planning for perishable food products. Flexible Services and Manufacturing Journal, 24, 28–51. Ferrari, G., Marcesca, P., & Ciccarone, R. (2011). The effects of high hydrostatic pressure on the polyphenols and anthocyanins in red fruit products. Procedia Food Science, 1, 847–853. Gao, X., Ohlander, M., Jeppson, N., Bjork, L., & Trajkovski, V. (2000). Changes in antioxidant effect and their relationship to phytonutrients in fruit of sea buckthorn (Hippophae rhamnoides L.) during maturation. Journal of Agriculture and Food Chemistry, 48, 1845–1890. Garcia-Palazon, A., Suthanthangjai, W., Kajda, P., & Zabetakis, I. (2004). The effects of high pressure on β-glucosidase, peroxidase and polyphenoloxidase in red raspberry (Rubus idaeus) and strawberry (Fragaria × ananassa). Food Chemistry, 88, 7–10.
  • 126. Goiffon, J.P., Mouly, P.P., & Gaydou, E.M. (1999). Anthocyanic pigment determination in red fruit juices, concentrated juices and syrups using liquid chromatography. Analytica Chimica Acta, 382, 39–50. Hakala, M., Lapveteläinen, A., Huopalahti, R., Kallio, H., & Tahovonen, R. (2003). Effects of varieties and cultivation conditions on the composition of strawberries. Journal of Food Composition and Analysis, 16, 67–80. Hartmann, A., Patz, C., Andlauert, H., Dietrich, H., & Ludwig, M. (2010). Change of ascorbic acid and phenolic compounds during the processing of strawberry purée and juice. Fruit Processing, 4–6, 102–109. Häkkinen, S.H., Karenlampi, S.O., Mykkanen, H.M., Heinonen, I.M., & Torronen, A.R. (2000). Ellagic acid content in berries: Influence of domestic processing and storage. European Food Research and Technology, 212, 75–80. Häkkinen, S.H., & Törrönen, A.R. (2000). Content of flavonols and selected phenolic acids in strawberries and Vaccinium species: Influence of cultivar, cultivation site and tech- nique. Food Research International, 33, 517–524. Heinz, V., & Buckow, R. (2009). Food preservation by high pressure. Journal für Verbraucherschutz und Lebensmittelsicherheit, 10(1007), 3–9. Kaur, C., & Kapoor, H.C. (2001). Antioxidants in fruits and