Ah4101193200

International Journal of Engineering Research and Applications (IJERA) is a team of researchers not publication services or private publications running the journals for monetary benefits, we are association of scientists and academia who focus only on supporting authors who want to publish their work. The articles published in our journal can be accessed online, all the articles will be archived for real time access. Our journal system primarily aims to bring out the research talent and the works done by sciaentists, academia, engineers, practitioners, scholars, post graduate students of engineering and science. This journal aims to cover the scientific research in a broader sense and not publishing a niche area of research facilitating researchers from various verticals to publish their papers. It is also aimed to provide a platform for the researchers to publish in a shorter of time, enabling them to continue further All articles published are freely available to scientific researchers in the Government agencies,educators and the general public. We are taking serious efforts to promote our journal across the globe in various ways, we are sure that our journal will act as a scientific platform for all researchers to publish their works online.

Recomendados
Recomendados
Más contenido relacionado
La actualidad más candente
La actualidad más candente (19)
Destacado
Destacado (20)
Similar a Ah4101193200
Similar a Ah4101193200 (20)
Último
Último (20)
Ah4101193200
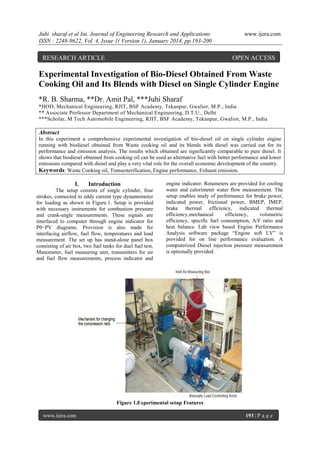
- 1. Juhi sharaf et al Int. Journal of Engineering Research and Applications ISSN : 2248-9622, Vol. 4, Issue 1( Version 1), January 2014, pp.193-200 RESEARCH ARTICLE www.ijera.com OPEN ACCESS Experimental Investigation of Bio-Diesel Obtained From Waste Cooking Oil and Its Blends with Diesel on Single Cylinder Engine *R. B. Sharma, **Dr. Amit Pal, ***Juhi Sharaf *HOD, Mechanical Engineering, RJIT, BSF Academy, Tekanpur, Gwalior, M.P., India ** Associate Professor Department of Mechanical Engineering, D.T.U., Delhi ***Scholar, M Tech Automobile Engineering, RJIT, BSF Academy, Tekanpur, Gwalior, M.P., India Abstract In this experiment a comprehensive experimental investigation of bio-diesel oil on single cylinder engine running with biodiesel obtained from Waste cooking oil and its blends with diesel was carried out for its performance and emission analysis. The results which obtained are significantly comparable to pure diesel. It shows that biodiesel obtained from cooking oil can be used as alternative fuel with better performance and lower emissions compared with diesel and play a very vital role for the overall economic development of the country. Keywords: Waste Cooking oil, Transesterification, Engine performance, Exhaust emission. I. Introduction The setup consists of single cylinder, four strokes, connected to eddy current type dynamometer for loading as shown in Figure.1. Setup is provided with necessary instruments for combustion pressure and crank-angle measurements. These signals are interfaced to computer through engine indicator for Pθ−PV diagrams. Provision is also made for interfacing airflow, fuel flow, temperatures and load measurement. The set up has stand-alone panel box consisting of air box, two fuel tanks for duel fuel test, Manometer, fuel measuring unit, transmitters for air and fuel flow measurements, process indicator and engine indicator. Rotameters are provided for cooling water and calorimeter water flow measurement. The setup enables study of performance for brake power, indicated power, frictional power, BMEP, IMEP, brake thermal efficiency, indicated thermal efficiency,mechanical efficiency, volumetric efficiency, specific fuel consumption, A/F ratio and heat balance. Lab view based Engine Performance Analysis software package “Engine soft LV” is provided for on line performance evaluation. A computerized Diesel injection pressure measurement is optionally provided. Figure 1.Experimental setup Features www.ijera.com 193 | P a g e
- 2. Juhi sharaf et al Int. Journal of Engineering Research and Applications ISSN : 2248-9622, Vol. 4, Issue 1( Version 1), January 2014, pp.193-200 No alteration in Combustion chamber geometry Arrangement for duel fuel test Online measurements and performance analysis Data logging, editing, printing and export, Configurable graphs IP, IMEP, FP indication Combustion analysis www.ijera.com Table 1 Specifications of engine test setup Single cylinder, 4 stroke, Diesel Product (Computerized) Make Kirloskar, Type 1 cylinder, 4 stroke Diesel, water cooled, power 3.5 kW at 1500 rpm, stroke 110 mm, bore 87.5 mm. 661 cc, CR 17.5, Modified to VCR engine CR range 12 to 18 Engine Dynamometer Type eddy current, water cooled, Temperature sensor Rota meter Type RTD, PT100 and Thermocouple, Type K Engine cooling 40-400 LPH; Calorimeter 25-250 LPH w Software “EnginesoftLV”engine performance analysis software Overall dimensions Smoke meter W 2000 x D 2500 x H 1500 mm III. Figure2. Line diagram of experimental setup F1 Fuel flow unit F2 Air flow unit F4 Calorimeter water flow kg/hr T1, T3 Inlet water temperature 0K T2 Outlet engine jacket water temperature 0K T4 Calorimeter water outlet temperature 0K T5 Exhaust gas to calorimeter inlet temp. 0K T6 Exhaust gas from calorimeter outlet temp. 0K II. Eddy Current Dynamometer It consists of a stator on which are fitted a number of electromagnets and a rotor disc and coupled to the output shaft of the engine. When rotor rotates eddy currents are produced in the stator due to magnetic flux set up by the passage of field current in the electromagnets. These eddy currents oppose the rotor motion, thus loading the engine. These eddy currents are dissipated in producing heat so that this type of dynamometer needs cooling arrangement. A moment arm measures the torque. Regulating the current in electromagnets controls the load. www.ijera.com Make AVL, measurement for opacity Performance Evaluation A single cylinder Diesel engine is used for the experimental analysis. Fuel was supplied to the engine from an outside tank. All runs started with a 15-min warm-up period prior to data collection. The gap of 5 minutes was provided between the two consecutive runs. The data measured during the tests included, brake power, torque, and fuel consumption, sfc, opacity. During the test Brake power was varied by adjusting the brake power knob provided on the control panel of the test rig. The tests were performed with pure diesel fuel and blends (B-20, B-40 and B-60). Blends of waste cooking oil biodiesel and diesel were used. The observations were taken at Brake power of 0.5kW, 1kW, 1.5kW, 2kW, 2.5kW, 3kW, 3.5KW and 4.0kW. Formulation used for calculation of various parameters are described below i. Torque (kg m) =Brake power × Arm length ii. Brake power (kW) = (2 × π × Speed × Torque × 9.81) / (60 × 1000) 194 | P a g e
- 3. Juhi sharaf et al Int. Journal of Engineering Research and Applications ISSN : 2248-9622, Vol. 4, Issue 1( Version 1), January 2014, pp.193-200 iii. Brake Thermal Efficiency (%) = Brake power (kW )×3600 ×100 kg Fuelflowin ×calorificvalue hr iv. Supplied By Fuel (%) - {(Heatin Jacket Cooling Water (%) + Heat to Exhaust (%) + Heat Equivalent to Useful Work (%)} (kJ /kg ) Fuelflowin kg hr IV. Brake power (kW ) Mechanical Efficiency (%) = Brake power (kW )×100 Indicated power (kW ) vi. c) Heat to Radiation and unaccounted (%)= Heat Specific fuel consumption (Kg/kWh) = v. www.ijera.com Heat balance (kJ/h): a) Heat supplied by fuel (kJ/h) = fuel flow (kg/h) × Calorific value (kJ/kg) b) Heat equivalent to useful work (kJ/h) = Break power (kW) × 3600 Heat Break power (%) Heat equivalent to useful work × 100 = Heat supplied by fuel Table 2 Description of different blends of biodiesel Type of blend Amount of biodiese l (ml) Amount of diesel(ml ) Resulta nt calorifi c value (kJ/kg) Resultant Density (kg/m3) Diesel 0 1000 42000 830 B-20 200 800 41500 835 B-40 400 600 41000 839 a) Heat carried in jacket cooling water = F3 × C pw × (T2 – T1) Heat carried in jacket cooling water % Heat carried in jacket cooling water × 100 = Heat supplied by fuel b) Heat in Exhaust (calculate value): 𝐶𝑝𝑒𝑥 = 𝐹4 ∗ 𝐶𝑝𝑤 𝑇4 − 𝑇3 ∗ 𝐹1 + 𝐹4 (𝑇5 − 𝑇6) Where, Cpex= Specific heat of exhaust gas (kJ/kg 0C). C pw= Specific heat of water (kJ/kg0C). F1= Fuel consumption (kg/hr). F2 = Air consumption (kg/hr). F3= Engine water flow rate (kg/hr). F4= Calorimeter water flow rate (kg/hr). Tamb=ambient temperature (0C). T1=Engine water inlet temperature (0C). T2=Engine water outlet temperature (0C). T3 =Calorimeter water inlet temperature (0C). T4=Calorimeter water outlet temperature (0C). T5=Exhaust gas to calorimeter inlet temp(0C). T6=Exhaust gas from calorimeter outlet temp (0C). Preparation of Blends This engine experiment has been performed with different blends of WCO biodiesel and diesel (Diesel, B-20 and B-40). These blends are prepared in quantity of one litre each by mixing required quantity of WCO biodiesel in petroleum diesel. Their description is shown in Table 2. Calorific value of diesel = 42000 kJ/kg. Calorific value of WCO biodiesel = 39500 kJ/kg. Density of diesel = 830 kg/m3. Density of WCO biodiesel = 852 kg/m3. V. Performance Data Experimental data for performance study are given below: Diesel Engine performance parameters obtained from performance testing in single cylinder C. I. engine against different loads for pure diesel are given below in Table 3. Heat in Exhaust (kJ / h) = (F1+ F2) ×Cpex(T3- Tamb) Heat in Exhaust × 100 Heat in Exhaust % = Heat supplied by fuel www.ijera.com 195 | P a g e
- 4. Juhi sharaf et al Int. Journal of Engineering Research and Applications ISSN : 2248-9622, Vol. 4, Issue 1( Version 1), January 2014, pp.193-200 www.ijera.com Table 3 performance parameters C. I. engine against different loads for pure diesel FP IP BThE IThE MechE Sfc Opa LOA C T1 T2 (kW (kW (%) (%) (%) (kg/k city D R deg C deg C ) ) Wh) (%) (kg) 0.54 2.15 2.69 11.85 59.16 20.03 0.72 1.75 18 18.20 25.46 5.4 Torq ue (Nm) 3.18 BP (kW) 6.06 1.01 1.98 2.99 19.01 56.42 33.69 0.45 13.5 3.34 18 18.28 9.28 1.52 1.94 3.46 24.62 56.04 43.93 0.35 19.2 5.11 18 12.64 2.06 1.85 3.91 26.4 55.69 52.72 0.32 26.2 6.97 15.21 2.47 1.81 4.28 31.67 54.96 57.72 0.27 31.1 18.61 2.98 1.71 4.69 33.86 53.26 63.58 0.25 22.06 3.52 1.62 5.14 35.87 52.37 68.44 0.24 25.32 4.01 1.57 5.58 37.12 51.68 71.82 0.23 VI. T3 deg C T4 deg C T5 deg C T6 deg C 18.20 20.34 145.66 109.87 25.27 18.28 20.08 168.70 125.15 18.30 25.96 18.30 20.36 184.00 130.04 18 18.43 28.76 18.43 21.96 215.83 148.33 8.38 18 18.53 32.17 18.53 23.52 244.57 169.53 39.5 10.25 18 18.55 33.41 18.55 24.60 263.67 177.24 54.6 59.2 1 12.16 18 18.58 36.08 18.58 25.59 285.78 189.60 13.95 18 18.61 37.73 18.61 27.99 312.18 203.26 Biodiesel Blends from Waste Cooking Oil diesel in proportion of 20% and 40% respectively as a diesel engine fuel and following parameters has been obtained and shown in table 4 and 5 Experiments has been performed by taking waste cooking oil biodiesel (WCO-B) blends with Table 4 performance parameters of blends of biodiesel with diesel in proportion of 20% Torqu e (Nm) BP (kW ) FP (kW ) IP (kW ) BThE (%) IThE (%) Mech E (%) Sfc (kg/k Wh) Opacit y (%) LOA D (kg) C R T1 deg C T2 deg C T3 deg C T4 deg C T5 deg C T6 deg C 3.16 0.54 2.27 2.80 11.94 62.41 19.28 0.74 9.1 1.75 18 17.33 23.26 17.30 19.05 145.76 102.6 6.20 1.05 2.16 3.19 19.58 60.30 32.91 0.48 13.02 3.43 18 17.35 23.60 17.35 19.54 162.72 111.45 9.26 1.54 2.05 3.58 25.21 58.58 43.01 0.36 16.8 5.11 18 17.38 23.99 17.36 19.79 182.1 122.84 12.58 2.07 2.02 4.06 28.94 57.24 50.98 0.32 22.2 6.94 18 17.40 24.55 17.40 20.21 205.33 136.92 15.75 2.56 1.90 4.48 31.90 55.21 57.14 0.27 27.7 8.66 18 17.46 24.85 17.41 20.80 228.17 150.84 18.81 3.02 1.92 4.96 33.70 55.24 61.88 0.25 37.8 10.46 18 17.46 25.44 17.44 21.64 255.14 170.10 21.86 3.49 1.85 5.35 35.07 53.63 65.23 0.24 42.5 12.09 18 17.50 25.85 17.48 22.13 280.46 182.65 25.22 3.99 1.79 5.78 38.42 52.70 69.03 0.23 45.9 13.89 18 17.54 26.78 17.54 23.08 308.99 200.00 Table 5 performance parameters of blends of biodiesel with diesel in proportion of 20% Torqu e (Nm) BP (k W) FP (kW) IP (kW ) BThE (%) IThE (%) MechE (%) Sfc (kg/k Wh) Opac ity (%) LOA D (kg) CR T1 deg C T2 deg C T3 deg C T4 deg C T5 deg C T6 deg C 3.37 0.55 2.18 2.74 12.94 63.04 20.07 0.67 13.67 1.87 18 17.70 23.96 17.70 19.98 149.80 109.78 6.10 1.02 2.08 3.06 19.37 59.64 32.93 0.48 18.92 3.35 18 17.69 24.11 17.68 20.09 162.56 113.11 8.92 1.48 2.04 3.52 24.56 59.23 41.98 0.36 18.01 4.92 18 17.68 24.56 17.68 20.60 182.50 124.02 12.25 1.99 1.94 3.98 29.33 58.37 50.27 0.32 20.72 6.74 18 17.69 25.20 17.69 21.42 203.72 136.78 2.54 2.03 4.52 35.24 63.39 55.98 0.26 28.13 8.67 18 17.72 25.94 17.72 22.15 226.06 150.17 19.12 3.03 1.96 4.95 36.22 68.37 61.21 0.24 34.21 10.34 18 17.78 26.30 17.78 22.56 251.80 164.67 22.41 3.52 1.92 5.42 38.72 76.70 65.99 0.19 44.03 12.14 18 17.79 27.13 17.79 23.26 276.84 179.75 25.01 3.99 1.82 5.76 40.32 78.24 70.21 0.16 46.20 13.98 18 17.81 27.36 17.81 23.74 303.30 194.32 15.54 www.ijera.com 196 | P a g e
- 5. Juhi sharaf et al Int. Journal of Engineering Research and Applications ISSN : 2248-9622, Vol. 4, Issue 1( Version 1), January 2014, pp.193-200 Results and Discussions The experimental investigations are carried out using the diesel and blends on the test engine. The detailed analyses of these results are discussed in this section. VIII. Variation of Torque v/s Brake Power Figure 3 shows the variation of torque with brake power for diesel and blends of waste cooking oil and diesel. Variations of torque for different blends and diesel at all values of brake powers are within a very narrow range. The torque developed for diesel (25.32 Nm) is little more than blends (25.22 Nm, 25.01 Nm respectively for WCO-B20, WCO-B40) at 4.0 kW. 4.5 CR=18 4 3.5 3 Torque (kNm) 2.5 2 1.5 diesel 1 WCO-B-20 0.5 0.8 0.7 sfc (kg/kwh) VII. www.ijera.com CR=18 0.6 diesel WCO-B20 WCO-B40 0.5 0.4 0.3 0.2 0.1 0 0.5 1 1.5 2 2.5 3 3.5 Brake Power(kw) 4 Figure 4 Variation of Specific fuel Consumption v/s Brake Power Variation of Brake Thermal Efficiency v/s Brake Power Figure 5 shows comparison of Brake thermal efficiency v/s brake power for different blends in comparison to diesel. For WCO-B20 AND WCO-B40 blend brake thermal efficiency values are higher as compared to diesel at higher load. This is due to better combustion efficiency of blends caused by presence of extra amount of oxygen. The maximum thermal efficiency achieved by WCOB40 is around 40.32 % at 4.0 kW. WCO-B-40 0 0.5 1 1.5 2 2.5 3 3.5 Brake power (Kw) 40 Figure 3 Variation of Torque v/s Brake Power www.ijera.com 35 30 bThE (%) Variation of Specific fuel Consumption v/s Brake Power The variation of specific fuel consumption vs. brake power is shown in Figure 4 for blends and diesel. For all cases the sfc initially decreases sharply with increase in brake power and afterward remains stable. In case of blends sfc values are higher at the beginning because of higher viscosity. Once the required temperature is attained inside the engine cylinder the values are comparable with diesel but little bit higher specifically for WCO-B20 and WCO-B40 as compared to diesel for a wide range of brake power as shown in Figure 4. CR=18 45 4 25 20 Diesel WCO-B20 WCO-B40 15 10 5 0 0.5 1 1.5 2 2.5 3 Brake Power (kw) 3.5 4 Figure 5 Variation of Brake Thermal Efficiency v/s Brake Power Variation of Mechanical Efficiency Vs. Brake Power Figure 6 shows comparison of mechanical efficiency and v/s brake power for different blends of wco. For all blends and diesel the variations in values are in the range of 4 % to 6% as shown in Figure 6. Diesel has higher value as compared to blends because of better heat release rate. 197 | P a g e
- 6. Juhi sharaf et al Int. Journal of Engineering Research and Applications ISSN : 2248-9622, Vol. 4, Issue 1( Version 1), January 2014, pp.193-200 80 www.ijera.com 350 CR=18 70 300 60 250 50 Diesel WCO-B20 WCO-B40 30 20 Ex. Temp. (CelCius) M e Eff (%) 200 40 150 100 Diesel WCO-B20 WCO-B40 50 10 0 0 0.5 1 1.5 2 2.5 3 3.5 0.5 1 1.5 2 2.5 Brake Power (kw) 4 3 3.5 4 Brake Power(kW) Figure 6 Variation of Mechanical Efficiency Vs. Brake Power Figure 8 Variation of Exhaust Gas Temperature v/s Brake Power Variation of Smoke Opacity v/s Brake Power To understand the pollution aspect of WCO and diesel blends the variation of opacity v/s brake power are shown in Figure 7 for blends in comparison to pure diesel. The opacity value for pure diesel is higher as compared to all type of blends for wide range of Brake power. At all brake power condition the opacity of all blends has less value than diesel oil. Maximum value of opacity has obtained at 59.21 at 4.0 kW brake power for pure diesel and for blends 45.9 at 4.0 kW for B-20. Variation of CO Emission v/s Brake Power The characteristics of CO emission are shown in Figure 9, for each fuel, there is a decrease of CO emission on increase of the engine load or brake power. The peak concentrations at the 0.5 kW brake power are0.045%, 0.034% and 0.035%, for diesel, WCO-B20, WCO-B40 respectively. Then higher combustion temperature at higher engine load contributes to the general decreasing trend. With the addition of biodiesel, CO emission also decreases. The reason lies in the fact that the oxygen contained in the biodiesel fuel enhances complete combustion in the cylinder and reduces CO emission. 70 CR=18 60 0.1 40 0.09 0.08 30 DIESEL 0.07 Diesel WCO-B20 WCO-B40 20 10 0 WCO-B20 0.06 WCO-B40 Co (%) Opacity (%) 50 0.05 0.04 0.03 0.5 1 1.5 2 2.5 3 3.5 4 Brake Power(kw) Figure 7 Variation of Smoke Opacity v/s Brake Power Variation of Exhaust Gas Temperature v/s Brake Power Exhaust Temperature of the blends such as WCO-B20 and WCO-B40 at various brake powers compared to diesel are shown in the Figure 8. The Ex. Temperature values are higher for blends because of better combustion efficiency. This high temperature is also indication of more NOx emission in case of blends. www.ijera.com 0.02 0.01 0 0.5 2 Brake Power (kW) 4 Figure 9 Variation of CO Emission v/s Brake Power Variation of HC Emission v/s Brake Power As shown in Figure 10 for Diesel, the HC emission decreases with increase of brake power due to the increase in combustion temperature associated with higher engine load. For biodiesel blended fuel, the HC emission is lower than that of diesel and decreases with increase of biodiesel in the fuel. However, the lower volatility of biodiesel 198 | P a g e
- 7. Juhi sharaf et al Int. Journal of Engineering Research and Applications ISSN : 2248-9622, Vol. 4, Issue 1( Version 1), January 2014, pp.193-200 compared with diesel contributes to the larger difference in HC emission at low engine loads. The maximum concentrations of HC are 38 ppm, 28ppm, 26 ppm respectively, for diesel, WCO-B20 and WCO-B40. www.ijera.com the biodiesel blended fuel increases slightly at all tested engine loads and the increase is more obvious at higher engine loads. The peak concentrations at 4 kW bp are 1316 ppm, 1316 and 1388 ppm respectively, for diesel, WCO-B20 and WCO-B40. 1500 50 45 1000 NOx (ppm) 40 HC ppm) 35 500 30 25 DIESEL WCO-B20 WCO-B40 0 20 15 0.5 Brake 2 Power (kW) 4 Figure 12Variation of NOX Emission v/s Brake Power DIESEL 10 WCO-B20 5 WCO-B40 0 0.5 2 Brake Power (kW) IX. 4 Figure10 Variation of HC Emission v/s Brake Power Variation of CO2 Emission v/s Brake Power Figure 11 compares the CO2 emissions of various fuels used in the diesel engine. The CO2 emission increases with increases in brake load. The lower percentage of biodiesel blends emits very low amount of CO2 in comparison to diesel. Using higher concentration biodiesel blends as the fuel, CO2 emission is found to increase. But, its emission level is lower than that of the diesel mode. More amount of CO2 in exhaust emission is an indication of the complete combustion of fuel. This supports the higher value of exhaust gas temperature. 8 References [1] [2] 7 6 CO2 (%) 5 4 [3] DIESEL 3 WCO-B20 2 WCO-B40 1 [4] 0 0.5 2 Brake Power (kW) 4 [5] Figure11 Variation of CO2 Emission v/s Brake Power Variation of NOX Emission v/s Brake Power As shown in Figure 12 The NOx concentration increases with increase of bp for all the fuels. Compared with diesel, NOx emission of www.ijera.com Conclusion The performance parameter like brake thermal efficiency, brake specific fuel consumption, brake specific energy consumption, torque have similar as mineral diesel. It is observed that the Exhaust gas temperature for biodiesel blends is lower than diesel. The smoke emissions of biodiesel blends are considerably less as compare to diesel due to complete combustion of the fuel. The results confirm the potential of these blends have in reducing the overburdening imports of diesel fuel. [6] Meher LC., Naik SN., and Das LM., “Methanolysis of pongamia pinnata (Karanja) oil for production of biodiesel.” Journal of Scientific and Industrial research Volume 63, November 2004 pp 913-918. Meher LC., Naik SN., “Optimization of alkali-catalyzed transesterification of Pongami pinnata oil for production of biodiesel.” Bioresource Technology 97 (2006) pp. 1392-1397. Tomasevic AV., Siler-Marinkovic SS.” Methanolysis of used frying oil.” Fuel processing Technology 81 (2003) pp. 1-6. Math MC. and Irfan G. “Optimization of restaurant waste oil methyl ester yield.” Journal of Scientific and Industrial research Volume 66, November 2007 pp. 772-776. Stavarache C, Vinatoru M, Maeda Y. “Aspects of ultrasonically assisted transesterification of various vegetable oils with methanol.”, Ultrasonics Sonochemistry 14(3) March(2007) pp.380386. Bhake AB, Bankar SL, Shastri SS, Limaye NM. “Aspects of Ultrasonically assisted 199 | P a g e
- 8. Juhi sharaf et al Int. Journal of Engineering Research and Applications ISSN : 2248-9622, Vol. 4, Issue 1( Version 1), January 2014, pp.193-200 [7] [8] [9] [10] [11] www.ijera.com Transesterification of Vegetable Oils.”, New Frontiers in Biofuels ID: 2010/NFIB/014 January (2010) pp. 1-6. Stavarache C, Vinatoru M, Nishimura R, Maeda Y. “Fatty acids methyl esters from vegetable oil by means of ultrasonic energy.”, Ultrasonics Sonochemistry 12(5) April(2005) pp.367–372. Hanh HD, Dong NT, Okitsu K, Nishimura R, Maeda Y. Biodiesel production by esterification of oleic acid with short-chain alcohols under ultrasonic irradiation condition, Renewable Energy 34(3) March(2009) pp.780–783. Parag R. Gogate, Rajiv K. Tayal and Aniruddha B. Pandit, “Cavitation: A technology on the horizon.” Current Science, vol. 91, no. 1, 10 July 2006. Pal A, Verma A, Kachhwaha SS, Maji S., “Biodiesel production through hydrodynamic cavitation and performance testing.”, Renewable Energy 35(3) March(2010) pp. 619–624. Kelkar M.A., Gogate P.R., Pandit A.B., “Cavitation as a novel tool for process intensification of biodiesel synthesis.” January(2007). www.ijera.com 200 | P a g e