SlideShare una empresa de Scribd logo
1 de 6
Descargar para leer sin conexión
R.C. Jariwala, Dr. B.K. Samtani / International Journal of Engineering Research and
                   Applications (IJERA) ISSN: 2248-9622 www.ijera.com
                          Vol. 2, Issue 4, July-August 2012, pp.862-867
 The Estimation of Flood and Its Control by Section Modification
          in Mithi and Kankara Tributaries at Surat
                               R.C. Jariwala*, Dr. B.K. Samtani**
            * Deputy Engineer, Drainage Department, Surat Municipal Corporation, Surat, India.
** Professor, Civil Engineering Department, Sardar Vallabhbhai National Institute of Technology, Surat, India.


Abstract
          The southern part of Surat city drains its       Area
storm drainage through Mithi, Kankara, Khajod,
Koyali, Bhedwad, Sonari and Varachcha
tributaries(creek) which ultimately drains into
Mindhola river. In early past there was hardly
any incident of creek flood due to sparse
development and enough space for flood plains.
But in few decades, due to developmental
activities like buildings, roads, bridges etc and
slum encroachments along and across the drains
resulted in restricted waterway and reduction in
flood plains. Mithi and Kankara tributary is more
vulnerable to flood due to large catchment and
large human settlements on their banks. In this
paper, study of hydrology and survey data carried
out for hydraulic design of tributaries by
modification in the channel section and boundary
condition in most vulnerable stretch for flood
control. The peak flood is estimated from                  Figure1: catchment       area    of   Minhola    river
hydrological and catchment data using rational             tributaries
formula and accordingly tributary cross sections
were designed to contain estimated peak flood.             2. Rainfall Data
Keywords- Flood, Hydraulic design, Hydrology,                        The monsoon season is generally confined
Runoff, Tributary                                          between July to October. The annual rainfall and
                                                           maximum one-day rainfall for Surat city from 1984
1. Introduction                                            to 2010 are available from the Fire brigade station,
          Mindhola is a state river flowing within state   Surat Municipal Corporation. It is seen from the
boundary of Gujarat and considerable part of its           available data that the average annual rainfall of the
catchment in Surat city area. The Mindhola river           last 27 year is 1362.76mm. The one-day maximum
system with in Surat city comprises of 7 natural           rainfall intensity is 406.56 mm on 27.06.1988. The
tributaries (creeks) namely Koyali, Mithi, Kankara,        maximum rainfall is 2459.18mm in year 1988 and
Khajod, Bhedwad, Sonari and Varacha. The tributary         minimum rainfall is 666.25mm in year 1987.
wise length and catchment area is given in TABLE.
                                                           3. Floods in Tributaries
Table: 1 Tributary Wise Length and Catchment                        In the early past, hardly any incident of
                                                           flood was reported because of no development of
                                                           surrounding areas. But in last 10 to 15 years
               Length                                      developmental activities took place which resulted in
                              Catchment area
                from                                       construction of roads, buildings and bridges near or
Location                      from the origin
               origin                                      across tributaries. Moreover some of the slum also
                                 (sq.km.)
                (km)                                       developed near tributaries which resulted in the
Koyali           8.35               13.45                  encroachment in the water body, thus reducing the
Mithi           53.28              148.71                  water way of stream. More over Villages, Colonies,
Kankara         61.43              172.15                  slums also discharge their effluent and refuge directly
Khajod          71.58              297.92                  in the creek, leads to obstruction and blockage to
Bhedwad         15.00               38.00                  creek flow. This leads to frequent creek flood in the
Sonari          21.18               71.77                  event of heavy rain in the catchment.
Varachha        24.57               85.82                           Surat witnessed highest creek flood in year
                                                           2004 & again in year 2005 which caused heavy
                                                           damages to slums, residence and industries

                                                                                                  862 | P a g e
R.C. Jariwala, Dr. B.K. Samtani / International Journal of Engineering Research and
                   Applications (IJERA) ISSN: 2248-9622 www.ijera.com
                          Vol. 2, Issue 4, July-August 2012, pp.862-867
surrounding the drain. Every year there is a chance of     to carry out hydraulic design according to the length
creek flood in the incidence of heavy rain in the          and catchment area.
catchment area. There is no control on the creek
flood as rain water directly flows in the drain in         4.1Estimation of Storm Water Runoff
absence of any water retaining structure.                  Out of the different methods for estimation of runoff,
                                                           the rational method is more commonly used and the
          Though Mithi, Kankara and Khajod                 same is being used for Design of Mithi and Kankara
tributaries are different parts of one river system, the   Tributary.
problem is more severe in Mithi and Kankara
                                                                     CIA
tributary because of large human settlement and                Q
development on its bank. More over Mithi drain has                   36
very large catchment area compared to other drains
                                                           Where, Q = runoff in m3/sec
which make it more vulnerable to flood. Whereas,
                                                                  C = coefficient of runoff
Khajod tributary passes through undeveloped area
                                                                  I = intensity of rainfall in cm / hour
mostly and there is availability of flood plains which
                                                                  A = area of drainage basin in hectares
makes it less vulnerable. Owing to this fact, only
Mith and Kankara tributaries are covered under             The storm frequency has been adopted as “Once a
present study.                                             Two Year” for the design of storm water drains of
                                                           Mithi and Kankara Tributary, considering the
3.1 Causes of Flood                                        commercial, Industrial and high priced area
The flooding could be attributed to many natural and
man-made obstacles to the flow of water through the        For the design of the Mithi and Kankara Tributary,
creeks.                                                    the intensity of rainfall is considered as 378 mm/hour
                                                           (i.e. 1.5 inch/hour) as per the record available.
3.1.1 Man Made Obstacles
Some of the prominent man made obstacles causing           The runoff coefficient is worked out depending upon
constriction to flow are listed below.                     the imperviousness of the catchment area and time of
(a) Reclamation of land along the banks of the creeks      concentration. From Homer‟s table, the runoff
(b) Constructions of bridges / culverts on the creek       coefficient for duration„t‟ equals to 60 minutes are
    including roads in embankment                          described in TABLE.

(c) Additions of untreated industrial effluent from the
    industry                                                  Tributary Chainage         Land      Impervi     Runoff
(d) Suspended materials and non-degradable solids in                                      Use      ousness     Coeff
    the city Affluent.                                                  0 to
                                                                                    Agriculture    Pervious       0.371
(e) Encroachments by Huts and building                                 43280
    constructions along the creeks, reducing flow                     43280 to       Sparsely        30%
                                                               Mithi                                              0.502
    area.                                                              48280        Developed     Impervious
                                                                      48280 to        Fully
3.1.2 Natural Causes                                                                              Impervious      0.808
The natural phenomena affecting the flow in creeks                     53280        Developed
could be                                                                0 to          Fully
                                                               Koyali                             Impervious      0.808
(a) Rainfall pattern and its intensity.                                 8350        Developed
(b) Topography of the Catchments.                                     53280 to        Fully
(c) Cross sectional Area available for flow.                                                      Impervious      0.808
                                                                       57280        Developed
(d) Bed gradients.                                            Kankara
(e) Transfer of flow from Tapi river to Koyali/                       57280 to       Sparsely        30%
                                                                                                                  0.502
    Varachha and vice-versa.                                           61430        Developed     Impervious

4. Hydrology         of    Mithi     and     Kankara       Table 2: Runoff coefficient
Tributary
Hydrological study is important aspect to plan for the
                                                           4.1.1 Estimation of Peak Discharge for Mithi
re-sectioning of existing Streams. Hydrology deals         Tributary
with surface water, and its occurrences, circulation,
distribution, reactions to environment, are concerned      The calculation for estimation of peak discharge for
for the study. During the process of planning and the      Mithi tributary is given in TABLE.
re-sectioning of existing Streams, required inputs will
be given by this study. The tributaries are divided            Table 3: Estimated Discharge at Different
into number of reaches to calculate the hydrology and                          Sections


                                                                                                  863 | P a g e
R.C. Jariwala, Dr. B.K. Samtani / International Journal of Engineering Research and
                      Applications (IJERA) ISSN: 2248-9622 www.ijera.com
                             Vol. 2, Issue 4, July-August 2012, pp.862-867
                    of Mithi Tributary                            Table 5: Estimated Discharge at Different
Chainage Area of Run-off Est.Disc Design Cumula                        Sections of Kankara Tributary
         catchm coefficie harge Dischar       tive
In meter ent in    nt       in     ge in m3 Dischar             Chaina     Area       Run-      Est.   Design    Cumulat
         hector                      / Sec   ge in                ge        of         off     Disch   Discha      ive
                          m3 / Sec          m3/sec                In      catch      coeffic    arge     rge     Dischar
                                                                meter      ment       ient     In m3   In m3 /      ge
  0 to        2790     0.371     108.68    130.42    130.42                 In                 / Sec     Sec        In
                                                                          hector                                  m3/sec
 13280
13280 to      2907     0.371     113.24    135.89    266.31    Sum of cumulative flow of Mithi and Koyali         915.00
 23280                                                         Creek
23280 to      3050     0.371     118.81    142.57    408.88
 33280                                                          53280
                                                                  to        499      0.808     42.33    50.80     965.80
33280 to      1608     0.371     62.64     75.17     484.05     57280
 38230
38280 to      1891     0.371     73.66     88.39     572.44     57280
                                                                  to        500      0.502     30.97    37.16    1002.96
 43280
                                                                61430
43280 to      1598     0.502     84.23     101.08    673.52
 48280
48280 to      558      0.808     47.34     56.81     730.33   5. Hydraulic Design For Tributary Section
 51280
51280 to      469      0.808     39.79     47.75     778.08   5.1 Estimating Velocity
 53280
                                                              The design of channels will be based on a mean
                                                              velocity determined from the Manning formula as
4.1.2 Estimation of Peak Discharge For                        given below.
Koyali Tributary                                                                  V = 1/N R2/3 S ½

The calculation for estimation of peak discharge for          The coefficient „N‟ is known as Manning‟s rugosity
Koyali tributary is given in TABLE.                           coefficient contains the effect of all the retarding
                                                              factors influences the flow.
    Table 4: Estimated Discharge at Different
          Sections of Koyali Tributary                                 The stretch of Mithi and Kankara tributaries
                                                              under study passes through urban areas having large
  Chai   Area of Run-off Est. Dis Design Cumu                 settlements and development on their banks. The
  nage    catch   coeff  charge     Dis     lative            designed section without any lining would be resulted
In meter ment in icient           charge     Dis              in larger section which would not be feasible. Only
         hector          m3 / Sec   in     charge
                                  m3 /Sec in m3/sec           feasible option would be to change boundary
                                                              condition by means of lining. Therefore, for the
  0 to                                                        design of section of Mithi and Kankara tributary
             782       0.808    66.34      79.61     79.61
                                                              cement concrete lining is proposed. In this case,the
 3000
                                                              manning‟s coefficient „N‟ is taken as 0.012.
3000 to                0.808
             563                47.76      57.31     136.92
 8350                                                                   From length of section and fall in reduced
                                                              level of bed of the drain the falling gradient of bed is
                                                              found out. The trapezoidal section is most
                                                              economical section owing to the fact that with the
4.1.3Estimation of             Peak      Discharge     for
                                                              increase in the discharge available section for the
Kankara Tributary
                                                              flow will be more. Hence, sections are designed
The Kankara tributary emerges after confluence of             considering trapezoidal section having side slope of
Mithi and Koyali tributary. Hence, peak discharge at          1:1. From available parameters the sections are
the starting point of Kankara tributary will be               designed from following equation in TABLE.
summation of peak discharge of Mithi and Koyali
tributary.
                                                              Table 6: Equations Used For Design


                                                                                                       864 | P a g e
R.C. Jariwala, Dr. B.K. Samtani / International Journal of Engineering Research and
                   Applications (IJERA) ISSN: 2248-9622 www.ijera.com
                          Vol. 2, Issue 4, July-August 2012, pp.862-867
          Parameters                  Equations             Table 8: Hydraulic Design Calculations of Mithi
                                                                              Tributary
 Area of Channel (A) =                 BD+ nD2            Design Ch. Ch.         Ch. Ch. Ch. Ch. Ch. Ch.
                                                          Parame 44880 46280    47280 48280 49280 50280 51280 52280
 Wetted Perimeter (P)=             B+ 2Dx √ (n2+1)          ters  To    To       To    To    To    To    To    To
                                                                 46280 47280    48280 49280 50280 51280 52280 53280
 Hydraulic Mean Depth (R)=                A/P             Design
                                                          Dischar
 Constant( K)=                           √S /N            ge      527.6 544.4 561.3 577.0 592.8 608.6 628.5 648.4
                                                             3
                                                          (m /s)
 Velocity of Flow (V)=                   KR2/3            Peak
                                                          flow    633.1 653.3 673.5 692.5 711.4 730.3 754.2 778.1
 Discharge (Q)=                           AV              (m3/s)
                                                          Length
                                                          of
5.2 The Profile of Mithi Tributary                        section 1400 1000 1000 1000 1000 1000 1000 1000
                                                          (m)
For design of sections for Mithi tributary                R.L. of
                                                          bed at
topographical survey has been carried out from
                                                          Starting 5.125 4.880 4.705 4.530 4.355 4.180 4.005 3.830
chainage 44880 to chainage 53280. From survey data        (m)
cross sections at the interval of 50m has been
prepared. Moreover, longitudinal section of the Mithi     R.L. of
tributary for chainage 44880 to chainage 53280 is         bed at
                                                          Ending 4.880 4.705 4.530 4.355 4.180 4.005 3.830 3.655
also prepared. The average RL of the invert level at      (m)
chainage 44880 is 5.125 m and the same at chainage
                                                          Fall in
53280 is 3.655 m. Hence, for 8400 m length of
                                                          gradient 0.245 0.175 0.175 0.175 0.175 0.175 0.175 0.175
tributary the total reduction in the RL is 1.47m. The     (m)
gradient of the Mithi tributary for the portion under
consideration has been worked out as 1 in 5715            Conside
(0.000175). From topographical survey, the available      ring
                                                                   44.0    46.0 47.0   48.0   50.0   51.0   53.0   54.0
                                                          Width
depth is 5.0m and after deducting free board of 0.3 m,
                                                          (B)
the available depth for flow is 4.70m. Hence, sections
                                                          Area of
are designed for the flow depth of 4.70m.The section
                                                          Channel
is redesign as per the discharge calculated.                      228.9    238.3 243.0 247.7 257.1 264.8 271.2 275.9
                                                          (A)
                                                             2
5.2.1 Design Calculations                                 (m )
                                                          Wetted
For reasonable efficient and economical design of the     Perimet
                                                                   57.29   59.29 60.29 61.29 63.29 64.29 66.29 67.29
Mithi Tributary alongwith the consideration of            er
existing topography and physical feature of Mithi         (P )
Tributary, the design parameters for different sections   Hyd.
from chainage 44880 to chainage 53280 is given in         Mean
TABLE.                                                    Depth 3.99       4.019 4.030 4.041 4.062 4.072 4.091 4.100
                                                          (R)
 Table 7: Design Parameters for Mithi Tributary           Constan
                                                          t       1.102    1.102 1.102 1.102 1.102 1.102 1.102 1.102
Chainage                            44280 to 53280        ( K)
Length                                      8400m         Velocit
                                                          y of
RL at chainage 53280                       5.125 m                2.77 2.787 2.792 2.797 2.806 2.811 2.815 2.824
                                                          Flow
RL at chainage 59630                       3.655 m        (m/s)
Fall in RL                                  1.470m        Dischar
                                                          ge (Q) 635.3 664.0 678.4 692.7 721.5 735.9 764.7 779.1
Gradient                      1 in 5715 (0.000175)        (m3/s)
Available depth for flow                         5.0      Top
                                                          Width
Manning Coefficient (N)                       0.012               54.0 56.0 57.0 58.0 60.0 61.0 63.0 64.0
                                                          (T)
                                                          (m)
The hydraulic design calculation of Mithi tributary is
given in TABLE                                            5.3 The Profile of Kankara Tributary


                                                                                                     865 | P a g e
R.C. Jariwala, Dr. B.K. Samtani / International Journal of Engineering Research and
                   Applications (IJERA) ISSN: 2248-9622 www.ijera.com
                          Vol. 2, Issue 4, July-August 2012, pp.862-867
For design of sections for Kankara tributary,                 Table 10: Hydraulic Design Calculations of
topographical survey has been carried out from                           Kankara Tributary
chainage 53280 to Chainage 59630. From survey
                                                                   Ch. Ch.          Ch.     Ch.     Ch.     Ch.     Ch.
data cross sections at the interval of 50m has been       Design
                                                                   53280 54280      55280   56280   57280   58280   59280
prepared. Moreover, longitudinal section of the           Paramet
                                                                   To    To         To      To      To      To      To
Kankara tributary for Chainage 53280 to Chainage          ers
                                                                   54280 55280      56280   57280   58280   59280   59630
59630 is also prepared. The average RL of the invert      Design
level at chainage 53280 is 3.655 and the same at          Discharg 773.1 783.7      794.2 804.0 812.3 819.7 827.2
chainage 59630 is 1.508 m. Hence, for 6350m length        e (m3/s)
of tributary the total reduction in the RL is 2.147m.     Peak
The gradient of the Kankara tributary for the portion     flow        927.7 940.4 953.1 965.8 974.7 983.7 992.6
under consideration has been worked out as 1 in 2935      (m3/s)
(0.00034).
          From topographical survey, it can be derived    Total
                                                          length of
that on the upstream side of the tributary available                  1000 1000 1000 1000 1000 1000                  350
                                                          the Drain
depth is more whereas on the downstream side it is        (m)
less. The available depth is 4.6m at chainage 54280       R.L. of
and after deducting free board of 0.3 m; the available    bed at
depth for flow is 4.30m. The available depth is                       3.655 3.317 2.979 2.641 2.303 1.965 1.627
                                                          Starting
continuously reducing on the downstream side and          (m)
ultimately it is reduced to only 1.508m at chainage       R.L. of
59630. Moreover the difference of RL of the ground        bed at
                                                                      3.317 2.979 2.641 2.303 1.965 1.627 1.508
level of two banks of tributary is more in Kankara        Ending
tributary. The width of designed section will be very     (m)
                                                          Fall in
large in case where available depth for flow is less.
                                                          gradient    0.338 0.338 0.338 0.338 0.338 0.338 0.119
But such sections having larger width will not be         (m)
feasible because of unavailability of land due to large   Availabe
human settlements and developmental activity. In          Depth       4.30   4.00   3.70    3.40    3.40    3.40    3.40
such cases the tributary sections are designed in the     (D)
filling taking at most care of balancing cutting and      Conside
filling.                                                  ring
                                                                      54.0   62.0   71.0    83.0    83.0    84.0    85.0
                                                          Width
5.3.1 Design Calculations                                 (B)
For reasonable efficient and economical design of the     Area of
Kankara Tributary alongwith the consideration of          Channel 250.7 264.0 276.4 293.8 293.7 297.2 300.6
existing topography and physical feature of Kankara       (A) (m2)
Tributary, the design parameters for different sections   Wetted
from chainage 53280 to chainage 59630 is given in         Perimete
                                                                      66.16 73.31 81.46 92.62 92.62 93.62 94.62
                                                          r
TABLE.
                                                          (P ) (m)
                                                          Hydrauli
    Table 9: Design Parameters for Kankara                c Mean
                   Tributary                                          3.789 3.601 3.393 3.172 3.172 3.314 3.177
                                                          Depth
                            53280 to 59630                (R)(m)
  Chainage                                                Constant
                                                                      1.537 1.537 1.537 1.537 1.537 1.537 1.537
  Length                   6350m                          ( K)
                                                          Velocity
  RL at chainage 53280         3.655 m                    of Flow
                                                                      3.734 3.610 3.469 3.317 3.317 3.319 3.320
                                                          (V)
  RL at chainage 59630         1.508 m                    (m/s)
                                                          Discharg
  Fall in RL                   2.147m                     e (Q)       936.2 953.0 958.9 974.4 974.4 986.2 998.0
                                                           (m3/s)
  Gradient                     1 in 2935(0.00034)         Top
                                                          Width
                                                                      63.2   70.6   79.0    90.4    90.4    91.4    92.4
                                                          (T)
  Available depth for flow     4.60 m to 3.70m
                                                          (m)
  Manning Coefficient (N)      0.012
                                                          6. Advantages of Section Modification
The hydraulic design calculation of Kankara tributary     The main advantages can be summarized as below.
is given in TABLE                                           (i) Restoration of carrying capacity of tributaries,
                                                                thus easy and prompt disposal of floods and

                                                                                                      866 | P a g e
R.C. Jariwala, Dr. B.K. Samtani / International Journal of Engineering Research and
                      Applications (IJERA) ISSN: 2248-9622 www.ijera.com
                             Vol. 2, Issue 4, July-August 2012, pp.862-867
          dry weather flow without causing any damage       [5]    H.M. Raghunath, Hydrology: Principles,
          and nuisance.                                            Analysis, Design (New age International
  (ii)    Control of unauthorized disposal of untreated            Publishers, New Delhi, 2005)
          sewage by adjoining areas.
  (iii)   Protection of ground water thus prevention of     [6]    Handerson F.M., Open channel flow (The
          quality of drinking water resources.                     Mac Millan Company, New York,1996)
  (iv)    The surrounding land can be reclaimed which
          can be used for plantation and service roads.     [7]    Subramanya K., Flow in open channels
  (v)     Protection of tributary banks in sustainable             (Tata McGraw-Hill, New Delhi, 1991)
          manner.
  (vi)    More approachable banks for cleaning              [8]    S.N. Ghosh, Flood control and drainage
                                                                   engineering (Oxford and IBH Publishing
7. Conclusions                                                     Co. Pvt. Ltd., New Delhi, 1986)
          The southern part of Surat city discharges its
storm water through tributaries to Mindhola river.          [9]     Agnihotri P.G. and Patel J.N, Preparation of
Due to absence of any controlling structure, the                   Flood Reduction Plan for Surat City and
adjoining areas are vulnerable to the floods every                 Surrounding Region (India) International
year. The Mithi and Kankara tributaries had                        Journal on Transactions on Fluid
witnessed frequent floods due to their large                       Mechanics ; Issue 2 Volume 3, 2008, 116-
catchment. This paper describes method of flood                    125 ; WSEAS
control by channel section modification in most
vulnerable stretch of Mithi and Kankara tributary in        [10]   Daugherty, et al, Fluid mechanics with
Surat city. Due to higher rainfall in this area, the only          engineering applications (SI Metric
section modification without any lining would be                   Edition,McGraw-Hill Book Co., 1989)
resulted in large sections which would not be feasible
looking at the present development along the banks.         [11]   Chanson, Hubert, The hydraulics of open
Owing to this reason it would be necessary to change               channel flow: an introduction (Second
boundary condition of tributary by means of cement                 edition,Elsevier Butterworth-Heinemann,
concrete lining. The designed section with suggested               2004)
cement concrete lining will effectively pass designed
flood due to rainfall in the catchment. Apart from          [12]   U.S. Army Corps of Engineers, Earth and
flood control the other advantages would be water                  rock-fill dams - general design and
pollution control, restoration of carrying capacity,               construction considerations (Engineering
protection of banks, reclamation of land etc. The                  manual, 1994)
care should be taken to leave sufficient space for
flood plains on the downstream side of study area           [13]   Agnihotri P.G. and Patel J.N (2008). Study
while preparation of town planning schemes of this                 of Flood at Surat City and Its Remedial
surrounding area adjoining tributary.                              Measures      The 3rd IASME / WSEAS
                                                                   International    Conference    on    Water
                                                                   Resources, Hydraulics & Hydrology,
References
                                                                   (WHH'08) University of Cambridge,
  [1]      V. T. Chow, Open-channel hydraulics (Mc
                                                                   Cambridge, UK, during February 23-25,
           Graw-Hill Book Co., 1959)
                                                                   2008
  [2]      Tushar, Mori N. A Seminar Report on
                                                            [14]   Patel J.N., Flood management over region of
           Estimation and Control of Flood, 2007-
                                                                   river Tapi using GPS” Journal of Geospatial
           2008
                                                                   Today, Vol-I, Issue – 4, October-November,
                                                                   2002.
  [3]      AjayKumar, flood control and settlement
           planning (Mohit Publication, New Delhi,
           1995)

  [4]      Akash Acharya, Biswaroop Das, Kiran
           Pandya et al, Surat 2006 floods: a
           citizens’report (Centre for Social Studies
           (CSS) Surat and Department of Human
           Resource Development (DHRD), Veer
           Narmad South Gujarat University, Surat,
           2006)


                                                                                                 867 | P a g e

Más contenido relacionado

La actualidad más candente

S2 GE Slides - Floods (Part 2)
S2 GE Slides - Floods (Part 2)S2 GE Slides - Floods (Part 2)
S2 GE Slides - Floods (Part 2)LEEENNA
 
Minor project 2011 goup f
Minor project 2011 goup fMinor project 2011 goup f
Minor project 2011 goup fJaspreet singh
 
2011 liongson-modeling studies flood control dams-professorial chair lecture
2011 liongson-modeling studies flood control dams-professorial chair lecture2011 liongson-modeling studies flood control dams-professorial chair lecture
2011 liongson-modeling studies flood control dams-professorial chair lectureleony1948
 
Metro Manila Water Distribution System
Metro Manila Water Distribution SystemMetro Manila Water Distribution System
Metro Manila Water Distribution Systemharoldtaylor1113
 
Towards A Sustainable Drainage Solution
Towards A Sustainable Drainage SolutionTowards A Sustainable Drainage Solution
Towards A Sustainable Drainage Solutionceal2005
 
UN Rainwater Harvesting Manual
UN Rainwater Harvesting ManualUN Rainwater Harvesting Manual
UN Rainwater Harvesting ManualD6Z
 
Pakistan Flood Control System
Pakistan Flood Control SystemPakistan Flood Control System
Pakistan Flood Control Systemgrandestrategy
 
Restoring Natural Drainage System of Delhi
Restoring Natural Drainage System of DelhiRestoring Natural Drainage System of Delhi
Restoring Natural Drainage System of DelhiIram Aziz
 
Financing Disaster Risk in India
Financing Disaster Risk in IndiaFinancing Disaster Risk in India
Financing Disaster Risk in IndiaAtul Pandey
 
Southern Institute of Water Resources Research - Water related issues in the ...
Southern Institute of Water Resources Research - Water related issues in the ...Southern Institute of Water Resources Research - Water related issues in the ...
Southern Institute of Water Resources Research - Water related issues in the ...Hanna Stahlberg
 
Water Supply and Sanitation Management in Annaba: Constraints and Perspectives
Water Supply and Sanitation Management in Annaba:  Constraints and PerspectivesWater Supply and Sanitation Management in Annaba:  Constraints and Perspectives
Water Supply and Sanitation Management in Annaba: Constraints and Perspectiveslotfi19031966
 
Water storage for secure water supply, Ho Chi Minh City
Water storage for secure water supply, Ho Chi Minh CityWater storage for secure water supply, Ho Chi Minh City
Water storage for secure water supply, Ho Chi Minh CityHanna Stahlberg
 
River conservation and Water Security Act
River conservation and Water Security ActRiver conservation and Water Security Act
River conservation and Water Security ActAnupam Saraph
 
Building services assignment
Building services assignmentBuilding services assignment
Building services assignmentw ss
 
Environmental engineering 2
Environmental engineering   2Environmental engineering   2
Environmental engineering 2R VIJAYAKUMAR
 
1.2 flood damage mitigation reservoirs
1.2 flood damage mitigation reservoirs1.2 flood damage mitigation reservoirs
1.2 flood damage mitigation reservoirsShane_mira
 

La actualidad más candente (20)

S2 GE Slides - Floods (Part 2)
S2 GE Slides - Floods (Part 2)S2 GE Slides - Floods (Part 2)
S2 GE Slides - Floods (Part 2)
 
Minor project 2011 goup f
Minor project 2011 goup fMinor project 2011 goup f
Minor project 2011 goup f
 
2011 liongson-modeling studies flood control dams-professorial chair lecture
2011 liongson-modeling studies flood control dams-professorial chair lecture2011 liongson-modeling studies flood control dams-professorial chair lecture
2011 liongson-modeling studies flood control dams-professorial chair lecture
 
Metro Manila Water Distribution System
Metro Manila Water Distribution SystemMetro Manila Water Distribution System
Metro Manila Water Distribution System
 
7. Urban Pathways and Pressures - John Stack
7. Urban Pathways and Pressures - John Stack7. Urban Pathways and Pressures - John Stack
7. Urban Pathways and Pressures - John Stack
 
Towards A Sustainable Drainage Solution
Towards A Sustainable Drainage SolutionTowards A Sustainable Drainage Solution
Towards A Sustainable Drainage Solution
 
UN Rainwater Harvesting Manual
UN Rainwater Harvesting ManualUN Rainwater Harvesting Manual
UN Rainwater Harvesting Manual
 
Pakistan Flood Control System
Pakistan Flood Control SystemPakistan Flood Control System
Pakistan Flood Control System
 
Flood management m4
Flood management m4Flood management m4
Flood management m4
 
Restoring Natural Drainage System of Delhi
Restoring Natural Drainage System of DelhiRestoring Natural Drainage System of Delhi
Restoring Natural Drainage System of Delhi
 
Financing Disaster Risk in India
Financing Disaster Risk in IndiaFinancing Disaster Risk in India
Financing Disaster Risk in India
 
Southern Institute of Water Resources Research - Water related issues in the ...
Southern Institute of Water Resources Research - Water related issues in the ...Southern Institute of Water Resources Research - Water related issues in the ...
Southern Institute of Water Resources Research - Water related issues in the ...
 
Water Supply and Sanitation Management in Annaba: Constraints and Perspectives
Water Supply and Sanitation Management in Annaba:  Constraints and PerspectivesWater Supply and Sanitation Management in Annaba:  Constraints and Perspectives
Water Supply and Sanitation Management in Annaba: Constraints and Perspectives
 
Dodder River Flood Defence Works - Dave Weston, DCC Flood Defence Unit
Dodder River Flood Defence Works - Dave Weston, DCC Flood Defence UnitDodder River Flood Defence Works - Dave Weston, DCC Flood Defence Unit
Dodder River Flood Defence Works - Dave Weston, DCC Flood Defence Unit
 
Water storage for secure water supply, Ho Chi Minh City
Water storage for secure water supply, Ho Chi Minh CityWater storage for secure water supply, Ho Chi Minh City
Water storage for secure water supply, Ho Chi Minh City
 
River conservation and Water Security Act
River conservation and Water Security ActRiver conservation and Water Security Act
River conservation and Water Security Act
 
Building services assignment
Building services assignmentBuilding services assignment
Building services assignment
 
FLOOD ROUTING WITH REAL-TIME METHOD FOR FLASH FLOOD FORECASTING IN THE PLAIN ...
FLOOD ROUTING WITH REAL-TIME METHOD FOR FLASH FLOOD FORECASTING IN THE PLAIN ...FLOOD ROUTING WITH REAL-TIME METHOD FOR FLASH FLOOD FORECASTING IN THE PLAIN ...
FLOOD ROUTING WITH REAL-TIME METHOD FOR FLASH FLOOD FORECASTING IN THE PLAIN ...
 
Environmental engineering 2
Environmental engineering   2Environmental engineering   2
Environmental engineering 2
 
1.2 flood damage mitigation reservoirs
1.2 flood damage mitigation reservoirs1.2 flood damage mitigation reservoirs
1.2 flood damage mitigation reservoirs
 

Destacado

Destacado (8)

Luxury Vertical Portugal
Luxury Vertical PortugalLuxury Vertical Portugal
Luxury Vertical Portugal
 
Modelo word
Modelo wordModelo word
Modelo word
 
211 - Provide a reception service
211 - Provide a reception service211 - Provide a reception service
211 - Provide a reception service
 
Georgia aniversário
Georgia aniversárioGeorgia aniversário
Georgia aniversário
 
Tbc (tuberculosis)
Tbc (tuberculosis)Tbc (tuberculosis)
Tbc (tuberculosis)
 
Zombaria como-arma-anti-feminista
Zombaria como-arma-anti-feministaZombaria como-arma-anti-feminista
Zombaria como-arma-anti-feminista
 
PEC 116/2011 - "PEC das Cadeiras Negras"
PEC 116/2011 - "PEC das Cadeiras Negras"PEC 116/2011 - "PEC das Cadeiras Negras"
PEC 116/2011 - "PEC das Cadeiras Negras"
 
Os trabalhos academicos
Os trabalhos academicosOs trabalhos academicos
Os trabalhos academicos
 

Similar a Ek24862867

Floodplain Mapping of Krishna River at Karad Using Hec-Ras
Floodplain Mapping of Krishna River at Karad Using Hec-RasFloodplain Mapping of Krishna River at Karad Using Hec-Ras
Floodplain Mapping of Krishna River at Karad Using Hec-RasIRJET Journal
 
Dam Breach Analysis.pptx
Dam Breach Analysis.pptxDam Breach Analysis.pptx
Dam Breach Analysis.pptxAkashPalve7
 
Storm water drainage problem of Surat city & its solutions due to flood in ri...
Storm water drainage problem of Surat city & its solutions due to flood in ri...Storm water drainage problem of Surat city & its solutions due to flood in ri...
Storm water drainage problem of Surat city & its solutions due to flood in ri...Kishan Bhadiyadra
 
Kashmir floods 2014
Kashmir floods 2014Kashmir floods 2014
Kashmir floods 2014ravilbsnaa
 
Mitigating the Menace of Urban Flooding in Uttar Pradesh through Spatial Plan...
Mitigating the Menace of Urban Flooding in Uttar Pradesh through Spatial Plan...Mitigating the Menace of Urban Flooding in Uttar Pradesh through Spatial Plan...
Mitigating the Menace of Urban Flooding in Uttar Pradesh through Spatial Plan...rdvw5xh4ht
 
IRJET- Groundwater Replenishment in Ambernath Region
IRJET- Groundwater Replenishment in Ambernath RegionIRJET- Groundwater Replenishment in Ambernath Region
IRJET- Groundwater Replenishment in Ambernath RegionIRJET Journal
 
Flood-Plain-Managment
Flood-Plain-ManagmentFlood-Plain-Managment
Flood-Plain-ManagmentAli Jatala
 
ASSESSMENT OF TIDAL FOLLD VULNERABILITY OF PUTHENVELIKARA PANCHAYAT
ASSESSMENT OF TIDAL FOLLD VULNERABILITY OF PUTHENVELIKARA PANCHAYATASSESSMENT OF TIDAL FOLLD VULNERABILITY OF PUTHENVELIKARA PANCHAYAT
ASSESSMENT OF TIDAL FOLLD VULNERABILITY OF PUTHENVELIKARA PANCHAYATIRJET Journal
 
Fresh Water Augmentation and Salinity Management in Kuttanad
Fresh Water Augmentation and Salinity Management in KuttanadFresh Water Augmentation and Salinity Management in Kuttanad
Fresh Water Augmentation and Salinity Management in KuttanadIJERA Editor
 
A study on soil erosion and its impacts on floods and sedimentation
A study on soil erosion and its impacts on floods and sedimentationA study on soil erosion and its impacts on floods and sedimentation
A study on soil erosion and its impacts on floods and sedimentationeSAT Publishing House
 
STORMWATER MANAGEMENT FOR PIMPARI CHICHWAD CITY USING GIS
STORMWATER MANAGEMENT FOR PIMPARI CHICHWAD CITY USING GISSTORMWATER MANAGEMENT FOR PIMPARI CHICHWAD CITY USING GIS
STORMWATER MANAGEMENT FOR PIMPARI CHICHWAD CITY USING GISIRJET Journal
 
TEHRI DAM & ITS IMPLICATIONS
TEHRI DAM & ITS IMPLICATIONSTEHRI DAM & ITS IMPLICATIONS
TEHRI DAM & ITS IMPLICATIONSA Y V CHENULU
 
Assessment and Analysis of Maximum Precipitation at Bharkawada Village, Palan...
Assessment and Analysis of Maximum Precipitation at Bharkawada Village, Palan...Assessment and Analysis of Maximum Precipitation at Bharkawada Village, Palan...
Assessment and Analysis of Maximum Precipitation at Bharkawada Village, Palan...RSIS International
 
All about godavari river
All about godavari riverAll about godavari river
All about godavari riverE Venkatesh
 

Similar a Ek24862867 (20)

Floodplain Mapping of Krishna River at Karad Using Hec-Ras
Floodplain Mapping of Krishna River at Karad Using Hec-RasFloodplain Mapping of Krishna River at Karad Using Hec-Ras
Floodplain Mapping of Krishna River at Karad Using Hec-Ras
 
Dam Breach Analysis.pptx
Dam Breach Analysis.pptxDam Breach Analysis.pptx
Dam Breach Analysis.pptx
 
Storm water drainage problem of Surat city & its solutions due to flood in ri...
Storm water drainage problem of Surat city & its solutions due to flood in ri...Storm water drainage problem of Surat city & its solutions due to flood in ri...
Storm water drainage problem of Surat city & its solutions due to flood in ri...
 
A013160108
A013160108A013160108
A013160108
 
Kashmir floods 2014
Kashmir floods 2014Kashmir floods 2014
Kashmir floods 2014
 
Embankment
EmbankmentEmbankment
Embankment
 
Mitigating the Menace of Urban Flooding in Uttar Pradesh through Spatial Plan...
Mitigating the Menace of Urban Flooding in Uttar Pradesh through Spatial Plan...Mitigating the Menace of Urban Flooding in Uttar Pradesh through Spatial Plan...
Mitigating the Menace of Urban Flooding in Uttar Pradesh through Spatial Plan...
 
IRJET- Groundwater Replenishment in Ambernath Region
IRJET- Groundwater Replenishment in Ambernath RegionIRJET- Groundwater Replenishment in Ambernath Region
IRJET- Groundwater Replenishment in Ambernath Region
 
River bank erosion hmm
River bank erosion hmmRiver bank erosion hmm
River bank erosion hmm
 
Flood-Plain-Managment
Flood-Plain-ManagmentFlood-Plain-Managment
Flood-Plain-Managment
 
ASSESSMENT OF TIDAL FOLLD VULNERABILITY OF PUTHENVELIKARA PANCHAYAT
ASSESSMENT OF TIDAL FOLLD VULNERABILITY OF PUTHENVELIKARA PANCHAYATASSESSMENT OF TIDAL FOLLD VULNERABILITY OF PUTHENVELIKARA PANCHAYAT
ASSESSMENT OF TIDAL FOLLD VULNERABILITY OF PUTHENVELIKARA PANCHAYAT
 
Fresh Water Augmentation and Salinity Management in Kuttanad
Fresh Water Augmentation and Salinity Management in KuttanadFresh Water Augmentation and Salinity Management in Kuttanad
Fresh Water Augmentation and Salinity Management in Kuttanad
 
A study on soil erosion and its impacts on floods and sedimentation
A study on soil erosion and its impacts on floods and sedimentationA study on soil erosion and its impacts on floods and sedimentation
A study on soil erosion and its impacts on floods and sedimentation
 
STORMWATER MANAGEMENT FOR PIMPARI CHICHWAD CITY USING GIS
STORMWATER MANAGEMENT FOR PIMPARI CHICHWAD CITY USING GISSTORMWATER MANAGEMENT FOR PIMPARI CHICHWAD CITY USING GIS
STORMWATER MANAGEMENT FOR PIMPARI CHICHWAD CITY USING GIS
 
H0372040043
H0372040043H0372040043
H0372040043
 
TEHRI DAM & ITS IMPLICATIONS
TEHRI DAM & ITS IMPLICATIONSTEHRI DAM & ITS IMPLICATIONS
TEHRI DAM & ITS IMPLICATIONS
 
Assessment and Analysis of Maximum Precipitation at Bharkawada Village, Palan...
Assessment and Analysis of Maximum Precipitation at Bharkawada Village, Palan...Assessment and Analysis of Maximum Precipitation at Bharkawada Village, Palan...
Assessment and Analysis of Maximum Precipitation at Bharkawada Village, Palan...
 
All about godavari river
All about godavari riverAll about godavari river
All about godavari river
 
Silt in Canals
Silt in CanalsSilt in Canals
Silt in Canals
 
Presentation on flood
Presentation on floodPresentation on flood
Presentation on flood
 

Ek24862867

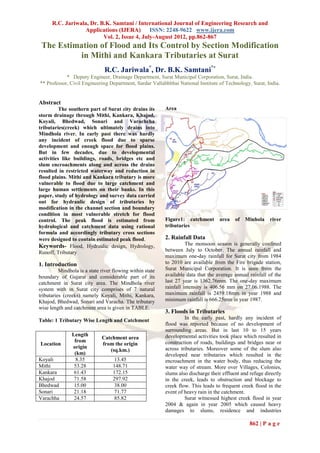
  • 1. R.C. Jariwala, Dr. B.K. Samtani / International Journal of Engineering Research and Applications (IJERA) ISSN: 2248-9622 www.ijera.com Vol. 2, Issue 4, July-August 2012, pp.862-867 The Estimation of Flood and Its Control by Section Modification in Mithi and Kankara Tributaries at Surat R.C. Jariwala*, Dr. B.K. Samtani** * Deputy Engineer, Drainage Department, Surat Municipal Corporation, Surat, India. ** Professor, Civil Engineering Department, Sardar Vallabhbhai National Institute of Technology, Surat, India. Abstract The southern part of Surat city drains its Area storm drainage through Mithi, Kankara, Khajod, Koyali, Bhedwad, Sonari and Varachcha tributaries(creek) which ultimately drains into Mindhola river. In early past there was hardly any incident of creek flood due to sparse development and enough space for flood plains. But in few decades, due to developmental activities like buildings, roads, bridges etc and slum encroachments along and across the drains resulted in restricted waterway and reduction in flood plains. Mithi and Kankara tributary is more vulnerable to flood due to large catchment and large human settlements on their banks. In this paper, study of hydrology and survey data carried out for hydraulic design of tributaries by modification in the channel section and boundary condition in most vulnerable stretch for flood control. The peak flood is estimated from Figure1: catchment area of Minhola river hydrological and catchment data using rational tributaries formula and accordingly tributary cross sections were designed to contain estimated peak flood. 2. Rainfall Data Keywords- Flood, Hydraulic design, Hydrology, The monsoon season is generally confined Runoff, Tributary between July to October. The annual rainfall and maximum one-day rainfall for Surat city from 1984 1. Introduction to 2010 are available from the Fire brigade station, Mindhola is a state river flowing within state Surat Municipal Corporation. It is seen from the boundary of Gujarat and considerable part of its available data that the average annual rainfall of the catchment in Surat city area. The Mindhola river last 27 year is 1362.76mm. The one-day maximum system with in Surat city comprises of 7 natural rainfall intensity is 406.56 mm on 27.06.1988. The tributaries (creeks) namely Koyali, Mithi, Kankara, maximum rainfall is 2459.18mm in year 1988 and Khajod, Bhedwad, Sonari and Varacha. The tributary minimum rainfall is 666.25mm in year 1987. wise length and catchment area is given in TABLE. 3. Floods in Tributaries Table: 1 Tributary Wise Length and Catchment In the early past, hardly any incident of flood was reported because of no development of surrounding areas. But in last 10 to 15 years Length developmental activities took place which resulted in Catchment area from construction of roads, buildings and bridges near or Location from the origin origin across tributaries. Moreover some of the slum also (sq.km.) (km) developed near tributaries which resulted in the Koyali 8.35 13.45 encroachment in the water body, thus reducing the Mithi 53.28 148.71 water way of stream. More over Villages, Colonies, Kankara 61.43 172.15 slums also discharge their effluent and refuge directly Khajod 71.58 297.92 in the creek, leads to obstruction and blockage to Bhedwad 15.00 38.00 creek flow. This leads to frequent creek flood in the Sonari 21.18 71.77 event of heavy rain in the catchment. Varachha 24.57 85.82 Surat witnessed highest creek flood in year 2004 & again in year 2005 which caused heavy damages to slums, residence and industries 862 | P a g e
  • 2. R.C. Jariwala, Dr. B.K. Samtani / International Journal of Engineering Research and Applications (IJERA) ISSN: 2248-9622 www.ijera.com Vol. 2, Issue 4, July-August 2012, pp.862-867 surrounding the drain. Every year there is a chance of to carry out hydraulic design according to the length creek flood in the incidence of heavy rain in the and catchment area. catchment area. There is no control on the creek flood as rain water directly flows in the drain in 4.1Estimation of Storm Water Runoff absence of any water retaining structure. Out of the different methods for estimation of runoff, the rational method is more commonly used and the Though Mithi, Kankara and Khajod same is being used for Design of Mithi and Kankara tributaries are different parts of one river system, the Tributary. problem is more severe in Mithi and Kankara CIA tributary because of large human settlement and Q development on its bank. More over Mithi drain has 36 very large catchment area compared to other drains Where, Q = runoff in m3/sec which make it more vulnerable to flood. Whereas, C = coefficient of runoff Khajod tributary passes through undeveloped area I = intensity of rainfall in cm / hour mostly and there is availability of flood plains which A = area of drainage basin in hectares makes it less vulnerable. Owing to this fact, only Mith and Kankara tributaries are covered under The storm frequency has been adopted as “Once a present study. Two Year” for the design of storm water drains of Mithi and Kankara Tributary, considering the 3.1 Causes of Flood commercial, Industrial and high priced area The flooding could be attributed to many natural and man-made obstacles to the flow of water through the For the design of the Mithi and Kankara Tributary, creeks. the intensity of rainfall is considered as 378 mm/hour (i.e. 1.5 inch/hour) as per the record available. 3.1.1 Man Made Obstacles Some of the prominent man made obstacles causing The runoff coefficient is worked out depending upon constriction to flow are listed below. the imperviousness of the catchment area and time of (a) Reclamation of land along the banks of the creeks concentration. From Homer‟s table, the runoff (b) Constructions of bridges / culverts on the creek coefficient for duration„t‟ equals to 60 minutes are including roads in embankment described in TABLE. (c) Additions of untreated industrial effluent from the industry Tributary Chainage Land Impervi Runoff (d) Suspended materials and non-degradable solids in Use ousness Coeff the city Affluent. 0 to Agriculture Pervious 0.371 (e) Encroachments by Huts and building 43280 constructions along the creeks, reducing flow 43280 to Sparsely 30% Mithi 0.502 area. 48280 Developed Impervious 48280 to Fully 3.1.2 Natural Causes Impervious 0.808 The natural phenomena affecting the flow in creeks 53280 Developed could be 0 to Fully Koyali Impervious 0.808 (a) Rainfall pattern and its intensity. 8350 Developed (b) Topography of the Catchments. 53280 to Fully (c) Cross sectional Area available for flow. Impervious 0.808 57280 Developed (d) Bed gradients. Kankara (e) Transfer of flow from Tapi river to Koyali/ 57280 to Sparsely 30% 0.502 Varachha and vice-versa. 61430 Developed Impervious 4. Hydrology of Mithi and Kankara Table 2: Runoff coefficient Tributary Hydrological study is important aspect to plan for the 4.1.1 Estimation of Peak Discharge for Mithi re-sectioning of existing Streams. Hydrology deals Tributary with surface water, and its occurrences, circulation, distribution, reactions to environment, are concerned The calculation for estimation of peak discharge for for the study. During the process of planning and the Mithi tributary is given in TABLE. re-sectioning of existing Streams, required inputs will be given by this study. The tributaries are divided Table 3: Estimated Discharge at Different into number of reaches to calculate the hydrology and Sections 863 | P a g e
  • 3. R.C. Jariwala, Dr. B.K. Samtani / International Journal of Engineering Research and Applications (IJERA) ISSN: 2248-9622 www.ijera.com Vol. 2, Issue 4, July-August 2012, pp.862-867 of Mithi Tributary Table 5: Estimated Discharge at Different Chainage Area of Run-off Est.Disc Design Cumula Sections of Kankara Tributary catchm coefficie harge Dischar tive In meter ent in nt in ge in m3 Dischar Chaina Area Run- Est. Design Cumulat hector / Sec ge in ge of off Disch Discha ive m3 / Sec m3/sec In catch coeffic arge rge Dischar meter ment ient In m3 In m3 / ge 0 to 2790 0.371 108.68 130.42 130.42 In / Sec Sec In hector m3/sec 13280 13280 to 2907 0.371 113.24 135.89 266.31 Sum of cumulative flow of Mithi and Koyali 915.00 23280 Creek 23280 to 3050 0.371 118.81 142.57 408.88 33280 53280 to 499 0.808 42.33 50.80 965.80 33280 to 1608 0.371 62.64 75.17 484.05 57280 38230 38280 to 1891 0.371 73.66 88.39 572.44 57280 to 500 0.502 30.97 37.16 1002.96 43280 61430 43280 to 1598 0.502 84.23 101.08 673.52 48280 48280 to 558 0.808 47.34 56.81 730.33 5. Hydraulic Design For Tributary Section 51280 51280 to 469 0.808 39.79 47.75 778.08 5.1 Estimating Velocity 53280 The design of channels will be based on a mean velocity determined from the Manning formula as 4.1.2 Estimation of Peak Discharge For given below. Koyali Tributary V = 1/N R2/3 S ½ The calculation for estimation of peak discharge for The coefficient „N‟ is known as Manning‟s rugosity Koyali tributary is given in TABLE. coefficient contains the effect of all the retarding factors influences the flow. Table 4: Estimated Discharge at Different Sections of Koyali Tributary The stretch of Mithi and Kankara tributaries under study passes through urban areas having large Chai Area of Run-off Est. Dis Design Cumu settlements and development on their banks. The nage catch coeff charge Dis lative designed section without any lining would be resulted In meter ment in icient charge Dis in larger section which would not be feasible. Only hector m3 / Sec in charge m3 /Sec in m3/sec feasible option would be to change boundary condition by means of lining. Therefore, for the 0 to design of section of Mithi and Kankara tributary 782 0.808 66.34 79.61 79.61 cement concrete lining is proposed. In this case,the 3000 manning‟s coefficient „N‟ is taken as 0.012. 3000 to 0.808 563 47.76 57.31 136.92 8350 From length of section and fall in reduced level of bed of the drain the falling gradient of bed is found out. The trapezoidal section is most economical section owing to the fact that with the 4.1.3Estimation of Peak Discharge for increase in the discharge available section for the Kankara Tributary flow will be more. Hence, sections are designed The Kankara tributary emerges after confluence of considering trapezoidal section having side slope of Mithi and Koyali tributary. Hence, peak discharge at 1:1. From available parameters the sections are the starting point of Kankara tributary will be designed from following equation in TABLE. summation of peak discharge of Mithi and Koyali tributary. Table 6: Equations Used For Design 864 | P a g e
  • 4. R.C. Jariwala, Dr. B.K. Samtani / International Journal of Engineering Research and Applications (IJERA) ISSN: 2248-9622 www.ijera.com Vol. 2, Issue 4, July-August 2012, pp.862-867 Parameters Equations Table 8: Hydraulic Design Calculations of Mithi Tributary Area of Channel (A) = BD+ nD2 Design Ch. Ch. Ch. Ch. Ch. Ch. Ch. Ch. Parame 44880 46280 47280 48280 49280 50280 51280 52280 Wetted Perimeter (P)= B+ 2Dx √ (n2+1) ters To To To To To To To To 46280 47280 48280 49280 50280 51280 52280 53280 Hydraulic Mean Depth (R)= A/P Design Dischar Constant( K)= √S /N ge 527.6 544.4 561.3 577.0 592.8 608.6 628.5 648.4 3 (m /s) Velocity of Flow (V)= KR2/3 Peak flow 633.1 653.3 673.5 692.5 711.4 730.3 754.2 778.1 Discharge (Q)= AV (m3/s) Length of 5.2 The Profile of Mithi Tributary section 1400 1000 1000 1000 1000 1000 1000 1000 (m) For design of sections for Mithi tributary R.L. of bed at topographical survey has been carried out from Starting 5.125 4.880 4.705 4.530 4.355 4.180 4.005 3.830 chainage 44880 to chainage 53280. From survey data (m) cross sections at the interval of 50m has been prepared. Moreover, longitudinal section of the Mithi R.L. of tributary for chainage 44880 to chainage 53280 is bed at Ending 4.880 4.705 4.530 4.355 4.180 4.005 3.830 3.655 also prepared. The average RL of the invert level at (m) chainage 44880 is 5.125 m and the same at chainage Fall in 53280 is 3.655 m. Hence, for 8400 m length of gradient 0.245 0.175 0.175 0.175 0.175 0.175 0.175 0.175 tributary the total reduction in the RL is 1.47m. The (m) gradient of the Mithi tributary for the portion under consideration has been worked out as 1 in 5715 Conside (0.000175). From topographical survey, the available ring 44.0 46.0 47.0 48.0 50.0 51.0 53.0 54.0 Width depth is 5.0m and after deducting free board of 0.3 m, (B) the available depth for flow is 4.70m. Hence, sections Area of are designed for the flow depth of 4.70m.The section Channel is redesign as per the discharge calculated. 228.9 238.3 243.0 247.7 257.1 264.8 271.2 275.9 (A) 2 5.2.1 Design Calculations (m ) Wetted For reasonable efficient and economical design of the Perimet 57.29 59.29 60.29 61.29 63.29 64.29 66.29 67.29 Mithi Tributary alongwith the consideration of er existing topography and physical feature of Mithi (P ) Tributary, the design parameters for different sections Hyd. from chainage 44880 to chainage 53280 is given in Mean TABLE. Depth 3.99 4.019 4.030 4.041 4.062 4.072 4.091 4.100 (R) Table 7: Design Parameters for Mithi Tributary Constan t 1.102 1.102 1.102 1.102 1.102 1.102 1.102 1.102 Chainage 44280 to 53280 ( K) Length 8400m Velocit y of RL at chainage 53280 5.125 m 2.77 2.787 2.792 2.797 2.806 2.811 2.815 2.824 Flow RL at chainage 59630 3.655 m (m/s) Fall in RL 1.470m Dischar ge (Q) 635.3 664.0 678.4 692.7 721.5 735.9 764.7 779.1 Gradient 1 in 5715 (0.000175) (m3/s) Available depth for flow 5.0 Top Width Manning Coefficient (N) 0.012 54.0 56.0 57.0 58.0 60.0 61.0 63.0 64.0 (T) (m) The hydraulic design calculation of Mithi tributary is given in TABLE 5.3 The Profile of Kankara Tributary 865 | P a g e
  • 5. R.C. Jariwala, Dr. B.K. Samtani / International Journal of Engineering Research and Applications (IJERA) ISSN: 2248-9622 www.ijera.com Vol. 2, Issue 4, July-August 2012, pp.862-867 For design of sections for Kankara tributary, Table 10: Hydraulic Design Calculations of topographical survey has been carried out from Kankara Tributary chainage 53280 to Chainage 59630. From survey Ch. Ch. Ch. Ch. Ch. Ch. Ch. data cross sections at the interval of 50m has been Design 53280 54280 55280 56280 57280 58280 59280 prepared. Moreover, longitudinal section of the Paramet To To To To To To To Kankara tributary for Chainage 53280 to Chainage ers 54280 55280 56280 57280 58280 59280 59630 59630 is also prepared. The average RL of the invert Design level at chainage 53280 is 3.655 and the same at Discharg 773.1 783.7 794.2 804.0 812.3 819.7 827.2 chainage 59630 is 1.508 m. Hence, for 6350m length e (m3/s) of tributary the total reduction in the RL is 2.147m. Peak The gradient of the Kankara tributary for the portion flow 927.7 940.4 953.1 965.8 974.7 983.7 992.6 under consideration has been worked out as 1 in 2935 (m3/s) (0.00034). From topographical survey, it can be derived Total length of that on the upstream side of the tributary available 1000 1000 1000 1000 1000 1000 350 the Drain depth is more whereas on the downstream side it is (m) less. The available depth is 4.6m at chainage 54280 R.L. of and after deducting free board of 0.3 m; the available bed at depth for flow is 4.30m. The available depth is 3.655 3.317 2.979 2.641 2.303 1.965 1.627 Starting continuously reducing on the downstream side and (m) ultimately it is reduced to only 1.508m at chainage R.L. of 59630. Moreover the difference of RL of the ground bed at 3.317 2.979 2.641 2.303 1.965 1.627 1.508 level of two banks of tributary is more in Kankara Ending tributary. The width of designed section will be very (m) Fall in large in case where available depth for flow is less. gradient 0.338 0.338 0.338 0.338 0.338 0.338 0.119 But such sections having larger width will not be (m) feasible because of unavailability of land due to large Availabe human settlements and developmental activity. In Depth 4.30 4.00 3.70 3.40 3.40 3.40 3.40 such cases the tributary sections are designed in the (D) filling taking at most care of balancing cutting and Conside filling. ring 54.0 62.0 71.0 83.0 83.0 84.0 85.0 Width 5.3.1 Design Calculations (B) For reasonable efficient and economical design of the Area of Kankara Tributary alongwith the consideration of Channel 250.7 264.0 276.4 293.8 293.7 297.2 300.6 existing topography and physical feature of Kankara (A) (m2) Tributary, the design parameters for different sections Wetted from chainage 53280 to chainage 59630 is given in Perimete 66.16 73.31 81.46 92.62 92.62 93.62 94.62 r TABLE. (P ) (m) Hydrauli Table 9: Design Parameters for Kankara c Mean Tributary 3.789 3.601 3.393 3.172 3.172 3.314 3.177 Depth 53280 to 59630 (R)(m) Chainage Constant 1.537 1.537 1.537 1.537 1.537 1.537 1.537 Length 6350m ( K) Velocity RL at chainage 53280 3.655 m of Flow 3.734 3.610 3.469 3.317 3.317 3.319 3.320 (V) RL at chainage 59630 1.508 m (m/s) Discharg Fall in RL 2.147m e (Q) 936.2 953.0 958.9 974.4 974.4 986.2 998.0 (m3/s) Gradient 1 in 2935(0.00034) Top Width 63.2 70.6 79.0 90.4 90.4 91.4 92.4 (T) Available depth for flow 4.60 m to 3.70m (m) Manning Coefficient (N) 0.012 6. Advantages of Section Modification The hydraulic design calculation of Kankara tributary The main advantages can be summarized as below. is given in TABLE (i) Restoration of carrying capacity of tributaries, thus easy and prompt disposal of floods and 866 | P a g e
  • 6. R.C. Jariwala, Dr. B.K. Samtani / International Journal of Engineering Research and Applications (IJERA) ISSN: 2248-9622 www.ijera.com Vol. 2, Issue 4, July-August 2012, pp.862-867 dry weather flow without causing any damage [5] H.M. Raghunath, Hydrology: Principles, and nuisance. Analysis, Design (New age International (ii) Control of unauthorized disposal of untreated Publishers, New Delhi, 2005) sewage by adjoining areas. (iii) Protection of ground water thus prevention of [6] Handerson F.M., Open channel flow (The quality of drinking water resources. Mac Millan Company, New York,1996) (iv) The surrounding land can be reclaimed which can be used for plantation and service roads. [7] Subramanya K., Flow in open channels (v) Protection of tributary banks in sustainable (Tata McGraw-Hill, New Delhi, 1991) manner. (vi) More approachable banks for cleaning [8] S.N. Ghosh, Flood control and drainage engineering (Oxford and IBH Publishing 7. Conclusions Co. Pvt. Ltd., New Delhi, 1986) The southern part of Surat city discharges its storm water through tributaries to Mindhola river. [9] Agnihotri P.G. and Patel J.N, Preparation of Due to absence of any controlling structure, the Flood Reduction Plan for Surat City and adjoining areas are vulnerable to the floods every Surrounding Region (India) International year. The Mithi and Kankara tributaries had Journal on Transactions on Fluid witnessed frequent floods due to their large Mechanics ; Issue 2 Volume 3, 2008, 116- catchment. This paper describes method of flood 125 ; WSEAS control by channel section modification in most vulnerable stretch of Mithi and Kankara tributary in [10] Daugherty, et al, Fluid mechanics with Surat city. Due to higher rainfall in this area, the only engineering applications (SI Metric section modification without any lining would be Edition,McGraw-Hill Book Co., 1989) resulted in large sections which would not be feasible looking at the present development along the banks. [11] Chanson, Hubert, The hydraulics of open Owing to this reason it would be necessary to change channel flow: an introduction (Second boundary condition of tributary by means of cement edition,Elsevier Butterworth-Heinemann, concrete lining. The designed section with suggested 2004) cement concrete lining will effectively pass designed flood due to rainfall in the catchment. Apart from [12] U.S. Army Corps of Engineers, Earth and flood control the other advantages would be water rock-fill dams - general design and pollution control, restoration of carrying capacity, construction considerations (Engineering protection of banks, reclamation of land etc. The manual, 1994) care should be taken to leave sufficient space for flood plains on the downstream side of study area [13] Agnihotri P.G. and Patel J.N (2008). Study while preparation of town planning schemes of this of Flood at Surat City and Its Remedial surrounding area adjoining tributary. Measures The 3rd IASME / WSEAS International Conference on Water Resources, Hydraulics & Hydrology, References (WHH'08) University of Cambridge, [1] V. T. Chow, Open-channel hydraulics (Mc Cambridge, UK, during February 23-25, Graw-Hill Book Co., 1959) 2008 [2] Tushar, Mori N. A Seminar Report on [14] Patel J.N., Flood management over region of Estimation and Control of Flood, 2007- river Tapi using GPS” Journal of Geospatial 2008 Today, Vol-I, Issue – 4, October-November, 2002. [3] AjayKumar, flood control and settlement planning (Mohit Publication, New Delhi, 1995) [4] Akash Acharya, Biswaroop Das, Kiran Pandya et al, Surat 2006 floods: a citizens’report (Centre for Social Studies (CSS) Surat and Department of Human Resource Development (DHRD), Veer Narmad South Gujarat University, Surat, 2006) 867 | P a g e