Welcome to International Journal of Engineering Research and Development (IJERD)

This document summarizes an energy audit conducted at the Lalpur water treatment plant in Jabalpur, India. The plant purifies 97 million liters of water per day using two sections of 42MLD and 55MLD. An initial audit was conducted to collect plant data and evaluate energy consumption. A detailed audit then involved meetings, data collection, field investigations, and equipment inventories. Various energy efficiency recommendations were provided, like installing capacitor banks to improve power factor, replacing lighting with more efficient options, and repairing pumps and seals. Implementing the recommendations could save over 30 lakhs rupees per year in energy costs. The audit aims to increase the plant's productivity while reducing energy inputs.

Recomendados
Recomendados
Más contenido relacionado
Similar a Welcome to International Journal of Engineering Research and Development (IJERD)
Similar a Welcome to International Journal of Engineering Research and Development (IJERD) (20)
Más de IJERD Editor
Más de IJERD Editor (20)
Welcome to International Journal of Engineering Research and Development (IJERD)
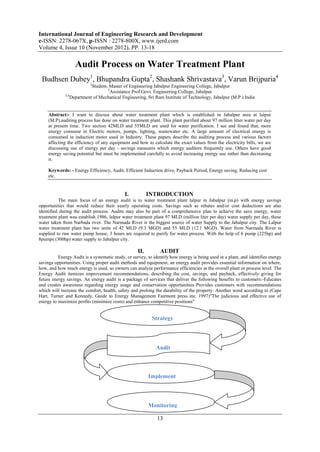
- 1. International Journal of Engineering Research and Development e-ISSN: 2278-067X, p-ISSN : 2278-800X, www.ijerd.com Volume 4, Issue 10 (November 2012), PP. 13-18 Audit Process on Water Treatment Plant Budhsen Dubey1, Bhupandra Gupta2, Shashank Shrivastava3, Varun Brijpuria4 1 Student, Master of Engineering Jabalpur Engineering College, Jabalpur 2 Assistance Prof.Govt. Engineering College, Jabalpur 3,4 Department of Mechanical Engineering, Sri Ram Institute of Technology, Jabalpur (M.P.) India Abstract:- I want to discuss about water treatment plant which is established in Jabalpur area at lalpur (M.P).auditing process has done on water treatment plant. This plant purified about 97 million litter water per day at present time. Two section 42MLD and 55MLD are used for water purification. I see and found that, more energy consume in Electric motors, pumps, lighting, wastewater etc. A large amount of electrical energy is consumed in induction motor used in Industry. These papers describe the auditing process and various factors affecting the efficiency of any equipment and how to calculate the exact values from the electricity bills, we are discussing use of energy per day - savings measures which energy auditors frequently use. Others have good energy saving potential but must be implemented carefully to avoid increasing energy use rather than decreasing it. Keywords: - Energy Efficiency, Audit, Efficient Induction drive, Payback Period, Energy saving, Reducing cost etc. I. INTRODUCTION The main focus of an energy audit is to water treatment plant lalpur in Jabalpur (m.p) with energy savings opportunities that would reduce their yearly operating costs. Savings such as rebates and/or cost deductions are also identified during the audit process. Audits may also be part of a comprehensive plan to achieve the save energy, water treatment plant was establish 1986, lalpur water treatment plant 97 MLD (million liter per day) water supply per day, these water taken from Narbada river. The Narmada River is the biggest source of water Supply to the Jabalpur city. The Lalpur water treatment plant has two units of 42 MLD (9.3 MGD) and 55 MLD (12.1 MGD). Water from Narmada River is supplied to raw water pump house, 3 hours are required to purify for water process. With the help of 6 pump (225hp) and 8pumps (300hp) water supply to Jabalpur city. II. AUDIT Energy Audit is a systematic study, or survey, to identify how energy is being used in a plant, and identifies energy savings opportunities. Using proper audit methods and equipment, an energy audit provides essential information on where, how, and how much energy is used, so owners can analyze performance efficiencies at the overall plant or process level. The Energy Audit itemizes improvement recommendations, describing the cost, savings, and payback, effectively giving for future energy savings. An energy audit is a package of services that deliver the following benefits to customers:-Educates and creates awareness regarding energy usage and conservation opportunities Provides customers with recommendations which will increase the comfort, health, safety and prolong the durability of the property. Another word according to (Cape Hart, Turner and Kennedy, Guide to Energy Management Fairmont press inc. 1997)"The judicious and effective use of energy to maximize profits (minimize costs) and enhance competitive positions" Strategy Audit Implement Monitoring 13
- 2. Audit Process on Water Treatment Plant A-Energy audit flow up diagram The study mainly focuses on improving energy usage efficiency and identifying energy saving and space savings opportunities, during the audit. 2.1-Preli minary Audit Carried for all three plants supply water to Jabalpur City Duration: One Day for each plant Observations: Output and Energy Consumption of each plant Energy saving and are performed to determine if a detailed process audit should be undertaken at a facility. The field work can be as four hours for simple plants (such as lagoon wastewater treatment plants), or as long as one to two days or more for complex facilities. the thrust of a walk-through audit is to collect plant energy data, review energy bills with the customer, compare the facility’s unit energy consumption with plants using similar processes, and Lalpur Water Treatment plant is Biggest one which is selected for detailed energy Audit . 2.2-Detailed Energy Audit 2.2.1-Conducted Meeting: First of all create a meeting with my facility & auditor experts, with the help of decided auditing process on water treatment plant in Jabalpur, the agenda for the meeting can include the following topics, first identification of goals and objective for the audit. Discussion by representatives of the electric utility, water resources, pumps performance etc. Development of B-Plant Layout Audit schedule and detailed discussion of audit goals. Than identification of plant data collected to date and requests for additional data if needed. 14
- 3. Audit Process on Water Treatment Plant 2.2.2-Collected Plant Data: Obtaining plant data is essential to initiating the audit. The data collection effort should be appropriate for the level of effort for the audit. Some useful data can include-plant flow chart (average and yearly total for one year).one year of electric utility bills. Pumping records and pump performance curve and hour per day plant is operated. Design summary and drawings and specification and most important water treatment plant water quality standers, wastewater treatment plant effluent discharge standards. Ener monthly KVA gy fixed avera KWH Total KWH Avg (Bille char charge(Rs/ total ge (PF maximum Month (consume (P. d ge KVA of charge( load penal demand( d) F) dema (pais billing R.s) facto ty) KVA) nd) a per demand r unit) per month MAY(20 1440000 0.9 0 2500 2456 360 165 4937456 84 11) 3 JUN 1367000 0.9 0 2500 2362 360 165 5394544 84 3 JULY 1423800 0.9 0 2500 2388 360 165 5596259 84 3 AUG 1435400 0.9 0 2500 2472 360 165 5652040 84 3 SET 1026300 0.9 0 2500 2440 360 165 5743220 84 3 OCT 1399200 0.9 0 2500 2356 360 165 5527321 84 3 NOV 1373700 0.9 0 2500 2374 360 165 5439473 84 3 DEC 1424900 0.9 0 2500 2356 360 165 5618037 84 3 JAN(201 1480800 0.9 0 2500 2392 360 165 5827459 84 1) 2 FEB 1282600 0.9 0 2500 2384 360 165 5095094 84 2 MARCH 1436600 0.9 0 2500 2416 360 165 5539473 84 2 APR 1376600 0.9 0 2500 2452 360 165 5649473 84 2 TOTAL 16466900 6601984 9 C-Plant Bill Detail (One Year) 2.2.3-Conducted Field Investigation: Detailed field investigation that is used to gain a thorough knowledge of the plant operation. A brief investigation can be accomplished in three day or less for a walk-through audit. Two or four days may be required for a detailed process audit. 2.2.4-Create Equipment Inventory: A typical equipment inventory includes the following information:- Name of equipment. Nameplate horsepower. Hours of operation per year. Field measured power, if available. Kilowatt hours per year. 2.2.5-Follow-Up: Proper follow-up is the most often overlooked element of an energy audit. the enthusiasm for conducting an audit and identifying energy conservation measures quickly dissipates at the conclusion of a study. The flow-up process should be performed for as long as two years to check the progress of implementing conservation measures. Parameters to be monitored include but not limited to:- Plant flow Plant demand, KW Plant energy KWh Demand and energy for individual process or pieces of equipment. Unit energy consumption for the plant (kWh/MG) Pump efficiency as measured 15
- 4. Audit Process on Water Treatment Plant III. CALCULATION PROCESS 3.1-Calculation for Cooling Pump House Staff Room-01 Staff Room-02 Exhaust Fan Fan Jack Pomp House 1 1 1 Rating 350 90 95 Use Hours 12 18 18 Working Days 270 180 180 Present Consumption 1134 291.6 307.8 Pump House Pump House Staff Room-01 Staff Room-02 Cooler Exhaust Fan Fan 42mld 4 1 1 1 Rating 350 90 95 95 Use Hours 12 18 18 18 Working Days 270 180 180 180 Present Consumption 4536 291.6 307.8 307.8 Pump House Staff Room-01 Staff Room-02 Laboratory Exhaust Fan Fan Fan Freeze 55mld 1 1 1 1 1 Rating 350 90 95 95 250 Use Hours 12 18 18 18 12 Working Days 270 180 180 180 365 Present Consumption 1134 291.6 307.8 307.8 1095 3.2-Calculation for Pumping Pump House Pump House Pump House Pump Pump Pump Jack Pomp House 6 42mld 3 55mld 3 Rating(H.P) 215 Rating 225 Rating 350 Use Hours 24 Use Hours 24 Use Hours 24 Working Days 365 Working Days 365 Working Days 365 Present Consumption Present Consumption Present Consumption 8430098 4411098 6861708 3.3-Saving due to Installation of Capacitor Bank Month Consumption Demand PF Demand Reduction Saving unit x save KWH KVA reduces in KVA on fix energy on the charge charge x base of only incentive% .93 KVA demand April 1376600 2452 0.92 2280 172 28380 247788 276168 March 1436600 2416 0.92 2246 170 28050 247777 275827 Feb 1282600 2384 0.92 2217 167 27555 230868 258423 Jan 1480800 2392 0.93 2224 168 27720 266544 294264 Dec 1424900 2356 0.93 2191 165 27225 256482 283707 Nov 1373700 2374 0.93 2207 167 27555 247610 275165 Oct 1399200 2356 0.93 2191 165 27225 241856 279081 Sept 1026300 2440 0.93 2269 171 28215 258462 286677 Aug 1435400 2472 0.93 2299 173 28545 258372 286917 16
- 5. Audit Process on Water Treatment Plant Jul 1423800 2388 0.93 2221 167 27555 256284 283839 Jun 1367000 2362 0.93 2196 165 27225 246060 273285 May 1440000 2456 0.93 2284 172 28380 259200 287580 TOTAL 16466900 24545 308630 3017303 3360933 IV. RESULT RECOMMENDATION & EXPECTED SAVING:- 4.1-Recommendation for pump & motor Investment Recommended No of Energy saving Savings in Capital Pay Back grad Measure Fittings (KVA) Rs./ year Investment in Period Rs Low cost Replacement of 119 14700 51750 47600 11 month magnetic Ballast and tub- light with electronics tub light Power factor 2400 KVA 153.38KVA 39 lac 15 lac 5 month improvement (Connected reduction in by installing Load) demand capacitor bank Power factor improvement by installing capacitor bank which increase the power factor (0.99) and gives 153.38 KVA reduction in demand at a load of 2400 KVA(Connected Load) that saves 39 lack per annum. Properly size to the load for optimum efficiency. (High efficiency motors offer of 4 - 5% higher efficiency than standard motors) Repair seals and packing to minimize water waste. Use siphon effect to advantage: don't waste pumping head with a free-fall (gravity) return. Use energy-efficient motors where economical & synchronous motors to improve power factor. Check for under-voltage and over-voltage conditions. 4.2-Recommendation for lighting The main recommendation is to replace the recessed fluorescent lighting system in the general area and maintenance office. By Replacement of magnetic Ballast with electronics in existing tub light s i.e. 119 fittings having potential saving of 14700 kWh that save 51750 Rs/Year. Select ballasts and lamps carefully with high power factor and long-term efficiency in mind. Use task lighting and reduce background illumination. 4.3-Recommendation for Water & Wastewater • Recycle water, particularly for uses with less-critical quality requirements. • Recycle water, especially if sewer costs are based on water consumption. • Test for underground water leaks. (It's easy to do over a holiday shutdown.) • Check water overflow pipes for proper operating level. • Provide proper tools for wash down -- especially self-closing nozzles. V. CONCLUSION With the help of this paper, we have concluded, An Energy audit increases the productivity of organization. Energy audit helps to increase output of any industry and decreases input power. Energy audit provides batter stability to the industry or organization then the other audits. We also addressed several problem areas which can result in over-optimistic savings projections, and suggested ways to prevent mistakes. Finally, several areas where additional research, analysis, and data collection are needed were identified. Once this additional information is obtained, we can all produce better and more accurate energy audit results. REFERENCES [1]. Bureau of Energy Efficiency handbook. [2]. Li Yingjian et.al (2010) Energy Auditing and Energy Conservation Potential for Glass Work. [3]. G.Kabriet.al (2010) Energy audit & conservation opportunities for pyroprocessing unit of a typical dry process cement plant. [4]. Cape Hart, Turner and Kennedy, Guide to Energy Management Fairmont press Inc. 1997 [5]. G.D Rai Non-Conventional Energy Resources. Revised edition 2000. 17
- 6. Audit Process on Water Treatment Plant [6]. Dr. Ravi Shankar, Industrial Engineering &Management Book 2007. (IIT, Delhi). [7]. R. Saidur Department of Mechanical Engineering, University of Malaya, 50603 Kuala Lumpur, Malaysia,2010. [8]. MoncefKrarti, Energy Audit of Building system- An Engineering Approach.., CRC Press LLC 2000. [9]. Gallaher KP. Free trade and the environment: Mexico, NAFTA, and Beyond. Stanford University Press; 2004. p. 125. [10]. Dasgupta S, Hettige H, Wheeler D. What improves environmental compliance? Evidence from Mexican industry. Journal of Environmental Economics and Management 2000; 39(1):39e66. [11]. A.Fenu, J.Roelset.at (2010) Energy audit of a full scale MBR system. [12]. M.Siddharthabhatt (2000) Energy audit case studies I-Steam systems. [13]. Gajendrasinghet.al (2010) Energy Efficient Industrial Motors. [14]. Bureau of Energy Efficiency, (under Ministry of Power, Government of India Hall no.4, 2nd Floor, [15]. IS 4029: 1967 ( Fifth Reprint 1984): Guide for testing Three phase induction motors [16]. IS 325: 1996: Three Phase induction motors- Specification 18