IOSR Journal of Pharmacy (IOSRPHR)
•
1 recomendación•292 vistas

This document summarizes a study on the physical growth and nutritional status of 340 men from the Dulia tribe in Visakhapatnam District, Andhra Pradesh, India aged 20-60 years. 18 anthropometric measurements were taken and the mean, standard deviation, and variance were calculated for each. Based on Body Mass Index classifications, 20.29% of men were underweight, 3.23% were overweight, and 0.29% were obese. Both underweight and overweight coexisted in this population. The study found that physical growth measurements generally increased with age. The high prevalence of underweight was likely due to insufficient nutrients in their diet and lack of food variety.

Recomendados
Recomendados
Más contenido relacionado
La actualidad más candente
La actualidad más candente (20)
Similar a IOSR Journal of Pharmacy (IOSRPHR)
Similar a IOSR Journal of Pharmacy (IOSRPHR) (20)
Más de iosrphr_editor
Más de iosrphr_editor (20)
Último
Último (20)
IOSR Journal of Pharmacy (IOSRPHR)
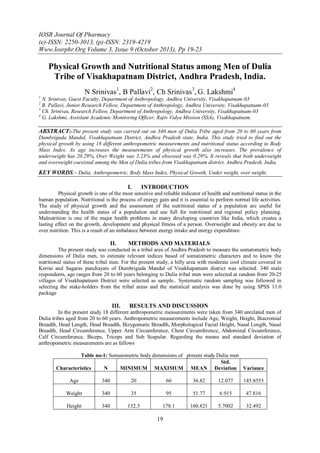
- 1. IOSR Journal Of Pharmacy (e)-ISSN: 2250-3013, (p)-ISSN: 2319-4219 Www.Iosrphr.Org Volume 3, Issue 9 (October 2013), Pp 19-23 Physical Growth and Nutritional Status among Men of Dulia Tribe of Visakhapatnam District, Andhra Pradesh, India. N Srinivas1, B Pallavi2, Ch Srinivas3, G. Lakshmi4 1 N. Srinivas, Guest Faculty, Department of Anthropology, Andhra University, Visakhapatnam-03 B. Pallavi, Junior Research Fellow, Department of Anthropology, Andhra University, Visakhapatnam-03 3 Ch. Srinivas, Research Fellow, Department of Anthropology, Andhra University, Visakhapatnam-03 4 G. Lakshmi, Assistant Academic Monitoring Officer, Rajiv Vidya Mission (SSA), Visakhapatnam. 2 ABSTRACT:-The present study was carried out on 340 men of Dulia Tribe aged from 20 to 60 years from Dumbriguda Mandal, Visakhapatnam District, Andhra Pradesh state, India. This study tried to find out the physical growth by using 18 different anthropometric measurements and nutritional status according to Body Mass Index. As age increases the measurements of physical growth also increases. The prevalence of underweight has 20.29%, Over Weight was 3.23% and obsessed was 0.29%. It reveals that both underweight and overweight coexisted among the Men of Dulia tribes from Visakhapatnam district, Andhra Pradesh, India. KEY WORDS:- Dulia, Anthropometric, Body Mass Index, Physical Growth, Under weight, over weight. I. INTRODUCTION Physical growth is one of the most sensitive and reliable indicator of health and nutritional status in the human population. Nutritional is the process of energy gain and it is essential to perform normal life activities. The study of physical growth and the assessment of the nutritional status of a population are useful for understanding the health status of a population and use full for nutritional and regional policy planning. Malnutrition is one of the major health problems in many developing countries like India, which creates a lasting effect on the growth, development and physical fitness of a person. Overweight and obesity are due to over nutrition. This is a result of an imbalance between energy intake and energy expenditure. II. METHODS AND MATERIALS The present study was conducted in a tribal area of Andhra Pradesh to measure the somatometric body dimensions of Dulia men, to estimate relevant indices based of somatometric characters and to know the nutritional status of these tribal men. For the present study, a hilly area with moderate cool climate covered in Korrai and Sagaras panchayats of Dumbriguda Mandal of Visakhapatnam district was selected. 340 male respondents, age ranges from 20 to 60 years belonging to Dulia tribal men were selected at random from 20-25 villages of Visakhapatnam District were selected as sample.. Systematic random sampling was followed in selecting the stake-holders from the tribal areas and the statistical analysis was done by using SPSS 11.0 package III. RESULTS AND DISCUSSION In the present study 18 different anthropometric measurements were taken from 340 unrelated men of Dulia tribes aged from 20 to 60 years. Anthropometric measurements include Age, Weight, Height, Biacromial Breadth, Head Length, Head Breadth, Bizygomatic Breadth, Morphological Facial Height, Nasal Length, Nasal Breadth, Head Circumference, Upper Arm Circumference, Chest Circumference, Abdominal Circumference, Calf Circumference, Biceps, Triceps and Sub Scapular. Regarding the means and standard deviation of anthropometric measurements are as fallows Table no-1: Somatometric body dimensions of present study Dulia men Std. Characteristics N MINIMUM MAXIMUM MEAN Deviation Variance Age 340 20 60 36.82 12.077 145.8555 Weight 340 35 95 51.77 6.915 47.816 Height 340 132.3 178.1 160.821 5.7002 32.492 19
- 2. Physical Growth And Nutritional Status… Biacromial Breadth 340 16.5 37.8 31.654 2.1215 4.501 Head Length 340 14.5 20.0 17.287 0.9431 0.889 Head Breadth Bizygmatic Breadth Morphological Facial Height 340 11.0 15.2 13.808 0.6054 0.366 340 9.3 15.0 10.871 0.6767 0.458 340 9.8 13.8 11.854 0.7114 0.506 Nasal Length 340 3.5 8.6 5.213 0.6316 0.399 Nasal Breadth Head Circumference Upper Arm Circumference Chest Circumference (ex) Chest Circumference (in) Abdominal Circumference Calf Circumference 340 3.1 5.7 3.782 0.3640 0.133 340 52 67 55.89 1.854 3.438 340 21 35 26.42 2.118 4.486 340 73 103 86.50 4.819 23.218 340 70 105 88.82 5.0008 25.082 340 30 95 74.90 6.659 44.344 340 28 40 33.07 2.176 4.736 Biceps 340 .2 1.8 .401 .1379 .019 Triceps 340 .3 1.8 .536 .1878 .035 Sub Scapular 340 .3 2.0 .865 .2728 .074 Body Mass Index 340 13.80 35.53 20.0161 2.39221 5.723 From Table-1 it is observed that Mean weight of Men of Dulia Tribes was 51.77, standard deviation was 6.915 and variance was 47.816. Mean of Height was 160.821, standard deviation was 5.7002 and variance was 32.492. Mean of Biacromial Breadth was 31.654, standard deviation was 2.1215 and variance was 4.501. Mean of Head Length was 17.287, standard deviation was 0.9431 and variance was 0.889. Mean of Head Breadth was 13.53, standard deviation was 0.6054 and variance was 0.366. Mean of Bizygomatic Breadth was 10.871, standard deviation was 0.6767 and variance was 0.458. Mean of Morphological Facial Height was 11.854, standard deviation was 0.7114 and variance was 0.506. Mean of Nasal Length was 5.213, standard deviation was 0.6316 and variance was 0.399. Mean of Nasal Breadth was 3.782, standard deviation was 0.3640 and variance was 0.133. Mean of Head Circumference was 55.89, standard deviation was 1.854 and variance was 3.438. Mean of Upper Arm Circumference was 26.42, standard deviation was 2.118 and variance was 4.486. Mean of Chest Circumference (ex) was 86.50, standard deviation was 4.891 and variance was 23.218. Mean of Chest Circumference (in) was 88.82, standard deviation was 5.008 and variance was 25.082. Mean of Abdominal Circumference was 74.90, standard deviation was 6.659 and variance was 44.344. Mean of Calf Circumference was 33.07, standard deviation was 2.176 and variance was 4.736. Mean of Biceps was 0.401, standard deviation was 0.1379 and variance was 0.019. Mean of Triceps was 0.536, standard deviation was 0.1878 and variance was 0.035. Mean of Sub Scapular was 0.865, standard deviation was 0.2728 and variance was 0.074. 20
- 3. Physical Growth And Nutritional Status… Classification of Body Mass Index as per WHO reports was taken into consideration for the present study. < 18.5 - Under weight 18.5 to 24.9 - Normal weight 25.0 to 29 - Over weight 30.0 to 34.9 - Class I Obesity 35.0 to 39.9 - Class II Obesity > - 40.0 - Class III Obesity Table-2: Distribution of Body Mass Index (BMI) by Age in Men of Dulia Tribe AGE (Yrs) NORMAL 20 21 22 23 24 25 26 27 28 29 30 31 32 33 34 35 36 37 38 39 40 41 42 43 44 45 46 47 48 49 50 51 52 53 54 55 56 57 58 59 60 26 11 6 6 1 13 10 10 3 4 15 2 10 1 5 5 11 7 8 4 5 10 4 3 6 14 13 6 2 5 1 4 2 4 6 6 2 2 3 3 259 Under Weight 11 1 2 1 2 2 3 1 2 2 2 2 5 2 2 4 1 4 1 2 2 1 5 3 1 1 1 3 69 Over Weight Total 1 1 1 1 3 3 1 11 21 Obese 1 1 38 12 8 7 3 14 10 12 6 4 16 3 12 1 5 7 13 7 10 6 8 15 4 8 8 18 14 10 2 6 3 7 3 9 6 9 3 3 4 6 340
- 4. Physical Growth And Nutritional Status… Table- 2A: Distribution of Underweight, Normal, Overweight and Obese Normal Underweight Overweight Obese 259 (76.17%) 69 (20.29%) 11 (3.23%) 1 (0.29%) Fig-1: Graph showing Age, Weight, Height and Body Mass Index of Men of Dulia Tribe From Table-2 & 2A, the Body Mass Index is observed that nearly 69 (20.29%) men were underweight, 11 (3.23%) were overweight and 1(0.29%) was obsessed (Fig-1). IV. CONCLUSIONS Dulia population who lived in agency (Tribal) area which is naturally harboured with hills and tress. Regarding physical growth of men of Dulia tribes it is observed that as the age increases that all the physical anthropometric measurements also increased. Regarding the Body Mass Index it is observed that nearly 69 men are underweight, 11 are overweight and 1(one) was obsessed. Majority of men were physical normal and healthy, it reveals that physical growth is normal and they are living with sufficient nutritional requirements. It is identified that Men of Dulia tribes resembles like that of other tribes of Andhra Pradesh in all aspects of physical growth. In the present study it is noted that 20.29% were under weight because of malnutrition, 3.23% of population were overweight because of over nutrition and lack of physical activity and only 0.29% was obsessed. Even though they are living naturally harboured hilly area, the rate of underweight (20.29%), and overweight (3.23%) alarms the situation, which leads to major health problems in future. The present study of showed that the prevalence of underweight was 20.29%, overweight was 3.23% and obese was 0.29% among the men of Dulia tribes during the age groups of 20 to 60 years. High rate of underweight among men of Dulia tribes is due to insufficient nutrients in their dietary foods and also non availability of different food varieties. Both underweight and overweight coexisted among them. Nutritional status of the Dulia tribes requires attention for the improvement of the health status as this problem may have long term Health problems. This types of study is helpful to find out the high risk groups for various diseases. V ACKNOWLEDGMENTS We are very thankful to the Dulia Population who spared their valuable time. REFERENCES [1]. [2]. [3]. [4]. [5]. [6]. [7]. [8]. [9]. Growth and physique studies, in Human Biology: J. M. Tanner, J. Hiernaux, and S. Jarman, A guide to field methods, J. S. Weiner and J. A. Lourie, EDS., 315- 340, Blackwell publication, oxford, UK, 1969. Genetic survey among the Nagavamsam caste of coastal Andhra Pradesh. 1981 T. V. Rao, P. Veerraju, J. M. Naidu and U. V. K. Rao. Indian jounal of physical Anthropology and Human Genetics, 7(2) : 69 – 76. Genetic Morkers in eight Endogamous population groups from Andhra Pradesh ( south India). 1981 H. Walter, K. P. Pahl, M. Hilling, P. Veerraju, J. D. Goud, J. M Naidu, M. S. Bbu and G. Jaikishan. Zeitzchrift fur Morphologie and Anthropologie, 72(3) : 325 – 338.15. 1982 J. M. Naidu. Chose the right life partner. Science Reporter, March 186 – 188. An Anthropometric study of Indian Wrestlers. 1989 G. V. Ramana and J. M. Naidu, South Asian Anthropologist, 10: 35 – 338. Genetics of Facial and Head Measurements. 1989 M. Rama Devi and J. M. Naidu. Spectra Anthropological progress. 11: 25- 30. Worldwide Variation in Human Growth, P. H. Eveleth and J. M. Tanner, Cambridge, Mass, USA, 2nd edition, 1990. Anthropometric profile of five Andhra Populations. 1992 J. M. Naidu and B. V. Babu. South Asian Anthropologist. 13 : 47 - 50. Socio – cultural profile f Tribes of Andhra Pradesh. Mohan Rao K. (1993). Tribal Cultural Research and Training Institute (Tribal Welfare Department), Andhra Pradesh, Hyderabad. World health organization, Global strategy for non communicable disease prevention and control (Draft), world health organization, Geneva, Switzerland, 1997. 22
- 5. Physical Growth And Nutritional Status… [10]. [11]. [12]. [13]. [14]. [15]. [16]. [17]. [18]. [19]. [20]. [21]. [22]. [23]. [24]. [25]. [26]. [27]. [28]. Anthroposcopic variation among sub tribes of Mali from Andhra Pradesh. 2000 Babu, B. V.; Y. S. Kusuma and J. M. Naidu. The Anthropologist 2 (3) 143 – 146. “Introduction,” in physical activity and obesity, C. Bouchard, Ed., pp. 3- 19, Human Kinetics, Champaign, III, USA, 2000. “The obesity epidemic: introduction,” in physical activity and obesity, C. Bouchard, Ed., pp. 3 - 20, Human Kinetics Books, Champaign, III, USA, 2000. “The disadvantage of junk food,” B. Jim, 2001, http://www.livestrong.com/article/425388- the- disadvantages - of – junk- food/. “The shift in stages of the nutritional transition in the developing world differ from past experiences,” B. M. Popkin, Public health nutrition, vol. 5, no. 1, pp. 205- 214, 2002. “Obesity the big issue,” A. Langlois, 2003, report prepared for J. P. Morgan. “The world health organization global database on child growth and malnutrition: methodology and applications,” M. De Onis and M. Blossner, International journal of Epidemiology, vol.32, no. 4, pp. 518- 526, 2003. “Obesity in childhood and adolescence,” in growth, maturation, and physical activity, R. M. Malina, C. Bouchard and O. Bar Or, eds., pp. 527-551, Human Kinetic Books, Champaign, III, USA, 2 nd edition, 2004. Physical activity as a factor in growth, maturation, and physical activity, R. M. Malina, C. Bouchard and O. Bar - Or, pp. 509525, Human Kinetics, 2nd edition, 2004. “A nutritional paradox : underweight and obesity in developing countries,” B Caballero, The new England journal of medicine, vol.352, no. 15, pp. 1514- 1516, 2005. “Combined influence of Body Mass Index and Waist Circumference on coronary artery disease risk factors among children and adolescent,” I. Janssen, P. T. Katzmarzyk, S. R. Srinivasan et al., paediatrics, vol. 115, no. 6, pp. 1623- 1630, 2005. “Pattern of chronic energy diseases amongst adolescent obese children in developing countries,” S. Kaur, U. Kapil, and P. Singh, current science, vol. 88, no. 7, pp. 1052- 1056, 2005. “Body fitness and sexual maturation status,” E. B. Bodzsar, Anthropological Notebooks, vol. 10, no. 1, pp. 12- 17, 2005. “Factors affecting prevalence of overweight among 12- to 17 year- old urban adolescent in Hyderabad, India, Obesity A. Laxmaiah, B. Ngalla, K. Vijayaraghavan, and M. Nair, vol. 15, no. 6, pp. 1384- 1390, 2007. “Biology of the tribal groups of Rajasthan, India: age change in somatoscopy,” M.K. Bhasin and S. Jain, Anthropologist, vol. 9, no. 4, pp. 257- 265, 2007. “Biology of the tribal groups of Rajasthan, India: 7. Occurrence of nutritional deficiencies,” M. K. Bhasin and S. Jain, Anthropologist, vol. 9, no. 4, pp. 288, 2007. “Biology of the tribal groups of Rajasthan, India: 6. A comparative study of the nutritional status,” M. K. Bhasin and S. Jain, Anthropologist, vol. 9, no. 4, pp. 273 – 279, 2007. “Prevalence of overweight and obesity among the Meitei adolescent of Manipur, India,” J. W. Dhakar and M. S. Singh, Anthropologist, vol. 14, no. 4, pp. 347- 351, 2012. Physicl growth and nutritional status among Ao Naga Children of Nagaland, Northeast India. Temsumongla Longkumer, journal of Anthropology, vol. 2013, Article ID 291239. 23