PISA Summary Singapore
•
1 recomendación•658 vistas

The document summarizes the top performing education systems in the 2012 Programme for International Student Assessment (PISA) for mathematics, reading, and science literacy based on paper-based and computer-based assessments. Shanghai had the highest average scores for mathematics, reading, and science literacy on the paper-based assessment. On the computer-based assessment, Singapore had the highest average scores for mathematics and reading literacy. The tables and figure also show the education systems that did not have significantly different average scores from Singapore.

Recomendados
Más contenido relacionado
Destacado
Destacado (20)
Similar a PISA Summary Singapore
Similar a PISA Summary Singapore (20)
Más de Jimmy Keng
Más de Jimmy Keng (20)
Último
Último (20)
PISA Summary Singapore
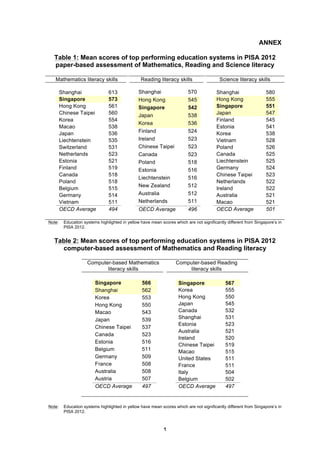
- 1. ANNEX Table 1: Mean scores of top performing education systems in PISA 2012 paper-based assessment of Mathematics, Reading and Science literacy Mathematics literacy skills Shanghai Singapore Hong Kong Chinese Taipei Korea Macao Japan Liechtenstein Switzerland Netherlands Estonia Finland Canada Poland Belgium Germany Vietnam OECD Average Note: 613 573 561 560 554 538 536 535 531 523 521 519 518 518 515 514 511 494 Reading literacy skills Shanghai Hong Kong Singapore Japan Korea Finland Ireland Chinese Taipei Canada Poland Estonia Liechtenstein New Zealand Australia Netherlands 570 545 542 538 536 524 523 523 523 518 516 516 512 512 511 OECD Average 496 Science literacy skills Shanghai Hong Kong Singapore Japan Finland Estonia Korea Vietnam Poland Canada Liechtenstein Germany Chinese Taipei Netherlands Ireland Australia Macao OECD Average 580 555 551 547 545 541 538 528 526 525 525 524 523 522 522 521 521 501 Education systems highlighted in yellow have mean scores which are not significantly different from Singapore’s in PISA 2012. Table 2: Mean scores of top performing education systems in PISA 2012 computer-based assessment of Mathematics and Reading literacy Computer-based Mathematics literacy skills Singapore Shanghai Korea Hong Kong Macao Japan Chinese Taipei Canada Estonia Belgium Germany France Australia Austria OECD Average Note: Computer-based Reading literacy skills 566q 562q 553 550 543 539 537 523 516 511 509 508 508 507 497 Singapore Korea Hong Kong Japan Canada Shanghai Estonia Australia Ireland Chinese Taipei Macao United States France Italy Belgium OECD Average 567q 555 550 545 532 531 523 521 520 519 515 511 511 504 502 497 Education systems highlighted in yellow have mean scores which are not significantly different from Singapore’s in PISA 2012. 1
- 2. Figure 1: Proportion of Low Performers in PISA 2009 and PISA 2012 2