SlideShare una empresa de Scribd logo
1 de 5
Descargar para leer sin conexión
Mutual Fund Monthly Review                                                                                                             November 2012

Mutual Fund Industry Vital Signs
Starting assets	             (October 31, 2012)	                       $683.9 billion
+ net sales 		                                                         $2.6 billion
+/- estimated market effect		                                          $0.4 billion (0.1%)
= Ending assets	             (November 30, 2012)	                      $686.9 billion


Vitals Signs by Fund Category for November 2012
	                                           Top 3 Categories	                                       Bottom 3 Categories	
Asset Growth ($)	                           Canadian Fixed Income: $2.312 billion	                  Canadian Neutral Balanced: $1.089 billion
	                                           High Yield Fixed Income: $1.303 billion	                Global Equity Balanced: $1.036 billion
	                                           Cdn. Fixed Income Balanced: $1.249 billion	             Global Fixed Income: $773 million      	
Asset Growth	                               Alternative Strategies: 7.8%	                           Global Fixed Income: -10.9%
(as a % of starting assets)	                High Yield Fixed Income: 7.8%	                          Precious Metals Equity: -9.2%
	                                           Tactical Balanced: 4.4%	                                Natural Resources Equity: -5.5%	
Net Sales ($)	                              Canadian Fixed Income: $1.060 billion	                  Canadian Money Market: -$461 million
	                                           Global Neutral Balanced: $907 million	                  Canadian Equity Balanced: -$353 million
	                                           Cdn. Fixed Income Balanced: $882 million	               Canadian Equity: -$338 million	
Net Sales	                                  Alternative Strategies: 11.3%	                          Global Small/Mid Cap Equity: -3.6%
(as a % of starting assets)	                Tactical Balanced: 4.0%	                                U.S. Money Market: -3.2%
	                                           Global Fixed Income Balanced: 2.9%	                     Cdn. Inflation Protected Fix. Income: -3.1%	
Performance	                                Asia Pacific Equity: 1.8%	                              Precious Metals Equity: -8.9%
(Fund category averages)	                   International Equity: 1.6%	                             Natural Resources Equity: -3.7%
	                                           Financial Services Equity: 1.5%	                        Cdn. Small/Mid Cap Equity: -2.0%

	 Note: Asset growth figures can be affected by a change in the number of companies reporting to IFIC
	 and by fund category changes.
    Source: IFIC except for Performance where the source is Fundata.


November 2012 –                                                                                Did You Know?
Product Development Highlights                                                                 According to the 2012 Investment Company Fact Book,
                                                                                               U.S.-registered investment companies managed
Vanguard Investment Canada launched five new ETFs on the Toronto Stock                         $13.0 trillion at the end of 2011, a $129 billion
Exchange. The new funds include currency-hedged and un-hedged S&P 500                          decrease from a year earlier. While mutual funds
index funds, a Canadian dividend fund, a Canadian REIT fund and a                              experienced net outflows of $100 billion in 2011, ETF
short-term Canadian corporate bond fund. The firm also introduced a                            assets grew $118 billion over the same period.
distribution reinvestment program.                                                             However, mutual funds still retain the lion’s share
RBC Asset Management launched two new low-volatility equity products:                          (90%) of industry assets in the U.S.
RBC QUBE Low Volatility Canadian Equity and RBC QUBE Low Volatility U.S.
Equity. A third low-volatility fund, focused on global equities has received                       Investment Company Net Assets ($ billions)
final prospectus approval. The management fees on the new funds that are
currently available are 1.75% (Series A). The firm also launched BlueBay
Global Convertible Bond, which will invest primarily in a geographically
diversified portfolio of bonds that are convertible to equities (1.70%
management fees for Series A).                                                                                       $11,622
                                                                                                                     Mutual Funds
Scotia Asset Management launched five new funds that will hold combina-
tions of funds from bank-owned ScotiaFunds, Dynamic Funds and Scotia
Private Pools as well as CI Funds: Scotia Canadian Equity Blend Class, Scotia                                                                    Closed-end
U.S. Equity Blend Class, Scotia International Equity Blend Class, Scotia Fixed                                                                   funds
Income Blend Class, and Scotia Selected Income Portfolio. Scotia also                                                                            $239
launched Scotia U.S. Dividend.                                                                                                                $1,048
                                                                                                                                              ETFs
BMO Exchange Traded Funds launched BMO S&P/TSX Laddered Share Index.
                                                                                                                                       $60
The fund essentially creates an interest-rate ladder by holding equal amounts                                                          UITs
of preferred shares whose reset dates fall over the next five years or “term
buckets”. The firm also launched BMO S&P 500 Index, BMO S&P/TSX Equal                                    Source: 2012 Investment Company Fact Book
Weight Industrials Index and BMO S&P/TSX Equal Weight Global Gold Index.


EquiSoft specializes in the design and development of digital business solutions primarily for the financial industry. For more information please contact:
Jonathan Georges, CIM, FCSI , Vice President, Financial Products. T: 514.989.3141 X 201 | T: 888.989.3141 | Jonathan.Georges@equisoft.com | www.equisoft.com.
©2012 EquiSoft consulting and software solutions.
A sales-oriented web suite
                                                        designed to help advisors
                                                        grow their business
                                                        INVESTMENTS                              FINANCIAL PLANNING                     INSURANCE


                                                        WealthElements is a comprehensive, customizable
                                                        and fully integrated suite of tools designed to help
                                                        financial advisors manage every element of their
                                                        clients’ wealth.

                                                        ■■   Ideal for use with existing              ■■   Client data import through
                                                             clients or as part of a client                back-office integration.
                                                             acquisition strategy.
                                                                                                      ■■   Connectivity to insurance
                                                        ■■   Streamlined process that                      illustration systems.
                                                             couples comprehensive analysis
                                                                                                      ■■   Aggregation of a broad range
                                                             with speed and efficiency.
                                                                                                           of investment product data
                                                                                                           including mutual funds, ETFs,
                                                                                                           stocks, bonds and SMAs.

                                                                                                      ■■   Configurable at the corporate
                                                                                                           and individual level.

                                        Asset                                                         ■■   Supports multiple currencies.
                                        Allocation Analyst
                   Electronic                                  Investment                             ■■   Simple, multi-lingual interface.
                   Application
                                      IGATION                  Policy Statement

                               D   NAV                                                                ■■   Customizable, client-friendly
                             TE                                                                            reports and proposals.
                         A
                       GR


                                                              DA


   Insurance                                                                      Net Worth
                                                                TA S
                   INTE


   Illustrations
                                                                    HARING
                    INT


Critical Illness                                                                     Cash Flow
Insurance Needs
                       EG


                             RA
                               TE
                                    D R E P O RT I N G

           Disability                                                    Retirement Needs
           Insurance Needs


                             Life                   Education Needs
                             Insurance Needs
Each of the WealthElements modules can be used on its own or in conjunction with any number
of integrated modules to create a customized proposal that is right for your client.


                                                                                                                             Investments


A simple 4-step portfolio construction and analytics process that helps build a compelling case for your investment
recommendations.The Asset Allocation Analyst module’s comprehensive list of analytics range from a simple investment growth
chart to Alpha, Sortino and Monte Carlo metrics, allowing you to create a proposal that is as simple or complex as required.
                                        MARK BOKER                                           MARK BOKER


                                                                     1                                    2


                                                                         MARK BOKER                                        MARK BOKER


                ABC111 Fund 1                                                         3                                                 4
                ABC222 Fund 2


                ABC333 Fund 3


                ABC444 Fund 4


                                                     ABC111 Fund 1
                                                     ABC222 Fund 2

                                                     ABC333 Fund 3

                                                     ABC444 Fund 4
                                                     ABC555 Fund 5


Create an Investment Policy Statement (IPS) outlining general portfolio objectives and strategies as agreed to with your client.
This important document helps set appropriate portfolio expectations and reduces the likelihood of any misunderstandings
with your client.

                                                                                                                 Financial planning


Create a detailed assessment of your client’s assets (investable                                              MARK BOKER


and non-investable), liabilities and net worth – a key measure
in tracking financial well-being.
A listing of all incomes and expenses helps determine            Calculate post-secondary education savings needs by
how much more your client can contribute towards their           considering such variables as a child’s current age, expected
financial objectives.                                            numbers of years of post-secondary education, expected
                                                                 costs and the relevant government grants. Use the alternate
                                                                 scenario sliders to immediately assess the impact of changes
                                                                 to the current plan.


Calculate retirement savings needs by considering such variables as investor age, target retirement date, life expectancy,
current and future incomes and expenses and retirement savings. With a clear projection of the investor’s current retirement
plan, use the alternate scenario sliders to immediately assess the impact of changes to the current plan.
                                           MARK BOKER


                                                                                                                                         Insurance


Calculate life insurance needs by considering such              Calculate the amount of income required should a disability
variables as an investor’s current age, expected retirement     prevent your client from working.
age, net income, liabilities and existing insurance coverage.
                                           MARK BOKER


                                                                 Calculate the amount of critical illness insurance your
                                                                 clients may need by considering their current incomes and
                                                                 other expenses they would want to cover by a lump-sum
                                                                 benefit payment.


                                                                 Instantly obtain insurance premium quotes through insurance
                                                                 illustration system integration.


                                                                    USE THIS FORM TO START OR CHANGE YOUR RRSP INVESTMENT INSTRUCTIONS


Using the information collected throughout the various
modules, WealthElements can automatically complete
application, investment instruction and transfer forms.
Reports & Proposals
WealthElements provides you with the tools you need to efficiently generate industry-leading
reports and proposals customized to any client’s particular needs.


                                              ASSETS & LIABILITIES DETAILS                                                                                                                                     YOUR RETIREMENT NEEDS - CURRENT PLAN                                                                                                                                     YOUR EDUCATION NEEDS - CURRENT PLAN

                                              The following values have been provided by you and should reflect your best estimate of your total assets and liabilities.                                                                                                                                                                                                                You have identified the current investments listed below as investments that will be used to fund your child/children's post-
                                                                                                                                                                                                                                                                                                                                                                                        secondary education.
                                                                                                                                                                                                               You are not on target to achieve your goal.
                                                                                                Assets                                             Liabilities
                                                                                   Investable            Non-Investable
                                                                                                                                                                                                               The estimated total value of the selected account(s) will be $1,179,728 at the time of retirement. Based on the
                                                                                   $439,150              $550,000                                                                                              assumptions provided, this will result in a shortfall of $1,993,718 at the end of the projection period.                                                                 Example, Junior
                                                                                                                                                                                                               Based on this scenario, the household will experience a retirement income shortfall when Jill Example
                                                                                                                                                                                                               reaches 70.                                                                                                                                                              Investments
                                                                                                                                                                                                                                                                                                                                                                                        Name                                Type                                 Total                          Expected Return         Owner
                                                                                                                                                                                                               The projection below displays the calculated change in the value of your investments year by year for the
                                                                                                                                                                                                                                                                                                                                                                                        Junior's RESP                       RESP                             $9,756.00                                          5.00%   Example, Jack
                                                                                                                                                                                                               duration of your estimated life expectancy.

                                                                                                                                                                                                                                                                                                                                                                                        You are not on target to achieve your goal.
                                                                                                                                                                                                                                                            $2,000,000
                                                                        Home
                                                                        $550,000
                                                                                                   Jill's TFSA
                                                                                                   $13,750
                                                                                                                    Junior's RESP
                                                                                                                    $9,756
                                                                                                                                                                                                                                                                                                                                                                                        Based on the assumptions provided, Junior Example will require savings of $96,945.11 at the time post-
                                                                                                                                             Home Mortgage
                                                                                                                                             $257,900
                                                                                                                                                                 Personal Line of Credit
                                                                                                                                                                 $54,236
                                                                                                                                                                                                                                                                                                                                                                                        secondary education begins in order to meet education related expenses.
                                                                        Retirement Account
                                                                        $415,644
                                                                                                                                                                                                                                                                                                                                                                                        Based on the current savings strategy, the estimated value of the education savings at the time this child
                                                                                                                                                                                                                                                                      $0                                                                                                                begins post-secondary education will be $12,451.40.


                                                                                                                                                                                                                                                                                                                                                                                                                                                         $100,000
                                              Name                                                      Amount                           Owner                                 Type                                                                       ($2,000,000)
                                                                                                                                                                                                                                                                           50           60             70               80            90
                                              Assets
                                                                                                                                                                                                                                                                                                                                                                                                                                                          $50,000                 $96,945
                                                                                                                                                                                                                                                                   Life expectancy (Jill Example)        Registered Investments
                                              Registered Investments                                                                                                                                                                                               Retirement year (Jill Example)        Non-Registered Investments                                                                                                 Projected Costs
                                              Retirement Account                                                          $415,644.00    Example, Jack                         RRSP/RRIF                                                                           Life expectancy (Jack Example)        Shortfall
                                                                                                                                                                                                                                                                   Retirement year (Jack Example)
                                              Junior's RESP                                                                  $9,756.00   Example, Jack                         RESP                                                                                                                                                                                                                                                 Projected Savings                                               $12,451
                                                                                                                                                                                                                                                                                                                                                                                                                                                               $0
                                              Non-Registered Investments
                                                                                                                                                                                                                                                                                                                                                                                                                                    Shortfall
                                              Jill's TFSA                                                                  $13,750.00    Example, Jill                         TFSA
                                                                                                                                                                                                                                                                                                                                                                                                                                                                                                    ($84,494)
                                              Personal Properties                                                                                                                                              This projection displays your various incomes sources, your retirement income objective and an achievable                                                                                                                                 ($50,000)
                                              Home                                                                        $550,000.00    Example, Jack                         Residence                       goal year by year for the duration of your estimated life expectancy using the assumptions you provided.
                                              Liabilities
                                              Long-Term Liabilities                                                                                                                                                                                                                                                                                                                                                                                     ($100,000)
                                                                                                                                                                                                                                                         $200,000
                                              Home Mortgage                                                               $257,900.00    Example, Jack                         Mortgage
                                              Liabilities
                                              Personal Line of Credit                                                      $54,236.00    Example, Jack                         Line of Credit
                                                                                                                                                                                                                                                         $100,000


                                                                                                                                                                                                                                                                 $0
                                                                                                                                                                                                                                                                                70                     80                    90
                                                                                                                                                                                                                                                                                             Age of Jack Example


                                                                                                                                                                                                                                                            Income Goal         Other Income         Pension Benefits        Sav. Withdrwls
                                                                                                                                                                                                                                                            Shortfall           Earned Income        Gov. Benefits           Loans


                                                                                                                                                                                                               This report is provided for illustration purposes only. The ability to forecast your future financial situation is impacted by a wide variety of factors many of which   This report is provided for illustration purposes only. The ability to forecast your future financial situation is impacted by a wide variety of factors many of which
                                                                                                                                                                                                               can change significantly over time and not all of which can be included in this calculation. You should regularly review your current financial position and             can change significantly over time and not all of which can be included in this calculation. You should regularly review your current financial position and
                                                                                                                                                                                                               future goals to improve the likelihood of achieving success.                                                                                                             future goals to improve the likelihood of achieving success.
                                              REPORT PREPARED FOR MR JACK EXAMPLE AND MRS JILL EXAMPLE ON 05/24/2012                                                                            Page 6 of 32   REPORT PREPARED FOR MR JACK EXAMPLE AND MRS JILL EXAMPLE ON 05/24/2012                                                                            Page 12 of 32          REPORT PREPARED FOR MR JACK EXAMPLE AND MRS JILL EXAMPLE ON 05/24/2012                                                                            Page 20 of 32
                                              SEE DISCLAIMER PAGE.                                                                                                                                             SEE DISCLAIMER PAGE.                                                                                                                                                     SEE DISCLAIMER PAGE.


                                        INVESTMENTS                                                                                                                 FINANCIAL PLANNING                                                                                                                                                 INSURANCE


About EquiSoft
EquiSoft specializes in the design and development of digital business solutions for the financial and insurance industries. To find out more about our products,
custom solutions or our expertise on demand, please visit our website: www.EquiSoft.com

www.wealthelements.com | info@wealthelements.com | 1-866-790-3141

Más contenido relacionado

La actualidad más candente

Sovereignwealthfunds
SovereignwealthfundsSovereignwealthfunds
SovereignwealthfundsU Cantabria
 
Executing value creation plans to maximize returns
Executing value creation plans to maximize returnsExecuting value creation plans to maximize returns
Executing value creation plans to maximize returnsEY
 
Global Insights Feb 2012
Global Insights Feb 2012Global Insights Feb 2012
Global Insights Feb 2012jllkmm
 
Blackrock Global Aloc
Blackrock Global AlocBlackrock Global Aloc
Blackrock Global Alocmwkarstrom
 
Producing and Exploring: October 2012
Producing and Exploring: October 2012Producing and Exploring: October 2012
Producing and Exploring: October 2012Teranga Gold
 
2013.02.06 holden & partners investment presentation
2013.02.06 holden & partners investment presentation2013.02.06 holden & partners investment presentation
2013.02.06 holden & partners investment presentationHolden and Partners
 
Abderdeen International Corporate Presentation
Abderdeen International Corporate PresentationAbderdeen International Corporate Presentation
Abderdeen International Corporate PresentationAberdeen International
 
Designing Government Incentives For Investing Into Inclusive Businesses 3.0
Designing Government Incentives For Investing Into Inclusive Businesses 3.0Designing Government Incentives For Investing Into Inclusive Businesses 3.0
Designing Government Incentives For Investing Into Inclusive Businesses 3.0chris_tozer
 
Aberdeen International Corp Pres July 15
Aberdeen International Corp Pres July 15Aberdeen International Corp Pres July 15
Aberdeen International Corp Pres July 15Aberdeen International
 
Presentation on Private Equity for Women Entreprenuers
Presentation on Private Equity for Women EntreprenuersPresentation on Private Equity for Women Entreprenuers
Presentation on Private Equity for Women EntreprenuersVishwa Trivedi
 
Aberdeen International Corporate Presesentation
Aberdeen International Corporate PresesentationAberdeen International Corporate Presesentation
Aberdeen International Corporate PresesentationAberdeen International
 
Wealth Accumulation Model
Wealth Accumulation ModelWealth Accumulation Model
Wealth Accumulation ModelNicole Lee
 
Aberdeen International Corporate Presesentation
Aberdeen International Corporate PresesentationAberdeen International Corporate Presesentation
Aberdeen International Corporate PresesentationAberdeen International
 
Drexel private equity guest lecture 10 20-2015
Drexel private equity guest lecture 10 20-2015Drexel private equity guest lecture 10 20-2015
Drexel private equity guest lecture 10 20-2015Justin Shuman
 
Asset Mgmt Private Equity & Hedge Funds
Asset Mgmt Private Equity & Hedge Funds Asset Mgmt Private Equity & Hedge Funds
Asset Mgmt Private Equity & Hedge Funds Floyd Saunders
 
Fund Formation Introduction
Fund Formation IntroductionFund Formation Introduction
Fund Formation IntroductionCraig Lilly
 
Aberdeen International Corporate Presesentation
Aberdeen International Corporate PresesentationAberdeen International Corporate Presesentation
Aberdeen International Corporate PresesentationAberdeen International
 
Aberdeen International Corporate Presentation
Aberdeen International Corporate PresentationAberdeen International Corporate Presentation
Aberdeen International Corporate PresentationAberdeen International
 
ACG European Capital Tour Pamela Hendrickson and Dominique Gaillard
ACG European Capital Tour Pamela Hendrickson and Dominique GaillardACG European Capital Tour Pamela Hendrickson and Dominique Gaillard
ACG European Capital Tour Pamela Hendrickson and Dominique GaillardACGEU
 

La actualidad más candente (20)

Sovereignwealthfunds
SovereignwealthfundsSovereignwealthfunds
Sovereignwealthfunds
 
Executing value creation plans to maximize returns
Executing value creation plans to maximize returnsExecuting value creation plans to maximize returns
Executing value creation plans to maximize returns
 
Global Insights Feb 2012
Global Insights Feb 2012Global Insights Feb 2012
Global Insights Feb 2012
 
Blackrock Global Aloc
Blackrock Global AlocBlackrock Global Aloc
Blackrock Global Aloc
 
Producing and Exploring: October 2012
Producing and Exploring: October 2012Producing and Exploring: October 2012
Producing and Exploring: October 2012
 
2013.02.06 holden & partners investment presentation
2013.02.06 holden & partners investment presentation2013.02.06 holden & partners investment presentation
2013.02.06 holden & partners investment presentation
 
Aberdeen Corporate Presesentation
Aberdeen Corporate PresesentationAberdeen Corporate Presesentation
Aberdeen Corporate Presesentation
 
Abderdeen International Corporate Presentation
Abderdeen International Corporate PresentationAbderdeen International Corporate Presentation
Abderdeen International Corporate Presentation
 
Designing Government Incentives For Investing Into Inclusive Businesses 3.0
Designing Government Incentives For Investing Into Inclusive Businesses 3.0Designing Government Incentives For Investing Into Inclusive Businesses 3.0
Designing Government Incentives For Investing Into Inclusive Businesses 3.0
 
Aberdeen International Corp Pres July 15
Aberdeen International Corp Pres July 15Aberdeen International Corp Pres July 15
Aberdeen International Corp Pres July 15
 
Presentation on Private Equity for Women Entreprenuers
Presentation on Private Equity for Women EntreprenuersPresentation on Private Equity for Women Entreprenuers
Presentation on Private Equity for Women Entreprenuers
 
Aberdeen International Corporate Presesentation
Aberdeen International Corporate PresesentationAberdeen International Corporate Presesentation
Aberdeen International Corporate Presesentation
 
Wealth Accumulation Model
Wealth Accumulation ModelWealth Accumulation Model
Wealth Accumulation Model
 
Aberdeen International Corporate Presesentation
Aberdeen International Corporate PresesentationAberdeen International Corporate Presesentation
Aberdeen International Corporate Presesentation
 
Drexel private equity guest lecture 10 20-2015
Drexel private equity guest lecture 10 20-2015Drexel private equity guest lecture 10 20-2015
Drexel private equity guest lecture 10 20-2015
 
Asset Mgmt Private Equity & Hedge Funds
Asset Mgmt Private Equity & Hedge Funds Asset Mgmt Private Equity & Hedge Funds
Asset Mgmt Private Equity & Hedge Funds
 
Fund Formation Introduction
Fund Formation IntroductionFund Formation Introduction
Fund Formation Introduction
 
Aberdeen International Corporate Presesentation
Aberdeen International Corporate PresesentationAberdeen International Corporate Presesentation
Aberdeen International Corporate Presesentation
 
Aberdeen International Corporate Presentation
Aberdeen International Corporate PresentationAberdeen International Corporate Presentation
Aberdeen International Corporate Presentation
 
ACG European Capital Tour Pamela Hendrickson and Dominique Gaillard
ACG European Capital Tour Pamela Hendrickson and Dominique GaillardACG European Capital Tour Pamela Hendrickson and Dominique Gaillard
ACG European Capital Tour Pamela Hendrickson and Dominique Gaillard
 

Destacado (20)

Intel youth-enterprise-Broadband America Ideation Camp
Intel youth-enterprise-Broadband America Ideation CampIntel youth-enterprise-Broadband America Ideation Camp
Intel youth-enterprise-Broadband America Ideation Camp
 
Introducing presente3 d_converted
Introducing presente3 d_convertedIntroducing presente3 d_converted
Introducing presente3 d_converted
 
D.doeh
D.doehD.doeh
D.doeh
 
We draw together
We draw togetherWe draw together
We draw together
 
SÍNDROME NEFROTICO
SÍNDROME NEFROTICOSÍNDROME NEFROTICO
SÍNDROME NEFROTICO
 
Uk accessibility tourism
Uk accessibility tourism Uk accessibility tourism
Uk accessibility tourism
 
Ratoncito Perez
Ratoncito PerezRatoncito Perez
Ratoncito Perez
 
Bab i pendahuluan
Bab i pendahuluanBab i pendahuluan
Bab i pendahuluan
 
Mandalas 3
Mandalas 3Mandalas 3
Mandalas 3
 
Mandalas 2
Mandalas 2Mandalas 2
Mandalas 2
 
Letra b
Letra bLetra b
Letra b
 
Cuento: Santiago el mago
Cuento: Santiago el magoCuento: Santiago el mago
Cuento: Santiago el mago
 
Mandalas
MandalasMandalas
Mandalas
 
Foxdevs
FoxdevsFoxdevs
Foxdevs
 
Wealth Elements Brochure
Wealth Elements BrochureWealth Elements Brochure
Wealth Elements Brochure
 
Logica matemática
Logica matemáticaLogica matemática
Logica matemática
 
Diagnostico laboratorial de liquido amniotico
Diagnostico laboratorial de liquido amnioticoDiagnostico laboratorial de liquido amniotico
Diagnostico laboratorial de liquido amniotico
 
El rato y el gato .enciclop.4to.bc15
El rato y el gato .enciclop.4to.bc15El rato y el gato .enciclop.4to.bc15
El rato y el gato .enciclop.4to.bc15
 
Avance de trabajo planificacion financiera mejorar rentabilidad
Avance de trabajo planificacion financiera mejorar rentabilidadAvance de trabajo planificacion financiera mejorar rentabilidad
Avance de trabajo planificacion financiera mejorar rentabilidad
 
Lizeth&aaron
Lizeth&aaronLizeth&aaron
Lizeth&aaron
 

Similar a Mutual fund monthly review 11 2012

Mutual Fund Monthly Review 09 2012
Mutual Fund Monthly Review 09 2012Mutual Fund Monthly Review 09 2012
Mutual Fund Monthly Review 09 2012jonathangeorges
 
Mutual fund monthly review 02 2013
Mutual fund monthly review 02 2013Mutual fund monthly review 02 2013
Mutual fund monthly review 02 2013jonathangeorges
 
AEED45CE-26BE-403D-9B1D-2B0CB1B4E184_2008_AR
AEED45CE-26BE-403D-9B1D-2B0CB1B4E184_2008_ARAEED45CE-26BE-403D-9B1D-2B0CB1B4E184_2008_AR
AEED45CE-26BE-403D-9B1D-2B0CB1B4E184_2008_ARfinance43
 
ameriprise AEED45CE-26BE-403D-9B1D-2B0CB1B4E184_2008_AR
ameriprise  AEED45CE-26BE-403D-9B1D-2B0CB1B4E184_2008_ARameriprise  AEED45CE-26BE-403D-9B1D-2B0CB1B4E184_2008_AR
ameriprise AEED45CE-26BE-403D-9B1D-2B0CB1B4E184_2008_ARfinance43
 
AEED45CE-26BE-403D-9B1D-2B0CB1B4E184_2008_AR
AEED45CE-26BE-403D-9B1D-2B0CB1B4E184_2008_ARAEED45CE-26BE-403D-9B1D-2B0CB1B4E184_2008_AR
AEED45CE-26BE-403D-9B1D-2B0CB1B4E184_2008_ARfinance43
 
ameriprise AEED45CE-26BE-403D-9B1D-2B0CB1B4E184_2008_AR
ameriprise   AEED45CE-26BE-403D-9B1D-2B0CB1B4E184_2008_ARameriprise   AEED45CE-26BE-403D-9B1D-2B0CB1B4E184_2008_AR
ameriprise AEED45CE-26BE-403D-9B1D-2B0CB1B4E184_2008_ARfinance43
 
Investment memorandum narrated
Investment memorandum narratedInvestment memorandum narrated
Investment memorandum narratedmpanciro
 
Rob Antulov CFO Network presentation
Rob Antulov CFO Network presentationRob Antulov CFO Network presentation
Rob Antulov CFO Network presentationAzure Group
 
Bank of America Corporation acquires Merrill Lynch & Co., Inc. Presentation
Bank of America Corporation acquires Merrill Lynch & Co., Inc. PresentationBank of America Corporation acquires Merrill Lynch & Co., Inc. Presentation
Bank of America Corporation acquires Merrill Lynch & Co., Inc. PresentationQuarterlyEarningsReports3
 
Company overview, BT Global Growth Fund February 2016
Company overview, BT Global Growth Fund February 2016Company overview, BT Global Growth Fund February 2016
Company overview, BT Global Growth Fund February 2016BT Global
 
Mutual fund monthly review 06 2013
Mutual fund monthly review 06 2013Mutual fund monthly review 06 2013
Mutual fund monthly review 06 2013jonathangeorges
 
10 key trends changing investment management
10 key trends changing investment management10 key trends changing investment management
10 key trends changing investment managementtessat97
 
Mkm Presentation October 2011
Mkm Presentation October 2011Mkm Presentation October 2011
Mkm Presentation October 2011Mkmcapital
 
May 2015 real estate securities funds monitor
May  2015  real estate securities funds monitorMay  2015  real estate securities funds monitor
May 2015 real estate securities funds monitorConsiliacapital
 
Newmarket Gold Inc - Corporate Presentation
Newmarket Gold Inc - Corporate PresentationNewmarket Gold Inc - Corporate Presentation
Newmarket Gold Inc - Corporate PresentationAdnet Communications
 
Financing the Microfinanciers, How MFIs are sourcing capital -- joint BlueOrc...
Financing the Microfinanciers, How MFIs are sourcing capital -- joint BlueOrc...Financing the Microfinanciers, How MFIs are sourcing capital -- joint BlueOrc...
Financing the Microfinanciers, How MFIs are sourcing capital -- joint BlueOrc...svmn
 
Overview ecef presentation june 20 2012
Overview ecef presentation   june 20 2012Overview ecef presentation   june 20 2012
Overview ecef presentation june 20 2012ecefltd
 
Jason Cachia CFO Network presentation March 2012
Jason Cachia CFO Network presentation March 2012Jason Cachia CFO Network presentation March 2012
Jason Cachia CFO Network presentation March 2012Azure Group
 
Ian R. Stuart - Career History, Accomplishments, Leadership
Ian R. Stuart - Career History, Accomplishments, LeadershipIan R. Stuart - Career History, Accomplishments, Leadership
Ian R. Stuart - Career History, Accomplishments, LeadershipIanRStuart
 

Similar a Mutual fund monthly review 11 2012 (20)

Mutual Fund Monthly Review 09 2012
Mutual Fund Monthly Review 09 2012Mutual Fund Monthly Review 09 2012
Mutual Fund Monthly Review 09 2012
 
Mutual fund monthly review 02 2013
Mutual fund monthly review 02 2013Mutual fund monthly review 02 2013
Mutual fund monthly review 02 2013
 
AEED45CE-26BE-403D-9B1D-2B0CB1B4E184_2008_AR
AEED45CE-26BE-403D-9B1D-2B0CB1B4E184_2008_ARAEED45CE-26BE-403D-9B1D-2B0CB1B4E184_2008_AR
AEED45CE-26BE-403D-9B1D-2B0CB1B4E184_2008_AR
 
ameriprise AEED45CE-26BE-403D-9B1D-2B0CB1B4E184_2008_AR
ameriprise  AEED45CE-26BE-403D-9B1D-2B0CB1B4E184_2008_ARameriprise  AEED45CE-26BE-403D-9B1D-2B0CB1B4E184_2008_AR
ameriprise AEED45CE-26BE-403D-9B1D-2B0CB1B4E184_2008_AR
 
AEED45CE-26BE-403D-9B1D-2B0CB1B4E184_2008_AR
AEED45CE-26BE-403D-9B1D-2B0CB1B4E184_2008_ARAEED45CE-26BE-403D-9B1D-2B0CB1B4E184_2008_AR
AEED45CE-26BE-403D-9B1D-2B0CB1B4E184_2008_AR
 
ameriprise AEED45CE-26BE-403D-9B1D-2B0CB1B4E184_2008_AR
ameriprise   AEED45CE-26BE-403D-9B1D-2B0CB1B4E184_2008_ARameriprise   AEED45CE-26BE-403D-9B1D-2B0CB1B4E184_2008_AR
ameriprise AEED45CE-26BE-403D-9B1D-2B0CB1B4E184_2008_AR
 
Investment memorandum narrated
Investment memorandum narratedInvestment memorandum narrated
Investment memorandum narrated
 
Choosing investments for 401 k power point
Choosing investments for 401 k  power pointChoosing investments for 401 k  power point
Choosing investments for 401 k power point
 
Rob Antulov CFO Network presentation
Rob Antulov CFO Network presentationRob Antulov CFO Network presentation
Rob Antulov CFO Network presentation
 
Bank of America Corporation acquires Merrill Lynch & Co., Inc. Presentation
Bank of America Corporation acquires Merrill Lynch & Co., Inc. PresentationBank of America Corporation acquires Merrill Lynch & Co., Inc. Presentation
Bank of America Corporation acquires Merrill Lynch & Co., Inc. Presentation
 
Company overview, BT Global Growth Fund February 2016
Company overview, BT Global Growth Fund February 2016Company overview, BT Global Growth Fund February 2016
Company overview, BT Global Growth Fund February 2016
 
Mutual fund monthly review 06 2013
Mutual fund monthly review 06 2013Mutual fund monthly review 06 2013
Mutual fund monthly review 06 2013
 
10 key trends changing investment management
10 key trends changing investment management10 key trends changing investment management
10 key trends changing investment management
 
Mkm Presentation October 2011
Mkm Presentation October 2011Mkm Presentation October 2011
Mkm Presentation October 2011
 
May 2015 real estate securities funds monitor
May  2015  real estate securities funds monitorMay  2015  real estate securities funds monitor
May 2015 real estate securities funds monitor
 
Newmarket Gold Inc - Corporate Presentation
Newmarket Gold Inc - Corporate PresentationNewmarket Gold Inc - Corporate Presentation
Newmarket Gold Inc - Corporate Presentation
 
Financing the Microfinanciers, How MFIs are sourcing capital -- joint BlueOrc...
Financing the Microfinanciers, How MFIs are sourcing capital -- joint BlueOrc...Financing the Microfinanciers, How MFIs are sourcing capital -- joint BlueOrc...
Financing the Microfinanciers, How MFIs are sourcing capital -- joint BlueOrc...
 
Overview ecef presentation june 20 2012
Overview ecef presentation   june 20 2012Overview ecef presentation   june 20 2012
Overview ecef presentation june 20 2012
 
Jason Cachia CFO Network presentation March 2012
Jason Cachia CFO Network presentation March 2012Jason Cachia CFO Network presentation March 2012
Jason Cachia CFO Network presentation March 2012
 
Ian R. Stuart - Career History, Accomplishments, Leadership
Ian R. Stuart - Career History, Accomplishments, LeadershipIan R. Stuart - Career History, Accomplishments, Leadership
Ian R. Stuart - Career History, Accomplishments, Leadership
 

Mutual fund monthly review 11 2012

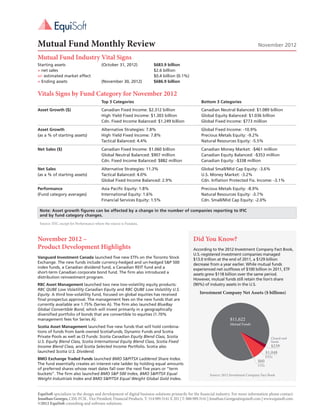
  • 1. Mutual Fund Monthly Review November 2012 Mutual Fund Industry Vital Signs Starting assets (October 31, 2012) $683.9 billion + net sales $2.6 billion +/- estimated market effect $0.4 billion (0.1%) = Ending assets (November 30, 2012) $686.9 billion Vitals Signs by Fund Category for November 2012 Top 3 Categories Bottom 3 Categories Asset Growth ($) Canadian Fixed Income: $2.312 billion Canadian Neutral Balanced: $1.089 billion High Yield Fixed Income: $1.303 billion Global Equity Balanced: $1.036 billion Cdn. Fixed Income Balanced: $1.249 billion Global Fixed Income: $773 million Asset Growth Alternative Strategies: 7.8% Global Fixed Income: -10.9% (as a % of starting assets) High Yield Fixed Income: 7.8% Precious Metals Equity: -9.2% Tactical Balanced: 4.4% Natural Resources Equity: -5.5% Net Sales ($) Canadian Fixed Income: $1.060 billion Canadian Money Market: -$461 million Global Neutral Balanced: $907 million Canadian Equity Balanced: -$353 million Cdn. Fixed Income Balanced: $882 million Canadian Equity: -$338 million Net Sales Alternative Strategies: 11.3% Global Small/Mid Cap Equity: -3.6% (as a % of starting assets) Tactical Balanced: 4.0% U.S. Money Market: -3.2% Global Fixed Income Balanced: 2.9% Cdn. Inflation Protected Fix. Income: -3.1% Performance Asia Pacific Equity: 1.8% Precious Metals Equity: -8.9% (Fund category averages) International Equity: 1.6% Natural Resources Equity: -3.7% Financial Services Equity: 1.5% Cdn. Small/Mid Cap Equity: -2.0% Note: Asset growth figures can be affected by a change in the number of companies reporting to IFIC and by fund category changes. Source: IFIC except for Performance where the source is Fundata. November 2012 – Did You Know? Product Development Highlights According to the 2012 Investment Company Fact Book, U.S.-registered investment companies managed Vanguard Investment Canada launched five new ETFs on the Toronto Stock $13.0 trillion at the end of 2011, a $129 billion Exchange. The new funds include currency-hedged and un-hedged S&P 500 decrease from a year earlier. While mutual funds index funds, a Canadian dividend fund, a Canadian REIT fund and a experienced net outflows of $100 billion in 2011, ETF short-term Canadian corporate bond fund. The firm also introduced a assets grew $118 billion over the same period. distribution reinvestment program. However, mutual funds still retain the lion’s share RBC Asset Management launched two new low-volatility equity products: (90%) of industry assets in the U.S. RBC QUBE Low Volatility Canadian Equity and RBC QUBE Low Volatility U.S. Equity. A third low-volatility fund, focused on global equities has received Investment Company Net Assets ($ billions) final prospectus approval. The management fees on the new funds that are currently available are 1.75% (Series A). The firm also launched BlueBay Global Convertible Bond, which will invest primarily in a geographically diversified portfolio of bonds that are convertible to equities (1.70% management fees for Series A). $11,622 Mutual Funds Scotia Asset Management launched five new funds that will hold combina- tions of funds from bank-owned ScotiaFunds, Dynamic Funds and Scotia Private Pools as well as CI Funds: Scotia Canadian Equity Blend Class, Scotia Closed-end U.S. Equity Blend Class, Scotia International Equity Blend Class, Scotia Fixed funds Income Blend Class, and Scotia Selected Income Portfolio. Scotia also $239 launched Scotia U.S. Dividend. $1,048 ETFs BMO Exchange Traded Funds launched BMO S&P/TSX Laddered Share Index. $60 The fund essentially creates an interest-rate ladder by holding equal amounts UITs of preferred shares whose reset dates fall over the next five years or “term buckets”. The firm also launched BMO S&P 500 Index, BMO S&P/TSX Equal Source: 2012 Investment Company Fact Book Weight Industrials Index and BMO S&P/TSX Equal Weight Global Gold Index. EquiSoft specializes in the design and development of digital business solutions primarily for the financial industry. For more information please contact: Jonathan Georges, CIM, FCSI , Vice President, Financial Products. T: 514.989.3141 X 201 | T: 888.989.3141 | Jonathan.Georges@equisoft.com | www.equisoft.com. ©2012 EquiSoft consulting and software solutions.
  • 2. A sales-oriented web suite designed to help advisors grow their business INVESTMENTS FINANCIAL PLANNING INSURANCE WealthElements is a comprehensive, customizable and fully integrated suite of tools designed to help financial advisors manage every element of their clients’ wealth. ■■ Ideal for use with existing ■■ Client data import through clients or as part of a client back-office integration. acquisition strategy. ■■ Connectivity to insurance ■■ Streamlined process that illustration systems. couples comprehensive analysis ■■ Aggregation of a broad range with speed and efficiency. of investment product data including mutual funds, ETFs, stocks, bonds and SMAs. ■■ Configurable at the corporate and individual level. Asset ■■ Supports multiple currencies. Allocation Analyst Electronic Investment ■■ Simple, multi-lingual interface. Application IGATION Policy Statement D NAV ■■ Customizable, client-friendly TE reports and proposals. A GR DA Insurance Net Worth TA S INTE Illustrations HARING INT Critical Illness Cash Flow Insurance Needs EG RA TE D R E P O RT I N G Disability Retirement Needs Insurance Needs Life Education Needs Insurance Needs
  • 3. Each of the WealthElements modules can be used on its own or in conjunction with any number of integrated modules to create a customized proposal that is right for your client. Investments A simple 4-step portfolio construction and analytics process that helps build a compelling case for your investment recommendations.The Asset Allocation Analyst module’s comprehensive list of analytics range from a simple investment growth chart to Alpha, Sortino and Monte Carlo metrics, allowing you to create a proposal that is as simple or complex as required. MARK BOKER MARK BOKER 1 2 MARK BOKER MARK BOKER ABC111 Fund 1 3 4 ABC222 Fund 2 ABC333 Fund 3 ABC444 Fund 4 ABC111 Fund 1 ABC222 Fund 2 ABC333 Fund 3 ABC444 Fund 4 ABC555 Fund 5 Create an Investment Policy Statement (IPS) outlining general portfolio objectives and strategies as agreed to with your client. This important document helps set appropriate portfolio expectations and reduces the likelihood of any misunderstandings with your client. Financial planning Create a detailed assessment of your client’s assets (investable MARK BOKER and non-investable), liabilities and net worth – a key measure in tracking financial well-being.
  • 4. A listing of all incomes and expenses helps determine Calculate post-secondary education savings needs by how much more your client can contribute towards their considering such variables as a child’s current age, expected financial objectives. numbers of years of post-secondary education, expected costs and the relevant government grants. Use the alternate scenario sliders to immediately assess the impact of changes to the current plan. Calculate retirement savings needs by considering such variables as investor age, target retirement date, life expectancy, current and future incomes and expenses and retirement savings. With a clear projection of the investor’s current retirement plan, use the alternate scenario sliders to immediately assess the impact of changes to the current plan. MARK BOKER Insurance Calculate life insurance needs by considering such Calculate the amount of income required should a disability variables as an investor’s current age, expected retirement prevent your client from working. age, net income, liabilities and existing insurance coverage. MARK BOKER Calculate the amount of critical illness insurance your clients may need by considering their current incomes and other expenses they would want to cover by a lump-sum benefit payment. Instantly obtain insurance premium quotes through insurance illustration system integration. USE THIS FORM TO START OR CHANGE YOUR RRSP INVESTMENT INSTRUCTIONS Using the information collected throughout the various modules, WealthElements can automatically complete application, investment instruction and transfer forms.
  • 5. Reports & Proposals WealthElements provides you with the tools you need to efficiently generate industry-leading reports and proposals customized to any client’s particular needs. ASSETS & LIABILITIES DETAILS YOUR RETIREMENT NEEDS - CURRENT PLAN YOUR EDUCATION NEEDS - CURRENT PLAN The following values have been provided by you and should reflect your best estimate of your total assets and liabilities. You have identified the current investments listed below as investments that will be used to fund your child/children's post- secondary education. You are not on target to achieve your goal. Assets Liabilities Investable Non-Investable The estimated total value of the selected account(s) will be $1,179,728 at the time of retirement. Based on the $439,150 $550,000 assumptions provided, this will result in a shortfall of $1,993,718 at the end of the projection period. Example, Junior Based on this scenario, the household will experience a retirement income shortfall when Jill Example reaches 70. Investments Name Type Total Expected Return Owner The projection below displays the calculated change in the value of your investments year by year for the Junior's RESP RESP $9,756.00 5.00% Example, Jack duration of your estimated life expectancy. You are not on target to achieve your goal. $2,000,000 Home $550,000 Jill's TFSA $13,750 Junior's RESP $9,756 Based on the assumptions provided, Junior Example will require savings of $96,945.11 at the time post- Home Mortgage $257,900 Personal Line of Credit $54,236 secondary education begins in order to meet education related expenses. Retirement Account $415,644 Based on the current savings strategy, the estimated value of the education savings at the time this child $0 begins post-secondary education will be $12,451.40. $100,000 Name Amount Owner Type ($2,000,000) 50 60 70 80 90 Assets $50,000 $96,945 Life expectancy (Jill Example) Registered Investments Registered Investments Retirement year (Jill Example) Non-Registered Investments Projected Costs Retirement Account $415,644.00 Example, Jack RRSP/RRIF Life expectancy (Jack Example) Shortfall Retirement year (Jack Example) Junior's RESP $9,756.00 Example, Jack RESP Projected Savings $12,451 $0 Non-Registered Investments Shortfall Jill's TFSA $13,750.00 Example, Jill TFSA ($84,494) Personal Properties This projection displays your various incomes sources, your retirement income objective and an achievable ($50,000) Home $550,000.00 Example, Jack Residence goal year by year for the duration of your estimated life expectancy using the assumptions you provided. Liabilities Long-Term Liabilities ($100,000) $200,000 Home Mortgage $257,900.00 Example, Jack Mortgage Liabilities Personal Line of Credit $54,236.00 Example, Jack Line of Credit $100,000 $0 70 80 90 Age of Jack Example Income Goal Other Income Pension Benefits Sav. Withdrwls Shortfall Earned Income Gov. Benefits Loans This report is provided for illustration purposes only. The ability to forecast your future financial situation is impacted by a wide variety of factors many of which This report is provided for illustration purposes only. The ability to forecast your future financial situation is impacted by a wide variety of factors many of which can change significantly over time and not all of which can be included in this calculation. You should regularly review your current financial position and can change significantly over time and not all of which can be included in this calculation. You should regularly review your current financial position and future goals to improve the likelihood of achieving success. future goals to improve the likelihood of achieving success. REPORT PREPARED FOR MR JACK EXAMPLE AND MRS JILL EXAMPLE ON 05/24/2012 Page 6 of 32 REPORT PREPARED FOR MR JACK EXAMPLE AND MRS JILL EXAMPLE ON 05/24/2012 Page 12 of 32 REPORT PREPARED FOR MR JACK EXAMPLE AND MRS JILL EXAMPLE ON 05/24/2012 Page 20 of 32 SEE DISCLAIMER PAGE. SEE DISCLAIMER PAGE. SEE DISCLAIMER PAGE. INVESTMENTS FINANCIAL PLANNING INSURANCE About EquiSoft EquiSoft specializes in the design and development of digital business solutions for the financial and insurance industries. To find out more about our products, custom solutions or our expertise on demand, please visit our website: www.EquiSoft.com www.wealthelements.com | info@wealthelements.com | 1-866-790-3141