Using Demographic Data to Forecast Contraceptive Implant Demand Underestimates True Needs

This poster was presented by Laila Akhlaghi at the International Conference on Family Planning (ICFP) in Kigali, Rwanda in November 2018. The Family Planning 2020 (FP2020) Initiative was launched in 2012 to address high unmet need for contraception, especially in low and middle income countries. Increasing access to long acting hormonal contraceptives (LARCs), and specifically hormonal contraceptive implants is an important strategy for achieving increases in modern contraceptive prevalence rates (mCPR). Increasing access to contraceptive implants and ensuring demand is being met begins with accurate forecasting. This step precedes the process of supply planning, procurement, and distribution of these goods to service delivery points (SDPs) that make them available as a choice for women. Several methods can be used in forecasting demand for contraceptives. How closely does contraceptive implant demand estimated from survey and demographics data align with actual data on insertions collected from service delivery points through eLMIS, LMIS, or DHIS II data? The findings indicate that demographic estimates underestimate actual consumption for long-term methods. This has implications for the use of survey and demographic data (including CYPs), for forecasting demand for contraceptive implants. The results also emphasize the importance of establishing and strengthening eLMIS systems that collect supply chain data and the use of this data for operational and management decisions to improve performance. Understanding true demand at the last mile of the supply chain, is an essential data element for managing supply chains. Without this information, supply chain managers have limited ability to increase performance and efficiency of their systems.
Recomendados

Recomendados
Más contenido relacionado
La actualidad más candente
La actualidad más candente (19)
Similar a Using Demographic Data to Forecast Contraceptive Implant Demand Underestimates True Needs
Similar a Using Demographic Data to Forecast Contraceptive Implant Demand Underestimates True Needs (20)
Más de JSI
Más de JSI (20)
Último
Último (20)
Using Demographic Data to Forecast Contraceptive Implant Demand Underestimates True Needs
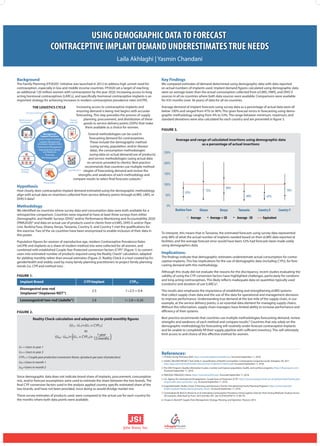
- 1. USING DEMOGRAPHIC DATATO FORECAST CONTRACEPTIVE IMPLANT DEMAND UNDERESTIMATESTRUE NEEDS USING DEMOGRAPHIC DATATO FORECAST CONTRACEPTIVE IMPLANT DEMAND UNDERESTIMATESTRUE NEEDS Laila Akhlaghi | Yasmin Chandani Background The Family Planning (FP2020)1 Initiative was launched in 2012 to address high unmet need for contraception, especially in low and middle income countries. FP2020 set a target of reaching an additional 120 million women with contraception by the year 2020. Increasing access to long acting hormonal contraceptives (LARCs), and specifically hormonal contraceptive implants is an important strategy for achieving increases in modern contraceptive prevalence rates (mCPR). Increasing access to contraceptive implants and ensuring demand is being met begins with accurate forecasting. This step precedes the process of supply planning, procurement, and distribution of these goods to service delivery points (SDPs) that make them available as a choice for women. Several methodologies can be used in forecasting demand for contraceptives. These include the demographic method (using survey, population, and/or disease data), the consumption methodologies (using data on actual demand/use of products) and service methodologies (using actual data on services provided to clients). Best practice recommends that countries use multiple method- ologies of forecasting demand and review the strengths and weakness of each methodology and compare results to select final forecasts outputs.2 Hypothesis How closely does contraceptive implant demand estimated using the demographic methodology align with actual data on insertions collected from service delivery points through eLMIS, LMIS, or DHIS II data? Methodology We identified six countries where survey data and consumption data were both available for a retrospective comparison. Countries were required to have at least three surveys from either Demographic and Health Surveys (DHS)3 and/or Performance Monitoring and Accountability 2020 (PMA2020)4 and data on actual use of products used in clients from e/LMIS, DHIS II, and/or Pipe- Line. Burkina Faso, Ghana, Kenya, Tanzania, Country X, and Country Y met the qualifications for this exercise. Two of the six countries have been anonymized to enable inclusion of their data in this poster. Population figures for women of reproductive age, modern Contraceptive Prevalence Rates (mCPR) and implants as a share of modern method mix were collected for all women, and combined with established Couple Year Protected conversion factors (CYP)5 (Figure 1) to convert users into estimated number of products required using the Reality Check6 calculation, adapted for yielding monthly rather than annual estimates (Figure 2). Reality Check is a tool created by En- genderHealth and widely used by many family planning practitioners to project family planning trends (i.e. CPR and method mix) . Key Findings We compared estimates of demand determined using demographic data with data reported on actual numbers of implants used. Implant demand figures calculated using demographic data were on average lower than the actual consumption collected from e/LMIS, HMIS, and DHIS II sources in all six countries where both data sources were available. Comparisons were available for 435 months (over 36 years) of data for all six countries. Average demand of implant forecasts using survey data as a percentage of actual data were all below 100% and ranged from 47% to 96%; This gives forecast errors in forecasting using demo- graphic methodology ranging from 4% to 53%. The range between minimum, maximum, and standard deviations were also calculated for each country and are presented in figure 3. To interpret, this means that in Tanzania, the estimated forecasts using survey data represented only 48% of what the actual number of implants needed based on their eLMIS data reported at facilities; and the average forecast error would have been 52% had forecasts been made solely using demographics data. Implications: The findings indicate that demographic estimates underestimate actual consumption for contra- ceptive implants. This has implications for the use of demographic data (including CYPs), for fore- casting demand with this methodology. Although this study did not evaluate the reasons for the discrepancy, recent studies evaluating the validity of using the CYP conversion factors have highlighted challenges, particularly for condoms and long acting contraceptives. This likely reflects inadequate data on quantities typically used (condoms) and duration of use (LARCs)7 . The results also emphasize the importance of establishing and strengthening eLMIS systems that collect supply chain data and the use of this data for operational and management decisions to improve performance. Understanding true demand at the last mile of the supply chain, in our example, at the service delivery points, is an essential data element for managing supply chains. Without this information, supply chain managers have limited ability to increase performance and efficiency of their systems. Best practice recommends that countries use multiple methodologies forecasting demand, review strengths and weakness of each method and compare results.8 Countries that rely solely on the demographic methodology for forecasting will routinely under-forecast contraceptive implants and be unable to completely fill their supply pipeline with sufficient inventory. This will ultimately limit access to and choice of this effective method for women. References: 1. FP2020. Family Planning 2020. http://www.familyplanning2020.org/. Accessed September 11, 2018. 2. USAID | DELIVER PROJECT Task Order 4. Quantification of Health Commodities: Contraceptive Companion Guide. Arlington, VA; 2011. http://apps.who.int/medicinedocs/documents/s21863en/s21863en.pdf. Accessed September 11, 2018. 3. The DHS Program: Quality information to plan, monitor and improve population, health, and nutrition programs. https://dhsprogram.com/. Accessed September 11, 2018. 4. PMA2020. PMA2020 | Home. https://www.pma2020.org/. Accessed September 11, 2018. 5. U.S. Agency for International Development. Couple Years of Protection (CYP). https://www.usaid.gov/what-we-do/global-health/family-plan- ning/couple-years-protection-cyp. Accessed September 11, 2018. 6. EngenderHealth. Reality Check: A Planning and Advocacy Tool for Strengthening Family Planning Programs. https://www.engender- health.org/pubs/family-planning/reality-check/. Accessed September 11, 2018. 7. Cunningham M, Bock A, Brown N, et al. Estimating Contraceptive Prevalence Using Logistics Data for Short-Acting Methods: Analysis Across 30 Countries. Glob Heal Sci Pract. 2015;3(3):462-481. doi:10.9745/GHSP-D-15-00116. 8. Chopra S, Meindl P. Supply Chain Management: Strategy, Planning, and Operation. Pearson; 2013. Implant Brand CYP/implant CYPCF Etonogestrel one-rod (Implanon®/Implanon NXT®) 2.5 1÷2.5 = 0.4 Levonogestrel two-rod (Jadelle®) 3.8 1÷3.8 = 0.26 FIGURE 1. FIGURE 2. FIGURE 3. (UY2 - UY1)+(UY1 × CYPCF) to (UM2 - UM1)+ (UY1 × CYPCF)× UY1 = Users in year 1 UY2 = Users in year 2 CYPCF = Couple year protection conversion factor, (products per year of protection) UM1=Users in month 1 UM2=Users in month 2 1 year 12 months( ) Since demographic data does not indicate brand share of implants, procurement, consumption mix, and/or forecast assumptions were used to estimate the share between the two brands. The final CYP conversion factors used in the analysis applied country specific estimated share of the two brands, and have not been provided, since doing so would divulge market mix. These survey estimates of products used, were compared to the actual use for each country for the months where both data points were available. Serving Customers Inventory Strategy Quantification Warehousing & Distribution Procurement THE LOGISTICS CYCLE Product Selection Management Support Functions System Design & Strategy Logistics Management Information Systems (LMIS) Performance Management Organizational Capacity and Workforce Financing Risk Management Average and range of calculated insertions using demographic data as a percentage of actual insertions Reality Check calculation and adaptation to yield monthly figures 150% 100% 250% 65% 75% 96% 48% 47% 76% 200% 50% 0% Burkina Faso Ghana Kenya Tanzania Country X Country Y Average Average + SD Average - SD Equivalent