
Recomendados
Más contenido relacionado
Similar a Fy20 q4 consolidated_financial_statements
Similar a Fy20 q4 consolidated_financial_statements (20)
Más de los_pinos
Más de los_pinos (9)
Último
Último (20)
Fy20 q4 consolidated_financial_statements
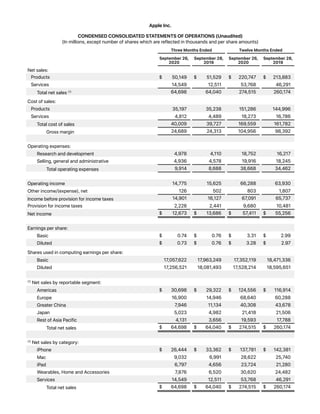
- 1. Apple Inc. CONDENSED CONSOLIDATED STATEMENTS OF OPERATIONS (Unaudited) (In millions, except number of shares which are reflected in thousands and per share amounts) Three Months Ended Twelve Months Ended September 26, 2020 September 28, 2019 September 26, 2020 September 28, 2019 Net sales: Products $ 50,149 $ 51,529 $ 220,747 $ 213,883 Services 14,549 12,511 53,768 46,291 Total net sales (1) 64,698 64,040 274,515 260,174 Cost of sales: Products 35,197 35,238 151,286 144,996 Services 4,812 4,489 18,273 16,786 Total cost of sales 40,009 39,727 169,559 161,782 Gross margin 24,689 24,313 104,956 98,392 Operating expenses: Research and development 4,978 4,110 18,752 16,217 Selling, general and administrative 4,936 4,578 19,916 18,245 Total operating expenses 9,914 8,688 38,668 34,462 Operating income 14,775 15,625 66,288 63,930 Other income/(expense), net 126 502 803 1,807 Income before provision for income taxes 14,901 16,127 67,091 65,737 Provision for income taxes 2,228 2,441 9,680 10,481 Net income $ 12,673 $ 13,686 $ 57,411 $ 55,256 Earnings per share: Basic $ 0.74 $ 0.76 $ 3.31 $ 2.99 Diluted $ 0.73 $ 0.76 $ 3.28 $ 2.97 Shares used in computing earnings per share: Basic 17,057,622 17,963,249 17,352,119 18,471,336 Diluted 17,256,521 18,081,493 17,528,214 18,595,651 (1) Net sales by reportable segment: Americas $ 30,698 $ 29,322 $ 124,556 $ 116,914 Europe 16,900 14,946 68,640 60,288 Greater China 7,946 11,134 40,308 43,678 Japan 5,023 4,982 21,418 21,506 Rest of Asia Pacific 4,131 3,656 19,593 17,788 Total net sales $ 64,698 $ 64,040 $ 274,515 $ 260,174 (1) Net sales by category: iPhone $ 26,444 $ 33,362 $ 137,781 $ 142,381 Mac 9,032 6,991 28,622 25,740 iPad 6,797 4,656 23,724 21,280 Wearables, Home and Accessories 7,876 6,520 30,620 24,482 Services 14,549 12,511 53,768 46,291 Total net sales $ 64,698 $ 64,040 $ 274,515 $ 260,174
- 2. Apple Inc. CONDENSED CONSOLIDATED BALANCE SHEETS (Unaudited) (In millions, except number of shares which are reflected in thousands and par value) September 26, 2020 September 28, 2019 ASSETS: Current assets: Cash and cash equivalents $ 38,016 $ 48,844 Marketable securities 52,927 51,713 Accounts receivable, net 16,120 22,926 Inventories 4,061 4,106 Vendor non-trade receivables 21,325 22,878 Other current assets 11,264 12,352 Total current assets 143,713 162,819 Non-current assets: Marketable securities 100,887 105,341 Property, plant and equipment, net 36,766 37,378 Other non-current assets 42,522 32,978 Total non-current assets 180,175 175,697 Total assets $ 323,888 $ 338,516 LIABILITIES AND SHAREHOLDERS’ EQUITY: Current liabilities: Accounts payable $ 42,296 $ 46,236 Other current liabilities 42,684 37,720 Deferred revenue 6,643 5,522 Commercial paper 4,996 5,980 Term debt 8,773 10,260 Total current liabilities 105,392 105,718 Non-current liabilities: Term debt 98,667 91,807 Other non-current liabilities 54,490 50,503 Total non-current liabilities 153,157 142,310 Total liabilities 258,549 248,028 Commitments and contingencies Shareholders’ equity: Common stock and additional paid-in capital, $0.00001 par value: 50,400,000 shares authorized; 16,976,763 and 17,772,945 shares issued and outstanding, respectively 50,779 45,174 Retained earnings 14,966 45,898 Accumulated other comprehensive income/(loss) (406) (584) Total shareholders’ equity 65,339 90,488 Total liabilities and shareholders’ equity $ 323,888 $ 338,516
- 3. Apple Inc. CONDENSED CONSOLIDATED STATEMENTS OF CASH FLOWS (Unaudited) (In millions) Twelve Months Ended September 26, 2020 September 28, 2019 Cash, cash equivalents and restricted cash, beginning balances $ 50,224 $ 25,913 Operating activities: Net income 57,411 55,256 Adjustments to reconcile net income to cash generated by operating activities: Depreciation and amortization 11,056 12,547 Share-based compensation expense 6,829 6,068 Deferred income tax benefit (215) (340) Other (97) (652) Changes in operating assets and liabilities: Accounts receivable, net 6,917 245 Inventories (127) (289) Vendor non-trade receivables 1,553 2,931 Other current and non-current assets (9,588) 873 Accounts payable (4,062) (1,923) Deferred revenue 2,081 (625) Other current and non-current liabilities 8,916 (4,700) Cash generated by operating activities 80,674 69,391 Investing activities: Purchases of marketable securities (114,938) (39,630) Proceeds from maturities of marketable securities 69,918 40,102 Proceeds from sales of marketable securities 50,473 56,988 Payments for acquisition of property, plant and equipment (7,309) (10,495) Payments made in connection with business acquisitions, net (1,524) (624) Purchases of non-marketable securities (210) (1,001) Proceeds from non-marketable securities 92 1,634 Other (791) (1,078) Cash generated by/(used in) investing activities (4,289) 45,896 Financing activities: Proceeds from issuance of common stock 880 781 Payments for taxes related to net share settlement of equity awards (3,634) (2,817) Payments for dividends and dividend equivalents (14,081) (14,119) Repurchases of common stock (72,358) (66,897) Proceeds from issuance of term debt, net 16,091 6,963 Repayments of term debt (12,629) (8,805) Repayments of commercial paper, net (963) (5,977) Other (126) (105) Cash used in financing activities (86,820) (90,976) Increase/(Decrease) in cash, cash equivalents and restricted cash (10,435) 24,311 Cash, cash equivalents and restricted cash, ending balances $ 39,789 $ 50,224 Supplemental cash flow disclosure: Cash paid for income taxes, net $ 9,501 $ 15,263 Cash paid for interest $ 3,002 $ 3,423