Green Optical Networks with Signal Quality Guarantee
•
1 recomendación•871 vistas

Course: Communication Networks Optimization (UPC) Authors: Maria Stylianou, Joao Rosa, Zafar Gilani (http://www.slideshare.net/zafargilani)
![2 COMPUTER ARCHITECTURE AND NETWORKS OPTIMIZATION PROJECT. MAY/JUNE 2012
oe Optical Amplifiers (OA) IV. Fasty Heuristic
eoa Energy for an OA
en Energy for a Node In optimization problems, heuristics are applied for solv-
ew Energy for a Wavelength ing underlying problems. A heuristic[1] is an experience-
based technique, not always justified by a certain theory,
TABLE II but loosely defined for different cases and occasions. When
Constants optimal solutions are impractical, a heuristic is used to
speed up the process of finding a satisfactory solution,
Decision variables closed to the optimal one. In more precise terms, heuristics
Xn 1 if node n is used are strategies using readily accessible, though loosely ap-
Ee 1 if link e is used plicable, information to control problem solving in human
Rpe 1 if path p uses link e beings and machines.
Xpw 1 if wavelength w for path p is A greedy algorithm[2] is an example of a heuristic tech-
used nique. This algorithm follows the principle of choosing
Xdpw 1 if wavelength w is used for all the locally optimal solution at each stage, regardless of
paths of demand d whether that leads eventually to a global optimum. De-
yew 1 if link e and wavelength w is spite its greediness, the greedy algorithm may yield solu-
used tions that approximate a global optimal solution.
Variables For example[3], a greedy strategy for the traveling sales-
Xne number of links used by node n man problem (which is of a high computational complex-
hp hops for each path p ity) is the following heuristic: ”At each stage visit an un-
visited city nearest to the current city”. This heuristic
TABLE III
need not find a best solution but terminates in a reason-
Variables
able number of steps; finding an optimal solution typically
requires unreasonably many steps.
For this project, we have defined and successfully de-
Objective function: signed a greedy algorithm called ”Fasty”. Fasty studies all
possible paths for each corresponding demand and keeps
min( Ee ∗ oe ∗ eoa + Xn ∗ en the path with the least additional power consumed. In or-
einL ninN
der to achieve this, Fasty finds the links already used and
+ Xdpw ∗ hp ∗ ew) chooses the path that constitutes of the least new links.
dinD pinP winW The idea is to avoid using so-far unutilized links. As it
is defined in section I, the primary goal is to reduce the
Subject to (constraints): overall power consumption by using minimum links (thus
possibly shortening the overall path), minimum number of
Xdpw = 1∀d ∈ D (1)
nodes and wavelengths used to transmit traffic from point
pinP winW
A to B.
More specifically, for a set of demands, Fasty chooses
Rpe ∗ Xpw = yew ∀e ∈ L, w ∈ W (2)
randomly a demand to satisfy. Similarly, the wavelength
pinP
is chosen in a random way and the same wavelength is
yew ≤ |W | ∗ Ee ∀e ∈ L (3) used for the whole path of a demand. The algorithm en-
winW sures that a wavelength is used only in one path. A simple
example is given for better understanding of the main idea
Xne ≤ |L| ∗ Xn ∀n ∈ N (4) followed in this algorithm.
einL
A. Fasty example
The above constraints are described below: In figure 2, a demand gets in the network from node 1
and has node 4 as termiantion point. Let us consider that
1. For each demand, only one wavelength can be used nodes 1, 2, 3 and 4 are part of a bigger network but for
in all paths. purposes of simplicity it is not shown. The best path for
2. A wavelength in a path can be used only if the same satisfying this demand has been chosen to be the path {1,
wavelength is used in the link. 2, 3, 4} through the wavelength λ1. Now consider that a
3. For each link e, ensure that the number of wave- second demand enters into the network again from node
lengths used does not exceed the maximum number 1 with node 4 as destination. The rational solution is to
of wavelengths allowed. take the direct route as shown in the figure, however the
4. Number of links used by a node is less or equal to path {1, 2, 3, 4} which has been used already will provide a
number of links of a node. less expensive route in terms of minimum additional power
consumed. This is shown in figure 3.](data:image/gif;base64,R0lGODlhAQABAIAAAAAAAP///yH5BAEAAAAALAAAAAABAAEAAAIBRAA7)
Recomendados
Recomendados
Más contenido relacionado
La actualidad más candente
La actualidad más candente (16)
Destacado
Destacado (9)
Similar a Green Optical Networks with Signal Quality Guarantee
Similar a Green Optical Networks with Signal Quality Guarantee (20)
Más de Maria Stylianou
Más de Maria Stylianou (7)
Último
Último (20)
Green Optical Networks with Signal Quality Guarantee
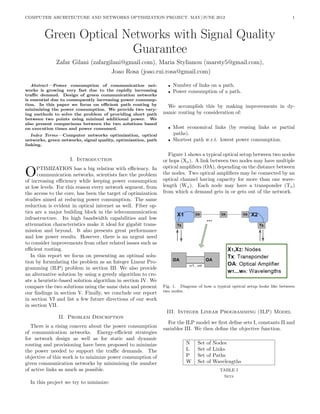
- 1. COMPUTER ARCHITECTURE AND NETWORKS OPTIMIZATION PROJECT. MAY/JUNE 2012 1 Green Optical Networks with Signal Quality Guarantee Zafar Gilani (zafargilani@gmail.com), Maria Stylianou (marsty5@gmail.com), Joao Rosa (joao.rui.rosa@gmail.com) Abstract—Power consumption of communication net- • Number of links on a path. works is growing very fast due to the rapidly increasing • Power consumption of a path. traffic demand. Design of green communication networks is essential due to consequently increasing power consump- tion. In this paper we focus on efficient path routing by We accomplish this by making improvements in dy- minimizing the power consumption. We provide two vary- ing methods to solve the problem of providing short path namic routing by consideration of: between two points using minimal additional power. We also present comparisons between the two solutions based on execution times and power consumed. • Most economical links (by reusing links or partial Index Terms—Computer networks optimization, optical paths). networks, green networks, signal quality, optimization, path • Shortest path w.r.t. lowest power consumption. linking. Figure 1 shows a typical optical setup between two nodes I. Introduction or hops (Xx ). A link between two nodes may have multiple optical amplifiers (OA), depending on the distance between O PTIMIZATION has a big relation with efficiency. In communication networks, scientists face the problem of increasing efficiency while keeping power consumption the nodes. Two optical amplifiers may be connected by an optical channel having capacity for more than one wave- at low levels. For this reason every network segment, from length (Wx ). Each node may have a transponder (Tx ) the access to the core, has been the target of optimization from which a demand gets in or gets out of the network. studies aimed at reducing power consumption. The same reduction is evident in optical internet as well. Fiber op- tics are a major building block in the telecommunication infrastructure. Its high bandwidth capabilities and low attenuation characteristics make it ideal for gigabit trans- mission and beyond. It also presents great performance and low power results. However, there is an urgent need to consider improvements from other related issues such as efficient routing. In this report we focus on presenting an optimal solu- tion by formulating the problem as an Integer Linear Pro- gramming (ILP) problem in section III. We also provide an alternative solution by using a greedy algorithm to cre- ate a heuristic-based solution algorithm in section IV. We compare the two solutions using the same data and present Fig. 1. Diagram of how a typical optical setup looks like between our findings in section V. Finally, we conclude our report two nodes. in section VI and list a few future directions of our work in section VII. III. Integer Linear Programming (ILP) Model II. Problem Description For the ILP model we first define sets I, constants II and There is a rising concern about the power consumption variables III. We then define the objective function. of communication networks. Energy-efficient strategies for network design as well as for static and dynamic routing and provisioning have been proposed to minimize N Set of Nodes the power needed to support the traffic demands. The L Set of Links objective of this work is to minimize power consumption of P Set of Paths given communication networks by minimizing the number W Set of Wavelengths of active links as much as possible. TABLE I Sets In this project we try to minimize:
- 2. 2 COMPUTER ARCHITECTURE AND NETWORKS OPTIMIZATION PROJECT. MAY/JUNE 2012 oe Optical Amplifiers (OA) IV. Fasty Heuristic eoa Energy for an OA en Energy for a Node In optimization problems, heuristics are applied for solv- ew Energy for a Wavelength ing underlying problems. A heuristic[1] is an experience- based technique, not always justified by a certain theory, TABLE II but loosely defined for different cases and occasions. When Constants optimal solutions are impractical, a heuristic is used to speed up the process of finding a satisfactory solution, Decision variables closed to the optimal one. In more precise terms, heuristics Xn 1 if node n is used are strategies using readily accessible, though loosely ap- Ee 1 if link e is used plicable, information to control problem solving in human Rpe 1 if path p uses link e beings and machines. Xpw 1 if wavelength w for path p is A greedy algorithm[2] is an example of a heuristic tech- used nique. This algorithm follows the principle of choosing Xdpw 1 if wavelength w is used for all the locally optimal solution at each stage, regardless of paths of demand d whether that leads eventually to a global optimum. De- yew 1 if link e and wavelength w is spite its greediness, the greedy algorithm may yield solu- used tions that approximate a global optimal solution. Variables For example[3], a greedy strategy for the traveling sales- Xne number of links used by node n man problem (which is of a high computational complex- hp hops for each path p ity) is the following heuristic: ”At each stage visit an un- visited city nearest to the current city”. This heuristic TABLE III need not find a best solution but terminates in a reason- Variables able number of steps; finding an optimal solution typically requires unreasonably many steps. For this project, we have defined and successfully de- Objective function: signed a greedy algorithm called ”Fasty”. Fasty studies all possible paths for each corresponding demand and keeps min( Ee ∗ oe ∗ eoa + Xn ∗ en the path with the least additional power consumed. In or- einL ninN der to achieve this, Fasty finds the links already used and + Xdpw ∗ hp ∗ ew) chooses the path that constitutes of the least new links. dinD pinP winW The idea is to avoid using so-far unutilized links. As it is defined in section I, the primary goal is to reduce the Subject to (constraints): overall power consumption by using minimum links (thus possibly shortening the overall path), minimum number of Xdpw = 1∀d ∈ D (1) nodes and wavelengths used to transmit traffic from point pinP winW A to B. More specifically, for a set of demands, Fasty chooses Rpe ∗ Xpw = yew ∀e ∈ L, w ∈ W (2) randomly a demand to satisfy. Similarly, the wavelength pinP is chosen in a random way and the same wavelength is yew ≤ |W | ∗ Ee ∀e ∈ L (3) used for the whole path of a demand. The algorithm en- winW sures that a wavelength is used only in one path. A simple example is given for better understanding of the main idea Xne ≤ |L| ∗ Xn ∀n ∈ N (4) followed in this algorithm. einL A. Fasty example The above constraints are described below: In figure 2, a demand gets in the network from node 1 and has node 4 as termiantion point. Let us consider that 1. For each demand, only one wavelength can be used nodes 1, 2, 3 and 4 are part of a bigger network but for in all paths. purposes of simplicity it is not shown. The best path for 2. A wavelength in a path can be used only if the same satisfying this demand has been chosen to be the path {1, wavelength is used in the link. 2, 3, 4} through the wavelength λ1. Now consider that a 3. For each link e, ensure that the number of wave- second demand enters into the network again from node lengths used does not exceed the maximum number 1 with node 4 as destination. The rational solution is to of wavelengths allowed. take the direct route as shown in the figure, however the 4. Number of links used by a node is less or equal to path {1, 2, 3, 4} which has been used already will provide a number of links of a node. less expensive route in terms of minimum additional power consumed. This is shown in figure 3.
- 3. GILANI, STYLIANOU, ROSA: GREEN OPTICAL NETWORKS WITH SIGNAL QUALITY GUARANTEE 3 Fig. 2. A possible but expensive path. Fig. 5. Execution time comparison between ILP model and Fasty heuristic. Fig. 3. Less expensive path. V. Solution comparison We compare the two solutions using IBM CPLEX for ILP modeling and C code for heuristic. C code is compiled using GCC version 4.6. We run experiments for 4, 6, 8, 10 and 12 demands. Both of the techniques use exactly the same data file to read input data. A. Execution time The Fasty heuristic shows better execution times than ILP model in CPLEX. Heuristic is generally tens of times Fig. 6. Power consumption comparison between ILP model and faster than the ILP model in CPLEX. This is shown in Fasty heuristic. figures 4 and 5. B. Optimal solution comparison the real optimal solutions of the problem. There is also one very interesting observation showing a very limited in- In figure 6, the optimal solutions of ILP model are crease in overall power consumed due to the fact that the shown. It is that the solutions for ILP model in CPLEX model and the heuristic try to minimize the number of new and the Fasty heuristic are close, however the heuristic links used. So with each new demand, only a certain pro- presents some vagueness in its solutions. Therefore, some portion of power, called additional power, is consumed as improvements are needed in the heuristic in order to reach extra. We elaborate on this in the next subsection. C. Additional power consumption Figure 7 shows decrease in additional power consumed as our heuristic progresses through a total of eight demands. We used eight demands for this figure as it shows a similar trend to other demand quantities and is simpler to com- prehend for the reader. As it can be seen, there is no addi- tional power consumption for demand D5 after satisfying D2. This implies that demand D5 was satisfied using al- ready utilized links and nodes and therefore the only extra cost was the new wavelength used which is minimal. Sim- ilarly, this is observed for D0, D6 and D4 after satisfying D3. VI. Conclusions Fig. 4. Execution time comparison between ILP model and Fasty From this study we conclude that ILP model in CPLEX heuristic. is much slower than the Fasty heuristic algorithm. Power
- 4. 4 COMPUTER ARCHITECTURE AND NETWORKS OPTIMIZATION PROJECT. MAY/JUNE 2012 Fig. 7. Heuristic: power decrease in-between demands for 8 de- mands. increases as the demands increase but only to a certain limit, as used links are reused. Moreover for a given net- work graph, the heuristic satisfies one demand after the other in such a way as to reduce the cost in terms of power consumed and path length. Therefore effective decrease in power used with each new demand can clearly be observed. VII. Future work Tests on multiple network graphs can prove to be an im- portant extension. This can be tested for different topolo- gies and various routes. Such a study can reveal various insights into various types of topologies and can provide usage criterion with increased efficiency. References [1] Heuristic, Wikipedia 2012. http : / / en . wikipedia . org / wiki / Heuristic _ (computer _ science) [2] Paul E. Black, Greedy algorithm, Dictionary of Algorithms and Data Structures. U.S. National Institute of Standards and Tech- nology, February 2005. http : / / www . nist . gov / dads / HTML / greedyalgo . html [3] Greedy algorithm, Wikipedia 2012. http : / / en . wikipedia . org / wiki / Greedy _ algorithm