SlideShare una empresa de Scribd logo
1 de 21
Descargar para leer sin conexión
February 2012
By: Michael Goodman

Nexus Research Group Report

The Connected Home: Video Game
Consoles as Entertainment Hubs
Executive Summary
Today’s video game consoles are more than just kids’ toys. With built-in network connections,
the ability to play DVDs and Blu-ray, stream movies and TV shows, access social networking
sites, and digital music sites the Sony PlayStation 3, Microsoft Xbox 360, and Nintendo Wii have
become entertainment hubs. This can be seen in a survey of Netflix and Hulu users conducted by
The Nielsen Company in March 2011. In this survey, 25% of Netflix viewers said that they watch
on a Wii, 13% on a PlayStation 3, and 12% on a Xbox 360 (see Exhibit 1).
Exhibit 1
Netflix and Hulu Users are Viewing on Video Game Consoles
Source: The Nielsen Company, 2012

% of Netflix and Hulu Viewers Who Watch Using a(n)...
(March 2011)
25%

Nintendo Wii

3%
13%

Sony PlayStation 3

3%
12%

Microsoft Xbox 360

2%
0%

5%

10%
Netflix

15%

20%

25%

30%

Hulu

Nexus Research Group has published this content for the sole use of Nexus Research Group and its clients. It may
not be duplicated, reproduced or retransmitted in whole or in part without the express permission of Nexus Research
Group. All rights reserved. All opinions and estimates herein constitute Nexus Research Group’s judgment as of this
date and are subject to change without notice.
© Copyright 2012. Nexus Research Group. All rights reserved.
The Connected Home: Video Game Consoles as Entertainment Hubs

February 2012

Microsoft, Sony and Nintendo have taken different approaches to developing their consoles as
home entertainment systems. Microsoft embraced digital distribution early on, while Sony has
sought to straddle the line between physical distribution (e.g., Blu-ray) and digital distribution
(e.g., PlayStation Movie Store). And Nintendo, in a departure from the past, is beginning to
embrace the console as a home entertainment system with the integration of Netflix and the iBBC
Player, but is taking a more conservative approach than either of its competitors.
This Report, examines how consumers are using connected devices in their homes with an
emphasis on video game consoles and the efforts of Microsoft, Sony, and Nintendo to position
themselves as entertainment hubs in the digital living room of today and the future.

2
© Copyright 2012. Nexus Research Group. All rights reserved.
The Connected Home: Video Game Consoles as Entertainment Hubs

February 2012

Contents
I.

Introduction .......................................................................................................................................... 3

II.

Impact of In-Home Connected Devices ................................................................................................ 4

III. Video Game Consoles as Home Entertainment Systems ...................................................................... 8
Console Activities ................................................................................................................................. 8
Time Spent by Activities ...................................................................................................................... 10
IV. Netflix and Hulu Come to the Console ............................................................................................... 15
VI. Conclusions and Recommendations ................................................................................................... 18
Conclusions......................................................................................................................................... 18
Recommendations ............................................................................................................................... 19

I.

Introduction

That consumption of on-demand movies, music and games is growing should come as no surprise to
anyone. However, the speed at which demand has grown for these applications and services and the
amount of bandwidth they consume is suprising. According to Sandvine (a network management
company), real-time entertainment (applications and protocols that allow “on-demand” entertainment
that is consumed as it arrives) as a percentage of fixed network traffic during the peak period (4pm 11pm) has grown at an average annual rate of 41% over the past three years. In 2009, real-time
entertainment accounted for 29.5% of fixed network traffic in North America between 4pm and
11pm; by 2011 it had grown to over half (53.6%).
Nor is this growth pattern entiely unique to North America. The Asia-Pacific region has seen peak
period usage of real-time entertainment grow from 26.3% of fixed network traffic in 2009 to 49.0%
in 2011; an average annual growth rate of 36.5%. Europe, however, has not seen as dramatic a rise.
In 2009, peak period usage of real-time entertainment accounted for 30.4% of fixed network traffic.
By 2011 it had grown to 33.2%; an average annual growth rate of 4.5%.
Real-Time Entertainment: Applications and protocols that allow “on-demand” entertainment that is
consumed (viewed or heard) as they arrive. This includes streamed or buffered audio (Pandora, Rdio)
and video (RTSP, RTP, RTMP, Flash, MPEG), peercasting (PPStream, Octoshape), placeshifting
(Slingbox), and specific streaming sites and services (Netflix, NCAA, Hulu, YouTube, Google
Video, Spotify, BBC iPlayer).
Secure Tunneling: Encrypted tunnels typically used for Virtual Private Networks and secure web
transactions.
Real-Time Communications: Applications and protocols that allow interactive chat, voice, and
video communications.
Bulk Entertainment: Entertainment that is acquired in bulk then consumed sometime after arrival
such as movie download services.

3
© Copyright 2012. Nexus Research Group. All rights reserved.
The Connected Home: Video Game Consoles as Entertainment Hubs

February 2012

Exhibit 1
Fixed Network Traffic Composition During Peak Period (4pm - 11pm)
Source: Sandvine Global Internet Phenomena Report, 2012

Top 5 Applications/Protocals During Peak Period
(North America, Fixed Networks)

150.0%

100.0%

50.0%

9.8%
4.0%
15.1%

2.3%

29.5%
38.7%

0.0%
2009
Web Browsing
P2P Filesharing
Storage & Back-up Services
Real-Time Communications
Gaming

12.1%
3.1%
19.2%

2.7%

9.4%
3.8%
14.3%

42.7%

53.6%

20.2%

16.6%

2010

2.3%

2011
Real-Time Entertainment
Secure Tunneling
Bulk Entertainment
Social Networking
All Other Traffic

Driving much of this growth is Netflix. With 21.6 million streaming accounts in 4Q 2011, Neftlix
accounted for 32.7% of downstream Internet traffic during North American peak home Internet
usage hours (4pm - 11pm). Think about what would happen to download speeds if the other roughly
100 million TV households in North America started using Netflix streaming.

II.

Impact of In-Home Connected Devices

Driving much of this growth has been the influx of connected devices. According to Sandvine, 55%
of real-time entertainment is consumed on the television (either directly to a connected TV or
indirectly via a game console, Blu-ray player or connected media player), a mobile device or tablet.
The remaining 45% is consumed on desktop and laptop computers, with some of this being forward
to the TV.
In 2009, the global installed base of in-home connected devices was nearly 64 million. Due to of
more connected devices entering the market, connectivity becoming a basic feature on a greater
number of devices, and services taking advantage of this connectivity, the installed base of in-home
connected devices grew to 319 in 2011. By 2016, Nexus Research Group anticipates that the installed
base of in-home connected devices will grow to 1.5 billion (see Exhibit 2 & 3). For more detail on
the growth of in-home connected devices, see the Nexus Research Group report The Connected

4
© Copyright 2012. Nexus Research Group. All rights reserved.
The Connected Home: Video Game Consoles as Entertainment Hubs

February 2012

Home: Battle for Dominance in the Digital Living Room and corresponding 2012 In-Home
Connected Device Forecast.
In the early stages, North America has been leading the growth of in-home connected devices. In
2009, North America accounted for 40% of the global installed base of in-home connected devices
followed by Western Europe with 31% and the Asia-Pacific region with a 22% share. By 2011,
North America still accounted for the largest of the global installed base of in-home connected
devices (35%) but the Asia-Pacific region was gaining and had tied Western Europe’s market share
(27%). By 2016, driven by growing economies in China and India, and a seemingly insatiable
demand for consumer electronics in Japan and South Korea the Asia Pacific regions share of in-home
connected devices will grow to 31% in 2016, edging out North America (30%) and Western Europe
(26%).

Exhibit 2
By 2016 the Installed Base of In-Home Connected Devices will Reach 1.5 Billion
Source: DFC Intelligence, 2012

Global Installed Base of In-Home Connected Devices
1,600
1,400

Units
(in Millions)

1,200
1,000
800
600
400
200
0
2009
Connected TVs

2010

2011

Blu-ray Players

2012

2013

Video Game Consoles

2014

2015

2016

Connected Media Players

5
© Copyright 2012. Nexus Research Group. All rights reserved.
The Connected Home: Video Game Consoles as Entertainment Hubs

February 2012

Exhibit 3
By 2016 the Installed Base of In-Home Connected Devices will Reach 1.5 Billion
Source: Nexus Research Group, 2012

Year

Connected
TVs

Blu-Ray Players

Video Game
Consoles

Connected
Media Players

Cumulative
Total

2009

22.1

-----

41.8

-----

63.9

2010

62.2

23.1

84.1

2.0

171.3

2011

129.3

58.0

123.7

8.4

319.3

2012

207.7

107.2

162.3

15.7

493.0

2013

304.6

175.9

206.0

24.9

711.4

2014

427.0

255.9

250.1

36.0

969.0

2015

565.8

342.4

295.8

49.4

1,253.4

2016

724.4

432.7

339.7

64.6

1,561.4

Because of their installed base, likelihood of being connected, and partnerships with content owners,
video game consoles have become important drivers of over-the-top content.
Established installed base. In 2011, there were 146 million current generation consoles
(PlayStation 3, Xbox 360 and Wii) in consumer’s homes worldwide (see Exhibit 4, & 5). By
2016, Nexus Research Group estimates that the global installed base of video game consoles
will grow to 170 million.
Users are taking advantage of connectivity. Not only is there a significant installed base of
video game consoles but unlike other internet-ready devices, which may offer connectivity as
a feature but are not actually connected to the internet, a significant number of video game
consoles are connected. In 2011, 39% of the global installed base of video game consoles
were connected, by 2016, this will grow to 44%.
Even this however does not tell the complete story. Among the current generation of
consoles, the Sony PlayStation 3 and Microsoft Xbox 360 have taken a much more
aggressive approach to connectivity than the Nintendo Wii. While all three consoles are
internet-ready Sony and Microsoft have pushed connected applications and content, such as
online gaming, video, music and social media, much harder than Nintendo. As a result, the
PlayStation 3 and Xbox 360 are more likely than the Wii to be connected.
When it comes to connectivity, the Xbox 360 is king. In 2011, Nexus Research Group
estimates that 57% of the Xbox 360 global installed base were connected to Xbox Live
(Microsoft’s online service for the Xbox 360). In comparison, 47% of the PlayStation 3 were
connected and only 23% of Wii’s were connected. Future generations of consoles are more
likely to be connected. Nexus Research Group estimates that more than half (51%) of next
generation consoles (Nintendo Wii U, Microsoft Xbox 720, and PlayStation 4) be physically
connected, with this likely increasing in the later stages of their product lifecycle.

6
© Copyright 2012. Nexus Research Group. All rights reserved.
The Connected Home: Video Game Consoles as Entertainment Hubs

February 2012

Geography is also a contributing factor to console connectivity. In 2011, 65% of both the
Xbox 360 and PlayStation 3 installed base was connected in North America. In comparison,
55% of the Western European Xbox 360 installed base was connected and 30% of the
Japanese installed base. Among the PlayStation 3 installed base in Japan 40% was connected,
while 30% of the Western European installed base was connected.
Content options available on video game consoles is growing. Content owners and
aggregrators are embracing the video game console as a distribution partner. In October
2011, Microsoft announced a significant expansion in the number of content providers
available on the Xbox 360. Over 40 global media partners (representing various regions of
the world) have been added include ESPN, EPIX, HBO, Hulu/Hulu Plus, LOVEFiLM,
Telefónica España – Movistar Imagenio, AlloCiné, Crackle, CinemaNow, Bravo, HBO,
BBC, Rogers on Demand and Telenovelas/Sports (Televisa).

Exhibit 4
Installed Base of Connected Consoles
Source: DFC Intelligence, 2012

Global Video Game Console Installed Base
200.0
180.0
160.0
Units
(in Millions)

140.0
120.0
100.0
80.0
60.0
40.0
20.0
0.0
2010

2011

2012

Console Installed Base

2013

2014

2015

2016

Connected Consoles

7
© Copyright 2012. Nexus Research Group. All rights reserved.
The Connected Home: Video Game Consoles as Entertainment Hubs

February 2012

Exhibit 5
Installed Base of Connected Consoles
Source: Nexus Research Group, 2012

Console Installed
Base

Year

Connected Consoles

% of Installed Base
Connected

2010

136.6

48.9

36%

2011

146.0

57.1

39%

2012

157.3

63.5

40%

2013

167.6

71.1

42%

2014

176.1

75.0

43%

2015

181.1

78.3

43%

2016

185.4

81.0

44%

III.

Video Game Consoles as Home Entertainment Systems

At its most basic level, the entertainment ecosystem is comprised of three primary components (for a
more in-depth examination of the entertainment ecosystem see Nexus Research Group Report - The
Connected Home: Battle for Dominance in the Digital Living Room):
Content. This includes things such movies and TV shows, music, games, user generated
content and apps.
Distribution. Distribution is defined as how consumers access content and include electronic
distribution over managed and unmanaged networks, broadcasting, and physical distribution
through brick-n-mortar retailers.
Device. Finally, require require some kind of device to consume the content on. This includes
(but are not limited to) TVs, set-top boxes, video game consoles, PCs, smartphones and
tablets.

Console Activities
Microsoft (via Xbox Live), Sony (via the PlayStation Network) and to a lesser degree Nintendo have
built an ecosystem that includes all of the components required to be a viable distribution channel for
movies and TV shows, music and games. The last requirement for success is consumer adoption and
early results indicate that video game consoles are off to a strong start establishing themselves as
home entertainment hubs.
Not surprisingly, considering it is a gaming console after all, gaming it the top activity among
console users age 13+, according to a survey conducted by The Nielsen Company in 2010 (see
Exhibit 6). Detailed examination of usage patterns by console, however, yields unique user profiles.
Eighty-seven percent of both Xbox 360 and Wii users age 13+ said they had played video games on
the respective console, while 80% had done on the PlayStation 3. The vast majority of this game play
8
© Copyright 2012. Nexus Research Group. All rights reserved.
The Connected Home: Video Game Consoles as Entertainment Hubs

February 2012

was offline, but just over half (54%) of Xbox 360 users and 45% of PlayStation 3 users said that they
play games online. In comparison, only 27% of Wii users age 13+ play games online. Given the
emphasis both Sony and Microsoft place on online game play, these results are not surprising.
After gaming, watching video is the next most popular activity on video game consoles. Video
consumption comes in a number of forms on video game consoles, including streaming, downloading
and watching physical media (DVDs and Blu-ray disks). Physical media (DVDs and Blu-ray disks) is
the most popular format for video on both the PlayStation 3 and Xbox 360. According to The Nielsen
Company, 72% of PlayStation 3 users age 13+ said they had watched a DVD or Blu-ray movies on
the PlayStation 3 and 43% of Xbox 360 users age 13+ said they had watched a DVD or Blu-ray
movieson the Xbox 360. (Please note that the Xbox 360 does not support Blu-ray and the Wii does
not support video playback from either DVD or Blu-ray)
After physical media, streaming is the next most popular method for watching video on a console.
Twenty-six percent of Xbox 360 users age 13+ said they watch VOD/subscription streaming services
(e.g., Netflix, Hulu Plus, LOVEFiLM) on their Xbox 360, followed by 23% of both PlayStaion 3
users and Wii users. Downloading is nearly as popular with 22% of Xbox 360 users age 13+ and
21% of PlayStation 3 users age 13+ saying that they had watched downloaded movies or TV shows
on their respective console. (Please note that the Wii does not have a hard drive, negating the ability
to download content)

Exhibit 6
% of Users* Age 13+ Who Do Each Activity
Source: The Nielsen Company, 2012

% of Users* Age 13+ Who Do Each Activity
87%
80%
87%
81%
72%
75%

Play Video Games (Net)
Play Video Games Offline
27%

Play Video Games Online
Watch DVDs/Blu-Ray

72%

43%
23%
23%
26%

Watch VOD/Streaming Subscription Service
Listen to CDs, MP3s or other Music (Online or …

8%

Watch Downloaded Movies or TV Shows

0%

23%
23%
21%
22%
20%
27%
20%

Use Internet for Browsing, Social Networking…

Wii

46%54%

20%

PlayStation 3

40%

60%

80%

100%

Xbox 360

9
© Copyright 2012. Nexus Research Group. All rights reserved.
The Connected Home: Video Game Consoles as Entertainment Hubs

February 2012

* User is defined as someone who owns the console and uses at least one of these features (October
2010)
Music, web browsing and social networking are also popular activities on video game consoles.
Twenty-three percent of both Xbox 360 and PlayStation 3 users age 13+ listen to CDs, MP3s or other
music (online or purchased) on their respective console. Music consumption is less popular on the
Wii with only 8% of users reporting that they listen to music. Twenty-seven percent of PlayStation 3
users age 13+ use their console for web browsing, social networking and watching video (user
generated) followed by 20% of Xbox 360 and Wii users.

Time Spent by Activity
Microsoft Xbox 360
Examining activities by time spent yields distinct usage patterns for each console. According to
Nielsen, despite all the non-gaming content available on the Xbox 360, users age 13+ spend the
majority of their console time (67%) playing games, up 8% YoY (see Exhibit 7). Xbox 360 users age
13+ are also far more likely to engage in online game play than users of the PlayStation 3 or Wii.
Thirty-three percent of Xbox 360 users age 13+ console time was spent playing games online
compared to 16% of PlayStation 3 users and 8% of Wii users.

Exhibit 7
Share of Console Time Among Xbox 360 Users* Age 13+
Source: The Nielsen Company, 2012

Share of Console Time Among Xbox 360 Users* Age 13+
34%
34%

Play Video Games Offline
28%

Play Video Games Online
10%

Watch VOD/Streaming Services
Watch DVDs/Blu-Ray

9%

Watch Downloaded Movies/TV
Shows
All Other (Brows Web, Listen to
Music, Other)

33%

14%

11%

6%
5%
11%

5%
0%

20%
2010

40%

2011

10
© Copyright 2012. Nexus Research Group. All rights reserved.
The Connected Home: Video Game Consoles as Entertainment Hubs

February 2012

* User is defined as someone who owns the console and uses at least one of these features (October
2010 and 2011)
It should be noted that this data was collected prior to Microsoft’s redesign of the Xbox 360’s user
interface which made it easier to discover movies, TV shows, music, and social networking apps as
well as the expansion of these offerings which began in late 2011 and continues through 2012.
According to Microsoft, prior to its latest update in the fall of 2011, 40% of all Xbox activity was
non-game. This translated to an average of 30 hours of video consumption per month per Xbox.
Overall, global video consumption on Xbox LIVE increased 140% from CY 2010 to CY 2011.
Overall, time spent on non-gaming activities by Xbox 360 users fell by 13% YoY, from 38% of
console time in October 2010 to 33% in October 2011. The majority of this decline was in the
“Other” category that included listening to music, web browsing, social media and any other
miscellaneous applications and services.
In 2011, video (DVDs, streamed and downloads) accounted for 85% of Xbox 360 users age 13+
console time spent on non-gaming activities, up 19% YoY. Watching video-on-demand
(VOD)/streaming services saw the most grow in the video category. Growing 40%, from 10% of
console time spent in October 2010 to 14% of console time spent in October 2011. Given the
improvements to the Xbox’s user interface and expanded content offerings it is likely that 2012 will
see time spent on the non-gaming activities grow.
Sony PlayStation 3
While the Xbox 360 appeals most strongly to hardcore gamers, the PlayStation 3, primarily due to
the inclusion of Blu-ray, has a more diversified usage profile. According to the Nielsen study,
gaming accounts for 54% of console time among PlayStation 3 users age 13+, up 10% YoY (see
Exhibit 8). Whereas online and offline game play is evenly split among Xbox 360 users, PlayStation
3 users age 13+ show a clear preference for offline game play. In 2012 offline game play accounted
for 38% of PlayStation 3 users age 13+ console time, up nearly 27% YoY. Online play declined
nearly 16%, from 19% of console time spent in 2010 to 16% in 2011.
Among PlayStation 3 users age 13+ console time spent on non-gaming activities fell nearly 10%
YoY, from 51% of console time in October 2010 to 46% in October 2011. Like Xbox 360 users, the
majority of this decline was in the “Other” category that included listening to music, web browsing,
social media and any other miscellaneous applications and services.
In 2011, video (DVDs, streamed and downloads) accounted for the vast majority (91%) of
PlayStation 3 users age 13+ console time spent on non-gaming activities, up 16% YoY. Watching
DVDs/Blu-ray is the most popular non-gaming activity among PlayStation users age 13+, accounting
for 22% of their console game time, followed by watching video-on-demand (VOD)/streaming
services (15%).
The success of Blu-ray on the PlayStation 3 has been critical to Sony as the PlayStation 3 accounts
for roughly two-thirds of the Blu-ray player installed base, however, streaming video is beginning to
cut into Blu-ray viewing. According to the Nielsen study, console time spent watching DVDs/Blu-

11
© Copyright 2012. Nexus Research Group. All rights reserved.
The Connected Home: Video Game Consoles as Entertainment Hubs

February 2012

ray fell 19% YoY, from 27% of console time spent in October 2010 to 22% of console time spent in
October 2011. This trend, if it continues, is troubling to both Sony (corporate) and the movie studios
who hoped that Blu-ray would replace the roughly $20 billion in revenue that DVDs once produced.

Exhibit 8
Share of Console Time Among PlayStation 3 Users* Age 13+
Source: The Nielsen Company, 2012

Share of Console Time Among PlayStation 3 Users* Age 13+
30%

Play Video Games Offline
Play Video Games Online

16%
9%

Watch VOD/Streaming Services

19%

15%

Watch DVDs/Blu-Ray

22%

Watch Downloaded Movies/TV
Shows
All Other (Brows Web, Listen to
Music, Other)

38%

27%

4%
5%
11%

4%
0%

20%
2010

40%

2011

* User is defined as someone who owns the console and uses at least one of these features (October
2010 and 2011)
Nintendo Wii
While the majority of console time spent by Wii users age 13+ is playing offline games, streaming
video usage is surprisingly strong as well. According to the Nielsen study, gaming accounted for
66% of Wii users age 13+ console time in October 2011. Of this, offline game play accounted for
87% of their time spent playing games. In October 2011, 8% of Wii users console game time was
spent playing games online, a decline of 33% from 12% in October 2010.
Among Wii users age 13+, console time spent on non-gaming activities grew 19% YoY, from 31%
of console time in October 2010 to 37% in October 2011. Driving this growth is consumption of
video. This is surprising since Nintendo did not design the Wii to be an entertainment hub. The Wii
lacks the ability to playback DVDs or Blu-ray disks and does not have a hard drive that movies or
TV show can be downloaded to. What you can do is watch video-on-demand (VOD)/streaming
services, and this category grew 65% YoY, from 20% of Wii users console time in October 2010 to
33% in October 2011.
12
© Copyright 2012. Nexus Research Group. All rights reserved.
The Connected Home: Video Game Consoles as Entertainment Hubs

February 2012

Exhibit 9
Share of Console Time Among Wii Users* Age 13+
Source: The Nielsen Company, 2012

Share of Console Time Among Wii Users* Age 13+
57%
55%

Play Video Games Offline
Play Video Games Online

12%

8%

20%

Watch VOD/Streaming Services
Watch DVDs/Blu-Ray

Not Applicable

Watch Downloaded Movies/TV
Shows

33%

Not Applicable

All Other

4%

11%

0%

20%

2010

40%

60%

2011

* User is defined as someone who owns the console and uses at least one of these features (October
2010 and 2011)
Clearly all three consoles have established themselves as viable alternative for movies and TV
shows, what is surprising in the degrees of success. Despite aspiring to be an entertainment hub
Microsoft still has a ways to go with only 28% of Xbox 360 users console time spent on video (see
Exhibit 10). However, with its revamped user interface, significantly more content partners, and
voice activated search through Kinect we are likely to see video consumption grow among Xbox 360
users. Though, video usage accounts for the smallest percentage of time among Xbox users,
compared to the PlayStation 3 and Wii, it is the most profitable as most, if not all, video services
require users to have a Gold subscription to Xbox Live ($59.99 annually). Plus the cost to download
a movie or TV show or subscribe to a streaming service.
Equally surprising is the strength of Nintendo in the video category. Though you cannot play DVDs
or Blu-ray disks or download movies or TV show to the Wii, Wii users still spent a third (33%) of
their console time watching video, 18% more than Xbox 360 users. Though Nintendo did not design
the Wii to be an entertainment hub the addition of Netflix has clearly had a significant impact on the
Wii. Also helping the Wii establish itself as a video platform is its position in the household.

13
© Copyright 2012. Nexus Research Group. All rights reserved.
The Connected Home: Video Game Consoles as Entertainment Hubs

February 2012

According to Nielsen, the Wii is the console most likely to be found in living / family room making it
available to a wide range of family members.

Exhibit 10
Share of Console Time Among PlayStation 3 Users* Age 13+
Source: The Nielsen Company, 2012

Share of Time Spent Watching Video Among Console Users* Age 13+
60%

40%

5%
5%
9%

22%

14%

15%

Xbox 360

20%

PlayStation 3

33%

0%

Watch VOD/Streaming Services

Watch DVDs/Blu-Ray

Wii
Watch Downloaded Movies/TV Shows

* User is defined as someone who owns the console and uses at least one of these features (October
2011)
As a game console the PlayStation 3 seems to have lost something, particularly when compared to its
predecessors, but as a home entertainment system the PlayStation is clearly hitting its stride with
PlayStation 3 users spending nearly as much time with non-game activities, particularly video, as
gaming. Overall, PlayStation 3 users spent 50% more console time watching video than Xbox users
and 27% more than Wii users.

14
© Copyright 2012. Nexus Research Group. All rights reserved.
The Connected Home: Video Game Consoles as Entertainment Hubs

IV.

February 2012

Netflix and Hulu Come to the Console

As evidenced in the previous section video game console are emerging as important platforms for
video distribution but what impact will they have on individual providers’ distribution plans. For at
least one video provider, Netflix, video game consoles have emerged as an important distribution
channel.
According to a survey of 12,000 U.S. Hulu and Netflix users in March 2011 by the Nielsen
Company, video game consoles were the top device for accessing Netflix. Fifty percent of Netflix
subscribers surveyed said that they use a video game console to watch Netflix. This was followed by
watching directly on a computer (42%) and watching on a computer connected to a TV (14%) (see
Exhibit 11).
In comparison, Hulu, though available on all three video game consoles (same as Netflix), saw only
8% of its user’s say that they watch on a game console. Hulu users are much more likely to watch
directly on a computer (89%) or on a computer connected to a TV.

Exhibit 11
How are Netflix and Hulu Users Watching?
Source: The Nielsen Company, 2012

% of Netflix and Hulu Viewers Who Watch Using a(n)...
(March 2011)
Computer Directly

89%

42%
14%20%

Computer Connected to TV
8%

Video Game Console

50%

3%
5%
2%
3%

Roku Box
Mobile Phone

2%6%
2% 11%

Connected TV
Internet-Connected Blu-ray Player
iPad

1%
3%

TiVo w/Netflix Access

2%
1%
1%
1%
1%

Apple TV
Google TV
0%

10%

20%
Hulu

30%

40%

50%

60%

70%

80%

90% 100%

Netflix

Now a large part of the discrepancy between Hulu and Netflix usage on video game consoles is
attributable to differing business models. Netflix content is only available via subscription ($7.99 per

15
© Copyright 2012. Nexus Research Group. All rights reserved.
The Connected Home: Video Game Consoles as Entertainment Hubs

February 2012

month), however, subscribers can access movies and TV shows across multiple devices (video game
consoles, connected TVs, iPads, connected media players, Blu-ray players, etc.). In contrast, Hulu
has both a free ad-supported service and a more robust subscription service ($7.99 per month),
however, only the subscription service is available via video game console.
In addition to having different business model the way consumers use Netflix and Hulu differ as
well. Netflix users are more well rounded; consuming both movies and television shows. According
to Nielsen, 53% of Netflix users watch both movies and television shows, 36% watch movies only
and 11% watch TV shows only (see Exhibit 12). In comparison, the vast majority of Hulu users
(73%) only watch TV shows, 18% only watch movies while 9% watch both movies and TV shows.

Exhibit 12
What are Netflix and Hulu Viewers Watching?
Source: The Nielsen Company, 2012

% of Netflix and Hulu Viewers Who Watch...
(March 2011)

36%

Movies

18%

11%

TV Shows

73%

53%

Both Equaly

9%
0%

20%

40%
Netflix

60%

80%

Hulu

The different usage profiles for Hulu and Netflix is significant as it indicates the need for video
providers to differentiate in some way. Many of the video providers available on the Xbox Live
(Netflix, Hulu Plus, Crackle, Vudu, CinemaNow) offer very similar content making it difficult for
them to breakout from the pack. Particularly since Netflix, with its high brand recognition and large
subscription base is available on all the consoles. Video providers offering movies and TV shows
must find a way to carve out their own niche or be content with the crumbs left behind by larger
providers like Netflix.

16
© Copyright 2012. Nexus Research Group. All rights reserved.
The Connected Home: Video Game Consoles as Entertainment Hubs

February 2012

Some ways to do this include the following.
Use marketing promotions. In the UK, Blinkbox is collaborating with Domino’s Pizza to
promote themed movie packages that provides customers with a 40% discount when they
spend £25 or more at Domino’s Pizza.
Combine physical and digital media. In the UK, Tesco (a grocery and general merchandise
retailer) and Blinkbox (Tesco owns 80% of Blinkbox) rewards customers who buy physical
DVDs and Blu-rays in-store with online access to the same movie on Blinkbox. Since rolling
out this initiative, Blinkbox has seen its monthly online sales double.
Focus on the high-end, early adopter. While not quite up to the quality of Blu-ray, Vudu's
high-quality HDX format significantly outperforms standard DVDs, and at least comes close
to the video quality of Blu-ray. In addition, Vudu was also the first online video service to
offer 3D video, though not surprisingly the selection is limited.

17
© Copyright 2012. Nexus Research Group. All rights reserved.
The Connected Home: Video Game Consoles as Entertainment Hubs

VI.

February 2012

Conclusions and Recommendations

Conclusions
While many in-home connected devices (such as connected TVs, Blu-ray players and connected
media players) are entering the market none can claim to be having the same impact as video game
consoles. This can be seen in Exhibit 1, which shows 25% of Netflix users watch on a Nintendo Wii.
While competition from other devices is sure to increase in the next several years it is unlikely that
video game consoles will recede into the background. Rather they will continue to add new
capabilities (such as Xbox 360’s voice search) and additional content and grow.
Additional insights include the following:
Connected devices are driving the growth on real-time entertainment. According to
Sandvine (a network management company), 55% of real-time entertainment is consumed on the
television (either directly to a connected TV or indirectly via a game console, Blu-ray player or
connected media player), a mobile device or tablet. The remaining 45% is consumed on desktop
and laptop computers, with some of this being forward to the TV.
The global installed base of video game consoles continues to grow. In 2011, there were 146
million current generation consoles (PlayStation 3, Xbox 360 and Wii) in consumer’s homes
worldwide (see Exhibit 4, & 5). By 2016, Nexus Research Group estimates that the global
installed base of video game consoles will grow to 170 million.
Unlike other in-home connected devices, consumers are actually using the connectivity in
video game consoles. While many devices are network capable, it does not mean that consumers
are actually connecting them to their home network or use them to access online content. This
however, is not the case with video game consoles. In 2011, 39% of the global installed base of
video game consoles were connected, by 2016, this will grow to 44%.
Xbox is the top console for connectivity. Nexus Research Group estimates that 57% of the
Xbox 360 global installed base are connected to Xbox Live (Microsoft’s online service for the
Xbox 360). In comparison, 47% of the PlayStation 3 are connected and only 23% of Wii’s are
connected.
Geography is a contributing factor to console connectivity. In 2011, 65% of both the Xbox
360 and PlayStation 3 installed base was connected in North America. In comparison, 55% of the
Western European Xbox 360 installed base was connected and 30% of the Japanese installed
base. Among the PlayStation 3 installed base in Japan 40% was connected, while 30% of the
Western European installed base was connected.
The number of content options available on video game consoles is growing. Content owners
and aggregrators are embracing the video game console as a distribution partner.
The PlayStation 3 is a true entertainment hub. More than any other console, PlayStation 3
users split their console time evenly between gaming and non-gaming activities. Gaming

18
© Copyright 2012. Nexus Research Group. All rights reserved.
The Connected Home: Video Game Consoles as Entertainment Hubs

February 2012

accounts for 54% of console time among PlayStation 3 users age 13+ while non-gaming
activities account for 46% of their console time.
Recent updates make the Xbox 360 a more formidable entertainment hub. While nongaming activities have lagged on the Xbox 360 (compared to the PlayStation 3 and Wii),
improvements to its user interface and expanded content offerings make it likely that 2012 will
see time spent on the non-gaming activities, particularly video, grow significantly.
Streaming, particularly on game consoles is having a negative influence on Blu-ray. The
success of Blu-ray on the PlayStation 3 has been critical to Sony as the PlayStation 3 accounts
for roughly two-thirds of the Blu-ray installed base, however, streaming video is beginning to cut
into Blu-ray viewing. This trend, if it continues, is troubling to both Sony (corporate) and movie
studios who hoped that Blu-ray would replace the roughly $20 billion in revenue that DVDs once
produced.

Recommendations
Discovery must improve. Regardless of the device if you don’t know the programming is
available or can’t find it, you can’t view it. Currently it is difficult to discover movies and TV
shows if you are not specifically searching for it. This must improve.
Video providers must differentiate themselves from each other. Too a large extent, video
providers are much of the same content. This gives Netflix with its large subscriber base and high
brand awareness a large advantage. Whether it is through promotions, exclusive rights, unique
business models, or niche offerings, just to name a few, video providers must find ways to
differentiate themselves from the competition.
Simplify the registration process. If the registration process is too complicated or requires too
many steps consumers will just abandon the process. There are lots of other video services with
similar content. For example, the registration for Crackle on the Xbox 360 is a two step process
requiring you to register on both Xbox Live and online.
Don’t forget about customer care. You never get a second chance to make a first impression
and nowhere can you make a bigger impression than with excellent customer care. This should
include email and instant help through chat and telephone support. In addition, companies should
also publish a comprehensive FAQs and help page online.
Combine physical and digital media. In the UK, Tesco (a grocery and general merchandise
retailer) and Blinkbox (Tesco owns 80% of Blinkbox) rewards customers who buy physical
DVDs and Blu-rays in-store with online access to the same movie on Blinkbox. Since rolling out
this initiative, Blinkbox has seen its monthly online sales double.
Offer movies that will appeal to the high-end, early adopter. While not quite up to the quality
of Blu-ray, Vudu's high-quality HDX format significantly outperforms standard DVDs, and at
least comes close to the video quality of Blu-ray. In addition, Vudu was also the first online video
service to offer 3D video, though not surprisingly the selection is limited.

19
© Copyright 2012. Nexus Research Group. All rights reserved.
The Connected Home: Video Game Consoles as Entertainment Hubs

February 2012

20
© Copyright 2012. Nexus Research Group. All rights reserved.
The Connected Home: Video Game Consoles as Entertainment Hubs

February 2012

Conditions of Purchase
Purchase of this multi-client study is on a nonexclusive basis. This study has not been commissioned
or contracted for by any one person or organization. The information contained is confidential to the
purchaser, and the purchaser agrees not to circulate or loan the study in whole or in part to: their
subsidiaries or divisions, industry trade associations (if not the purchaser), the general public, the
media, nor other parties not belonging to their company, agency or organization. Unauthorized
reproduction and dissemination which is discovered by Nexus Research Group (the publisher) shall
constitute grounds for legal prosecution and damages under U. S. copyright law.
Nexus Research Group has made every attempt to verify the accuracy and completeness of
information in this study from sources we believe to be reliable. It is understood, however, that our
estimates, forecasts, opinions and recommendations represent the judgment of our analysts, based on
the best information available at the time of publication. It is recommended that purchasers also
consult other available business sources and not rely solely on this analysis as the basis for major
strategic, financial, or management decisions. Nexus Research Group makes no warranty or
representation, either expressed or implied, with respect to the information in this report. In no event
will Nexus Research Group be liable for direct, indirect or consequential damages resulting from any
defect or inaccuracy in this report, even if advised of the possibility of such damages.
Information about specific companies is not intended to be a complete description, nor of their
securities, nor is this study an offer to buy or sell such securities. Nexus Research Group’s liability, if
any, shall not exceed the amount paid for this study.
About This Report
This report is part of a series of reports on Advertising and Games. The focus of this report is on the
overall industry. Other reports have more detailed analysis of companies, business models, trends
and breakouts of individual segments like advertising in and around console / PC games or social /
casual games.. The reports in this Advertising and Games series, including this report, are based on a
review of historical trends and opinions of leading members of the video game industry, including
analysts, consultants, developers, publishers, retailers and consumers. This report has been prepared
by utilizing a variety of primary and secondary research techniques including: telephone and personal
interviews; analysis of market surveys, trade journals and company literature; extensive database
searches; and Nexus Research Group’s original compilations and analysis.
A Nexus Research Group report is more than a collection of raw statistics. We carefully scrutinize
and analyze data from a variety of sources. The result is a comprehensive overview that puts facts
and figures in context. Anyone who has attempted to collect figures for the online game industry
knows that is difficult to obtain accurate statistics. We have studied market surveys, investment
analyst reports and other sources of industry information. Our statistics and forecasts are based on the
careful analysis of the available research, a great deal of which is contradictory. In many cases, we
made assumptions based on the best available information. We feel our figures accurately reflect past
and future market conditions. At the very least, these numbers track the industry trends and
accurately estimate the market share of the various players.
21
© Copyright 2012. Nexus Research Group. All rights reserved.

Más contenido relacionado

La actualidad más candente

7 predictions about the future of media
7 predictions about the future of media7 predictions about the future of media
7 predictions about the future of medianschenck
 
7 predictions about the future of media by BI Intelligence
7 predictions about the future of media by BI Intelligence7 predictions about the future of media by BI Intelligence
7 predictions about the future of media by BI IntelligencePeter Osicka
 
Kpcb internet trends_2012_final
Kpcb internet trends_2012_finalKpcb internet trends_2012_final
Kpcb internet trends_2012_finalFelipe LOAIZA
 
Pr chapter 13
Pr chapter 13Pr chapter 13
Pr chapter 13devy7
 
Opening plenary panel: the rise of the app #BPCW11
Opening plenary panel: the rise of the app #BPCW11Opening plenary panel: the rise of the app #BPCW11
Opening plenary panel: the rise of the app #BPCW11Headstar
 
Digital Cult To Digital Culture
Digital Cult To Digital CultureDigital Cult To Digital Culture
Digital Cult To Digital Culturenextmediaevents
 
The China App Index: Photo-Sharing via WeChat Sparks Viral Growth (June 2013)
The China App Index: Photo-Sharing via WeChat Sparks Viral Growth (June 2013)The China App Index: Photo-Sharing via WeChat Sparks Viral Growth (June 2013)
The China App Index: Photo-Sharing via WeChat Sparks Viral Growth (June 2013)WandouLabs
 

La actualidad más candente (12)

Mobile Metrics
Mobile MetricsMobile Metrics
Mobile Metrics
 
7 predictions about the future of media
7 predictions about the future of media7 predictions about the future of media
7 predictions about the future of media
 
7 predictions about the future of media by BI Intelligence
7 predictions about the future of media by BI Intelligence7 predictions about the future of media by BI Intelligence
7 predictions about the future of media by BI Intelligence
 
Kpcb Internet trends 2012
Kpcb Internet trends 2012Kpcb Internet trends 2012
Kpcb Internet trends 2012
 
Kpcb internet trends_2012_final
Kpcb internet trends_2012_finalKpcb internet trends_2012_final
Kpcb internet trends_2012_final
 
Internet trends
Internet trendsInternet trends
Internet trends
 
KPCB Internet Trends 2012
KPCB Internet Trends 2012KPCB Internet Trends 2012
KPCB Internet Trends 2012
 
Mobile future in_focus
Mobile future in_focusMobile future in_focus
Mobile future in_focus
 
Pr chapter 13
Pr chapter 13Pr chapter 13
Pr chapter 13
 
Opening plenary panel: the rise of the app #BPCW11
Opening plenary panel: the rise of the app #BPCW11Opening plenary panel: the rise of the app #BPCW11
Opening plenary panel: the rise of the app #BPCW11
 
Digital Cult To Digital Culture
Digital Cult To Digital CultureDigital Cult To Digital Culture
Digital Cult To Digital Culture
 
The China App Index: Photo-Sharing via WeChat Sparks Viral Growth (June 2013)
The China App Index: Photo-Sharing via WeChat Sparks Viral Growth (June 2013)The China App Index: Photo-Sharing via WeChat Sparks Viral Growth (June 2013)
The China App Index: Photo-Sharing via WeChat Sparks Viral Growth (June 2013)
 

Similar a Connected Home: Video Game Consoles as Entertainment Hubs

Connected Home: Fight for the Digital Lvingroom
Connected Home: Fight for the Digital LvingroomConnected Home: Fight for the Digital Lvingroom
Connected Home: Fight for the Digital LvingroomMichael Goodman
 
OTT Video: US Market Perspectives & Next Gen Services
OTT Video: US Market Perspectives & Next Gen ServicesOTT Video: US Market Perspectives & Next Gen Services
OTT Video: US Market Perspectives & Next Gen ServicesRyan Petty
 
Wave 2 - Mobility | UM | Social Media Tracker
Wave 2  - Mobility | UM | Social Media TrackerWave 2  - Mobility | UM | Social Media Tracker
Wave 2 - Mobility | UM | Social Media TrackerUM Wave
 
Nielsen digital consumer_report_final
Nielsen digital consumer_report_finalNielsen digital consumer_report_final
Nielsen digital consumer_report_finalankitsuchanti
 
Facts and Figures for Understanding Market Trends in Digital Content Industry
Facts and Figures for Understanding Market Trends in Digital Content IndustryFacts and Figures for Understanding Market Trends in Digital Content Industry
Facts and Figures for Understanding Market Trends in Digital Content IndustryTimo Argillander
 
Keynote: Riding the Digital Wave
Keynote: Riding the Digital WaveKeynote: Riding the Digital Wave
Keynote: Riding the Digital WaveMerging Media
 
ipoque p2p Survey 2006
ipoque p2p Survey 2006ipoque p2p Survey 2006
ipoque p2p Survey 2006ipoque
 
Mac301 convergence and smartphones
Mac301 convergence and smartphonesMac301 convergence and smartphones
Mac301 convergence and smartphonesRob Jewitt
 
Applications – Beyond Bits and Bytes
Applications – Beyond Bits and BytesApplications – Beyond Bits and Bytes
Applications – Beyond Bits and Bytesarjunrc
 
Taking advantage of the growth in mobile gaming
Taking advantage of the growth in mobile gamingTaking advantage of the growth in mobile gaming
Taking advantage of the growth in mobile gamingÓlafur Andri Ragnarsson
 
Japan Digital Overview from Neo @ Ogilvy 2010
Japan Digital Overview from Neo @ Ogilvy 2010Japan Digital Overview from Neo @ Ogilvy 2010
Japan Digital Overview from Neo @ Ogilvy 2010Barney Loehnis
 
Netflix - strategy formulation
Netflix - strategy formulationNetflix - strategy formulation
Netflix - strategy formulationRiya Aseef
 
MDR latin display
MDR latin displayMDR latin display
MDR latin displayIan Hendy
 
End of year review/preview
End of year review/previewEnd of year review/preview
End of year review/previewNigelG
 
The New TV Remote
The New TV RemoteThe New TV Remote
The New TV RemoteOoyala
 
The New TV Remote
The New TV RemoteThe New TV Remote
The New TV RemoteEastwick
 
Product Market Study – Multimedia & Digital Contents Market in Japan (2012)
Product Market Study – Multimedia & Digital Contents Market in Japan (2012)Product Market Study – Multimedia & Digital Contents Market in Japan (2012)
Product Market Study – Multimedia & Digital Contents Market in Japan (2012)Technopreneurs Association of Malaysia
 
Netflix Public Relations Case analysis
Netflix Public Relations Case analysisNetflix Public Relations Case analysis
Netflix Public Relations Case analysisAbhijeet Thorat
 

Similar a Connected Home: Video Game Consoles as Entertainment Hubs (20)

Connected Home: Fight for the Digital Lvingroom
Connected Home: Fight for the Digital LvingroomConnected Home: Fight for the Digital Lvingroom
Connected Home: Fight for the Digital Lvingroom
 
OTT Video: US Market Perspectives & Next Gen Services
OTT Video: US Market Perspectives & Next Gen ServicesOTT Video: US Market Perspectives & Next Gen Services
OTT Video: US Market Perspectives & Next Gen Services
 
Wave 2 - Mobility | UM | Social Media Tracker
Wave 2  - Mobility | UM | Social Media TrackerWave 2  - Mobility | UM | Social Media Tracker
Wave 2 - Mobility | UM | Social Media Tracker
 
Nielsen digital consumer_report_final
Nielsen digital consumer_report_finalNielsen digital consumer_report_final
Nielsen digital consumer_report_final
 
Prez cross-video-days-english
Prez cross-video-days-englishPrez cross-video-days-english
Prez cross-video-days-english
 
Facts and Figures for Understanding Market Trends in Digital Content Industry
Facts and Figures for Understanding Market Trends in Digital Content IndustryFacts and Figures for Understanding Market Trends in Digital Content Industry
Facts and Figures for Understanding Market Trends in Digital Content Industry
 
Keynote: Riding the Digital Wave
Keynote: Riding the Digital WaveKeynote: Riding the Digital Wave
Keynote: Riding the Digital Wave
 
ipoque p2p Survey 2006
ipoque p2p Survey 2006ipoque p2p Survey 2006
ipoque p2p Survey 2006
 
Mac301 convergence and smartphones
Mac301 convergence and smartphonesMac301 convergence and smartphones
Mac301 convergence and smartphones
 
Applications – Beyond Bits and Bytes
Applications – Beyond Bits and BytesApplications – Beyond Bits and Bytes
Applications – Beyond Bits and Bytes
 
Taking advantage of the growth in mobile gaming
Taking advantage of the growth in mobile gamingTaking advantage of the growth in mobile gaming
Taking advantage of the growth in mobile gaming
 
Japan Digital Overview from Neo @ Ogilvy 2010
Japan Digital Overview from Neo @ Ogilvy 2010Japan Digital Overview from Neo @ Ogilvy 2010
Japan Digital Overview from Neo @ Ogilvy 2010
 
Future of television
Future of televisionFuture of television
Future of television
 
Netflix - strategy formulation
Netflix - strategy formulationNetflix - strategy formulation
Netflix - strategy formulation
 
MDR latin display
MDR latin displayMDR latin display
MDR latin display
 
End of year review/preview
End of year review/previewEnd of year review/preview
End of year review/preview
 
The New TV Remote
The New TV RemoteThe New TV Remote
The New TV Remote
 
The New TV Remote
The New TV RemoteThe New TV Remote
The New TV Remote
 
Product Market Study – Multimedia & Digital Contents Market in Japan (2012)
Product Market Study – Multimedia & Digital Contents Market in Japan (2012)Product Market Study – Multimedia & Digital Contents Market in Japan (2012)
Product Market Study – Multimedia & Digital Contents Market in Japan (2012)
 
Netflix Public Relations Case analysis
Netflix Public Relations Case analysisNetflix Public Relations Case analysis
Netflix Public Relations Case analysis
 

Más de Michael Goodman

The Future of TV - Connected Devices and OTT Disruption
The Future of TV - Connected Devices and OTT DisruptionThe Future of TV - Connected Devices and OTT Disruption
The Future of TV - Connected Devices and OTT DisruptionMichael Goodman
 
Digital Media - Multiple Markets, Multiple Opportunities
Digital Media - Multiple Markets, Multiple OpportunitiesDigital Media - Multiple Markets, Multiple Opportunities
Digital Media - Multiple Markets, Multiple OpportunitiesMichael Goodman
 
Gamification: Driving Engagement and Loyalty
Gamification: Driving Engagement and LoyaltyGamification: Driving Engagement and Loyalty
Gamification: Driving Engagement and LoyaltyMichael Goodman
 
Succeeding in a Fragmented Media and Entertainment Market
Succeeding in a Fragmented Media and Entertainment MarketSucceeding in a Fragmented Media and Entertainment Market
Succeeding in a Fragmented Media and Entertainment MarketMichael Goodman
 
Boomers Mean Big Business
Boomers Mean Big BusinessBoomers Mean Big Business
Boomers Mean Big BusinessMichael Goodman
 

Más de Michael Goodman (6)

The Future of TV - Connected Devices and OTT Disruption
The Future of TV - Connected Devices and OTT DisruptionThe Future of TV - Connected Devices and OTT Disruption
The Future of TV - Connected Devices and OTT Disruption
 
Digital Media - Multiple Markets, Multiple Opportunities
Digital Media - Multiple Markets, Multiple OpportunitiesDigital Media - Multiple Markets, Multiple Opportunities
Digital Media - Multiple Markets, Multiple Opportunities
 
Gamification: Driving Engagement and Loyalty
Gamification: Driving Engagement and LoyaltyGamification: Driving Engagement and Loyalty
Gamification: Driving Engagement and Loyalty
 
Succeeding in a Fragmented Media and Entertainment Market
Succeeding in a Fragmented Media and Entertainment MarketSucceeding in a Fragmented Media and Entertainment Market
Succeeding in a Fragmented Media and Entertainment Market
 
Boomers Mean Big Business
Boomers Mean Big BusinessBoomers Mean Big Business
Boomers Mean Big Business
 
The Power of Television
The Power of TelevisionThe Power of Television
The Power of Television
 

Último

Call Girls Manjri Call Me 7737669865 Budget Friendly No Advance Booking
Call Girls Manjri Call Me 7737669865 Budget Friendly No Advance BookingCall Girls Manjri Call Me 7737669865 Budget Friendly No Advance Booking
Call Girls Manjri Call Me 7737669865 Budget Friendly No Advance Bookingroncy bisnoi
 
Science City Kolkata ( Call Girls ) Kolkata ✔ 6297143586 ✔ Hot Model With Sex...
Science City Kolkata ( Call Girls ) Kolkata ✔ 6297143586 ✔ Hot Model With Sex...Science City Kolkata ( Call Girls ) Kolkata ✔ 6297143586 ✔ Hot Model With Sex...
Science City Kolkata ( Call Girls ) Kolkata ✔ 6297143586 ✔ Hot Model With Sex...rahim quresi
 
Independent Sonagachi Escorts ✔ 9332606886✔ Full Night With Room Online Booki...
Independent Sonagachi Escorts ✔ 9332606886✔ Full Night With Room Online Booki...Independent Sonagachi Escorts ✔ 9332606886✔ Full Night With Room Online Booki...
Independent Sonagachi Escorts ✔ 9332606886✔ Full Night With Room Online Booki...Riya Pathan
 
Behala ( Call Girls ) Kolkata ✔ 6297143586 ✔ Hot Model With Sexy Bhabi Ready ...
Behala ( Call Girls ) Kolkata ✔ 6297143586 ✔ Hot Model With Sexy Bhabi Ready ...Behala ( Call Girls ) Kolkata ✔ 6297143586 ✔ Hot Model With Sexy Bhabi Ready ...
Behala ( Call Girls ) Kolkata ✔ 6297143586 ✔ Hot Model With Sexy Bhabi Ready ...ritikasharma
 
Independent Joka Escorts ✔ 8250192130 ✔ Full Night With Room Online Booking 2...
Independent Joka Escorts ✔ 8250192130 ✔ Full Night With Room Online Booking 2...Independent Joka Escorts ✔ 8250192130 ✔ Full Night With Room Online Booking 2...
Independent Joka Escorts ✔ 8250192130 ✔ Full Night With Room Online Booking 2...noor ahmed
 
Independent Hatiara Escorts ✔ 9332606886✔ Full Night With Room Online Booking...
Independent Hatiara Escorts ✔ 9332606886✔ Full Night With Room Online Booking...Independent Hatiara Escorts ✔ 9332606886✔ Full Night With Room Online Booking...
Independent Hatiara Escorts ✔ 9332606886✔ Full Night With Room Online Booking...Riya Pathan
 
Call Girls Agency In Goa 💚 9316020077 💚 Call Girl Goa By Russian Call Girl ...
Call Girls  Agency In Goa  💚 9316020077 💚 Call Girl Goa By Russian Call Girl ...Call Girls  Agency In Goa  💚 9316020077 💚 Call Girl Goa By Russian Call Girl ...
Call Girls Agency In Goa 💚 9316020077 💚 Call Girl Goa By Russian Call Girl ...russian goa call girl and escorts service
 
👙 Kolkata Call Girls Sonagachi 💫💫7001035870 Model escorts Service
👙  Kolkata Call Girls Sonagachi 💫💫7001035870 Model escorts Service👙  Kolkata Call Girls Sonagachi 💫💫7001035870 Model escorts Service
👙 Kolkata Call Girls Sonagachi 💫💫7001035870 Model escorts Serviceanamikaraghav4
 
Top Rated Kolkata Call Girls Khardah ⟟ 6297143586 ⟟ Call Me For Genuine Sex S...
Top Rated Kolkata Call Girls Khardah ⟟ 6297143586 ⟟ Call Me For Genuine Sex S...Top Rated Kolkata Call Girls Khardah ⟟ 6297143586 ⟟ Call Me For Genuine Sex S...
Top Rated Kolkata Call Girls Khardah ⟟ 6297143586 ⟟ Call Me For Genuine Sex S...ritikasharma
 
👙 Kolkata Call Girls Park Circus 💫💫7001035870 Model escorts Service
👙  Kolkata Call Girls Park Circus 💫💫7001035870 Model escorts Service👙  Kolkata Call Girls Park Circus 💫💫7001035870 Model escorts Service
👙 Kolkata Call Girls Park Circus 💫💫7001035870 Model escorts Serviceanamikaraghav4
 
College Call Girls New Alipore - For 7001035870 Cheap & Best with original Ph...
College Call Girls New Alipore - For 7001035870 Cheap & Best with original Ph...College Call Girls New Alipore - For 7001035870 Cheap & Best with original Ph...
College Call Girls New Alipore - For 7001035870 Cheap & Best with original Ph...anamikaraghav4
 
Call Girl Nashik Saloni 7001305949 Independent Escort Service Nashik
Call Girl Nashik Saloni 7001305949 Independent Escort Service NashikCall Girl Nashik Saloni 7001305949 Independent Escort Service Nashik
Call Girl Nashik Saloni 7001305949 Independent Escort Service NashikCall Girls in Nagpur High Profile
 
Model Call Girls In Pazhavanthangal WhatsApp Booking 7427069034 call girl ser...
Model Call Girls In Pazhavanthangal WhatsApp Booking 7427069034 call girl ser...Model Call Girls In Pazhavanthangal WhatsApp Booking 7427069034 call girl ser...
Model Call Girls In Pazhavanthangal WhatsApp Booking 7427069034 call girl ser... Shivani Pandey
 
𓀤Call On 6297143586 𓀤 Ultadanga Call Girls In All Kolkata 24/7 Provide Call W...
𓀤Call On 6297143586 𓀤 Ultadanga Call Girls In All Kolkata 24/7 Provide Call W...𓀤Call On 6297143586 𓀤 Ultadanga Call Girls In All Kolkata 24/7 Provide Call W...
𓀤Call On 6297143586 𓀤 Ultadanga Call Girls In All Kolkata 24/7 Provide Call W...rahim quresi
 

Último (20)

Russian ℂall gIRLS In Goa 9316020077 ℂall gIRLS Service In Goa
Russian ℂall gIRLS In Goa 9316020077  ℂall gIRLS Service  In GoaRussian ℂall gIRLS In Goa 9316020077  ℂall gIRLS Service  In Goa
Russian ℂall gIRLS In Goa 9316020077 ℂall gIRLS Service In Goa
 
Call Girls Manjri Call Me 7737669865 Budget Friendly No Advance Booking
Call Girls Manjri Call Me 7737669865 Budget Friendly No Advance BookingCall Girls Manjri Call Me 7737669865 Budget Friendly No Advance Booking
Call Girls Manjri Call Me 7737669865 Budget Friendly No Advance Booking
 
Science City Kolkata ( Call Girls ) Kolkata ✔ 6297143586 ✔ Hot Model With Sex...
Science City Kolkata ( Call Girls ) Kolkata ✔ 6297143586 ✔ Hot Model With Sex...Science City Kolkata ( Call Girls ) Kolkata ✔ 6297143586 ✔ Hot Model With Sex...
Science City Kolkata ( Call Girls ) Kolkata ✔ 6297143586 ✔ Hot Model With Sex...
 
Independent Sonagachi Escorts ✔ 9332606886✔ Full Night With Room Online Booki...
Independent Sonagachi Escorts ✔ 9332606886✔ Full Night With Room Online Booki...Independent Sonagachi Escorts ✔ 9332606886✔ Full Night With Room Online Booki...
Independent Sonagachi Escorts ✔ 9332606886✔ Full Night With Room Online Booki...
 
Call Girls New Ashok Nagar Delhi WhatsApp Number 9711199171
Call Girls New Ashok Nagar Delhi WhatsApp Number 9711199171Call Girls New Ashok Nagar Delhi WhatsApp Number 9711199171
Call Girls New Ashok Nagar Delhi WhatsApp Number 9711199171
 
Behala ( Call Girls ) Kolkata ✔ 6297143586 ✔ Hot Model With Sexy Bhabi Ready ...
Behala ( Call Girls ) Kolkata ✔ 6297143586 ✔ Hot Model With Sexy Bhabi Ready ...Behala ( Call Girls ) Kolkata ✔ 6297143586 ✔ Hot Model With Sexy Bhabi Ready ...
Behala ( Call Girls ) Kolkata ✔ 6297143586 ✔ Hot Model With Sexy Bhabi Ready ...
 
Goa Call Girls 9316020077 Call Girls In Goa By Russian Call Girl in goa
Goa Call Girls 9316020077 Call Girls  In Goa By Russian Call Girl in goaGoa Call Girls 9316020077 Call Girls  In Goa By Russian Call Girl in goa
Goa Call Girls 9316020077 Call Girls In Goa By Russian Call Girl in goa
 
Independent Joka Escorts ✔ 8250192130 ✔ Full Night With Room Online Booking 2...
Independent Joka Escorts ✔ 8250192130 ✔ Full Night With Room Online Booking 2...Independent Joka Escorts ✔ 8250192130 ✔ Full Night With Room Online Booking 2...
Independent Joka Escorts ✔ 8250192130 ✔ Full Night With Room Online Booking 2...
 
CHEAP Call Girls in Malviya Nagar, (-DELHI )🔝 9953056974🔝(=)/CALL GIRLS SERVICE
CHEAP Call Girls in  Malviya Nagar, (-DELHI )🔝 9953056974🔝(=)/CALL GIRLS SERVICECHEAP Call Girls in  Malviya Nagar, (-DELHI )🔝 9953056974🔝(=)/CALL GIRLS SERVICE
CHEAP Call Girls in Malviya Nagar, (-DELHI )🔝 9953056974🔝(=)/CALL GIRLS SERVICE
 
Independent Hatiara Escorts ✔ 9332606886✔ Full Night With Room Online Booking...
Independent Hatiara Escorts ✔ 9332606886✔ Full Night With Room Online Booking...Independent Hatiara Escorts ✔ 9332606886✔ Full Night With Room Online Booking...
Independent Hatiara Escorts ✔ 9332606886✔ Full Night With Room Online Booking...
 
Call Girls Agency In Goa 💚 9316020077 💚 Call Girl Goa By Russian Call Girl ...
Call Girls  Agency In Goa  💚 9316020077 💚 Call Girl Goa By Russian Call Girl ...Call Girls  Agency In Goa  💚 9316020077 💚 Call Girl Goa By Russian Call Girl ...
Call Girls Agency In Goa 💚 9316020077 💚 Call Girl Goa By Russian Call Girl ...
 
👙 Kolkata Call Girls Sonagachi 💫💫7001035870 Model escorts Service
👙  Kolkata Call Girls Sonagachi 💫💫7001035870 Model escorts Service👙  Kolkata Call Girls Sonagachi 💫💫7001035870 Model escorts Service
👙 Kolkata Call Girls Sonagachi 💫💫7001035870 Model escorts Service
 
Top Rated Kolkata Call Girls Khardah ⟟ 6297143586 ⟟ Call Me For Genuine Sex S...
Top Rated Kolkata Call Girls Khardah ⟟ 6297143586 ⟟ Call Me For Genuine Sex S...Top Rated Kolkata Call Girls Khardah ⟟ 6297143586 ⟟ Call Me For Genuine Sex S...
Top Rated Kolkata Call Girls Khardah ⟟ 6297143586 ⟟ Call Me For Genuine Sex S...
 
👙 Kolkata Call Girls Park Circus 💫💫7001035870 Model escorts Service
👙  Kolkata Call Girls Park Circus 💫💫7001035870 Model escorts Service👙  Kolkata Call Girls Park Circus 💫💫7001035870 Model escorts Service
👙 Kolkata Call Girls Park Circus 💫💫7001035870 Model escorts Service
 
College Call Girls New Alipore - For 7001035870 Cheap & Best with original Ph...
College Call Girls New Alipore - For 7001035870 Cheap & Best with original Ph...College Call Girls New Alipore - For 7001035870 Cheap & Best with original Ph...
College Call Girls New Alipore - For 7001035870 Cheap & Best with original Ph...
 
Call Girl Nashik Saloni 7001305949 Independent Escort Service Nashik
Call Girl Nashik Saloni 7001305949 Independent Escort Service NashikCall Girl Nashik Saloni 7001305949 Independent Escort Service Nashik
Call Girl Nashik Saloni 7001305949 Independent Escort Service Nashik
 
Call Girls Chirag Delhi Delhi WhatsApp Number 9711199171
Call Girls Chirag Delhi Delhi WhatsApp Number 9711199171Call Girls Chirag Delhi Delhi WhatsApp Number 9711199171
Call Girls Chirag Delhi Delhi WhatsApp Number 9711199171
 
Model Call Girls In Pazhavanthangal WhatsApp Booking 7427069034 call girl ser...
Model Call Girls In Pazhavanthangal WhatsApp Booking 7427069034 call girl ser...Model Call Girls In Pazhavanthangal WhatsApp Booking 7427069034 call girl ser...
Model Call Girls In Pazhavanthangal WhatsApp Booking 7427069034 call girl ser...
 
𓀤Call On 6297143586 𓀤 Ultadanga Call Girls In All Kolkata 24/7 Provide Call W...
𓀤Call On 6297143586 𓀤 Ultadanga Call Girls In All Kolkata 24/7 Provide Call W...𓀤Call On 6297143586 𓀤 Ultadanga Call Girls In All Kolkata 24/7 Provide Call W...
𓀤Call On 6297143586 𓀤 Ultadanga Call Girls In All Kolkata 24/7 Provide Call W...
 
Desi Bhabhi Call Girls In Goa 💃 730 02 72 001💃desi Bhabhi Escort Goa
Desi Bhabhi Call Girls  In Goa  💃 730 02 72 001💃desi Bhabhi Escort GoaDesi Bhabhi Call Girls  In Goa  💃 730 02 72 001💃desi Bhabhi Escort Goa
Desi Bhabhi Call Girls In Goa 💃 730 02 72 001💃desi Bhabhi Escort Goa
 

Connected Home: Video Game Consoles as Entertainment Hubs

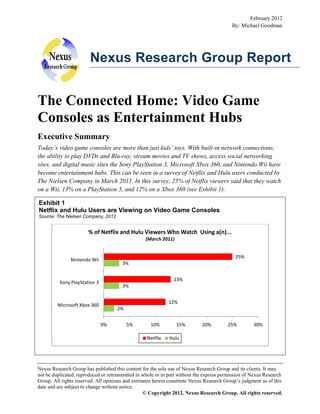
  • 1. February 2012 By: Michael Goodman Nexus Research Group Report The Connected Home: Video Game Consoles as Entertainment Hubs Executive Summary Today’s video game consoles are more than just kids’ toys. With built-in network connections, the ability to play DVDs and Blu-ray, stream movies and TV shows, access social networking sites, and digital music sites the Sony PlayStation 3, Microsoft Xbox 360, and Nintendo Wii have become entertainment hubs. This can be seen in a survey of Netflix and Hulu users conducted by The Nielsen Company in March 2011. In this survey, 25% of Netflix viewers said that they watch on a Wii, 13% on a PlayStation 3, and 12% on a Xbox 360 (see Exhibit 1). Exhibit 1 Netflix and Hulu Users are Viewing on Video Game Consoles Source: The Nielsen Company, 2012 % of Netflix and Hulu Viewers Who Watch Using a(n)... (March 2011) 25% Nintendo Wii 3% 13% Sony PlayStation 3 3% 12% Microsoft Xbox 360 2% 0% 5% 10% Netflix 15% 20% 25% 30% Hulu Nexus Research Group has published this content for the sole use of Nexus Research Group and its clients. It may not be duplicated, reproduced or retransmitted in whole or in part without the express permission of Nexus Research Group. All rights reserved. All opinions and estimates herein constitute Nexus Research Group’s judgment as of this date and are subject to change without notice. © Copyright 2012. Nexus Research Group. All rights reserved.
  • 2. The Connected Home: Video Game Consoles as Entertainment Hubs February 2012 Microsoft, Sony and Nintendo have taken different approaches to developing their consoles as home entertainment systems. Microsoft embraced digital distribution early on, while Sony has sought to straddle the line between physical distribution (e.g., Blu-ray) and digital distribution (e.g., PlayStation Movie Store). And Nintendo, in a departure from the past, is beginning to embrace the console as a home entertainment system with the integration of Netflix and the iBBC Player, but is taking a more conservative approach than either of its competitors. This Report, examines how consumers are using connected devices in their homes with an emphasis on video game consoles and the efforts of Microsoft, Sony, and Nintendo to position themselves as entertainment hubs in the digital living room of today and the future. 2 © Copyright 2012. Nexus Research Group. All rights reserved.
  • 3. The Connected Home: Video Game Consoles as Entertainment Hubs February 2012 Contents I. Introduction .......................................................................................................................................... 3 II. Impact of In-Home Connected Devices ................................................................................................ 4 III. Video Game Consoles as Home Entertainment Systems ...................................................................... 8 Console Activities ................................................................................................................................. 8 Time Spent by Activities ...................................................................................................................... 10 IV. Netflix and Hulu Come to the Console ............................................................................................... 15 VI. Conclusions and Recommendations ................................................................................................... 18 Conclusions......................................................................................................................................... 18 Recommendations ............................................................................................................................... 19 I. Introduction That consumption of on-demand movies, music and games is growing should come as no surprise to anyone. However, the speed at which demand has grown for these applications and services and the amount of bandwidth they consume is suprising. According to Sandvine (a network management company), real-time entertainment (applications and protocols that allow “on-demand” entertainment that is consumed as it arrives) as a percentage of fixed network traffic during the peak period (4pm 11pm) has grown at an average annual rate of 41% over the past three years. In 2009, real-time entertainment accounted for 29.5% of fixed network traffic in North America between 4pm and 11pm; by 2011 it had grown to over half (53.6%). Nor is this growth pattern entiely unique to North America. The Asia-Pacific region has seen peak period usage of real-time entertainment grow from 26.3% of fixed network traffic in 2009 to 49.0% in 2011; an average annual growth rate of 36.5%. Europe, however, has not seen as dramatic a rise. In 2009, peak period usage of real-time entertainment accounted for 30.4% of fixed network traffic. By 2011 it had grown to 33.2%; an average annual growth rate of 4.5%. Real-Time Entertainment: Applications and protocols that allow “on-demand” entertainment that is consumed (viewed or heard) as they arrive. This includes streamed or buffered audio (Pandora, Rdio) and video (RTSP, RTP, RTMP, Flash, MPEG), peercasting (PPStream, Octoshape), placeshifting (Slingbox), and specific streaming sites and services (Netflix, NCAA, Hulu, YouTube, Google Video, Spotify, BBC iPlayer). Secure Tunneling: Encrypted tunnels typically used for Virtual Private Networks and secure web transactions. Real-Time Communications: Applications and protocols that allow interactive chat, voice, and video communications. Bulk Entertainment: Entertainment that is acquired in bulk then consumed sometime after arrival such as movie download services. 3 © Copyright 2012. Nexus Research Group. All rights reserved.
  • 4. The Connected Home: Video Game Consoles as Entertainment Hubs February 2012 Exhibit 1 Fixed Network Traffic Composition During Peak Period (4pm - 11pm) Source: Sandvine Global Internet Phenomena Report, 2012 Top 5 Applications/Protocals During Peak Period (North America, Fixed Networks) 150.0% 100.0% 50.0% 9.8% 4.0% 15.1% 2.3% 29.5% 38.7% 0.0% 2009 Web Browsing P2P Filesharing Storage & Back-up Services Real-Time Communications Gaming 12.1% 3.1% 19.2% 2.7% 9.4% 3.8% 14.3% 42.7% 53.6% 20.2% 16.6% 2010 2.3% 2011 Real-Time Entertainment Secure Tunneling Bulk Entertainment Social Networking All Other Traffic Driving much of this growth is Netflix. With 21.6 million streaming accounts in 4Q 2011, Neftlix accounted for 32.7% of downstream Internet traffic during North American peak home Internet usage hours (4pm - 11pm). Think about what would happen to download speeds if the other roughly 100 million TV households in North America started using Netflix streaming. II. Impact of In-Home Connected Devices Driving much of this growth has been the influx of connected devices. According to Sandvine, 55% of real-time entertainment is consumed on the television (either directly to a connected TV or indirectly via a game console, Blu-ray player or connected media player), a mobile device or tablet. The remaining 45% is consumed on desktop and laptop computers, with some of this being forward to the TV. In 2009, the global installed base of in-home connected devices was nearly 64 million. Due to of more connected devices entering the market, connectivity becoming a basic feature on a greater number of devices, and services taking advantage of this connectivity, the installed base of in-home connected devices grew to 319 in 2011. By 2016, Nexus Research Group anticipates that the installed base of in-home connected devices will grow to 1.5 billion (see Exhibit 2 & 3). For more detail on the growth of in-home connected devices, see the Nexus Research Group report The Connected 4 © Copyright 2012. Nexus Research Group. All rights reserved.
  • 5. The Connected Home: Video Game Consoles as Entertainment Hubs February 2012 Home: Battle for Dominance in the Digital Living Room and corresponding 2012 In-Home Connected Device Forecast. In the early stages, North America has been leading the growth of in-home connected devices. In 2009, North America accounted for 40% of the global installed base of in-home connected devices followed by Western Europe with 31% and the Asia-Pacific region with a 22% share. By 2011, North America still accounted for the largest of the global installed base of in-home connected devices (35%) but the Asia-Pacific region was gaining and had tied Western Europe’s market share (27%). By 2016, driven by growing economies in China and India, and a seemingly insatiable demand for consumer electronics in Japan and South Korea the Asia Pacific regions share of in-home connected devices will grow to 31% in 2016, edging out North America (30%) and Western Europe (26%). Exhibit 2 By 2016 the Installed Base of In-Home Connected Devices will Reach 1.5 Billion Source: DFC Intelligence, 2012 Global Installed Base of In-Home Connected Devices 1,600 1,400 Units (in Millions) 1,200 1,000 800 600 400 200 0 2009 Connected TVs 2010 2011 Blu-ray Players 2012 2013 Video Game Consoles 2014 2015 2016 Connected Media Players 5 © Copyright 2012. Nexus Research Group. All rights reserved.
  • 6. The Connected Home: Video Game Consoles as Entertainment Hubs February 2012 Exhibit 3 By 2016 the Installed Base of In-Home Connected Devices will Reach 1.5 Billion Source: Nexus Research Group, 2012 Year Connected TVs Blu-Ray Players Video Game Consoles Connected Media Players Cumulative Total 2009 22.1 ----- 41.8 ----- 63.9 2010 62.2 23.1 84.1 2.0 171.3 2011 129.3 58.0 123.7 8.4 319.3 2012 207.7 107.2 162.3 15.7 493.0 2013 304.6 175.9 206.0 24.9 711.4 2014 427.0 255.9 250.1 36.0 969.0 2015 565.8 342.4 295.8 49.4 1,253.4 2016 724.4 432.7 339.7 64.6 1,561.4 Because of their installed base, likelihood of being connected, and partnerships with content owners, video game consoles have become important drivers of over-the-top content. Established installed base. In 2011, there were 146 million current generation consoles (PlayStation 3, Xbox 360 and Wii) in consumer’s homes worldwide (see Exhibit 4, & 5). By 2016, Nexus Research Group estimates that the global installed base of video game consoles will grow to 170 million. Users are taking advantage of connectivity. Not only is there a significant installed base of video game consoles but unlike other internet-ready devices, which may offer connectivity as a feature but are not actually connected to the internet, a significant number of video game consoles are connected. In 2011, 39% of the global installed base of video game consoles were connected, by 2016, this will grow to 44%. Even this however does not tell the complete story. Among the current generation of consoles, the Sony PlayStation 3 and Microsoft Xbox 360 have taken a much more aggressive approach to connectivity than the Nintendo Wii. While all three consoles are internet-ready Sony and Microsoft have pushed connected applications and content, such as online gaming, video, music and social media, much harder than Nintendo. As a result, the PlayStation 3 and Xbox 360 are more likely than the Wii to be connected. When it comes to connectivity, the Xbox 360 is king. In 2011, Nexus Research Group estimates that 57% of the Xbox 360 global installed base were connected to Xbox Live (Microsoft’s online service for the Xbox 360). In comparison, 47% of the PlayStation 3 were connected and only 23% of Wii’s were connected. Future generations of consoles are more likely to be connected. Nexus Research Group estimates that more than half (51%) of next generation consoles (Nintendo Wii U, Microsoft Xbox 720, and PlayStation 4) be physically connected, with this likely increasing in the later stages of their product lifecycle. 6 © Copyright 2012. Nexus Research Group. All rights reserved.
  • 7. The Connected Home: Video Game Consoles as Entertainment Hubs February 2012 Geography is also a contributing factor to console connectivity. In 2011, 65% of both the Xbox 360 and PlayStation 3 installed base was connected in North America. In comparison, 55% of the Western European Xbox 360 installed base was connected and 30% of the Japanese installed base. Among the PlayStation 3 installed base in Japan 40% was connected, while 30% of the Western European installed base was connected. Content options available on video game consoles is growing. Content owners and aggregrators are embracing the video game console as a distribution partner. In October 2011, Microsoft announced a significant expansion in the number of content providers available on the Xbox 360. Over 40 global media partners (representing various regions of the world) have been added include ESPN, EPIX, HBO, Hulu/Hulu Plus, LOVEFiLM, Telefónica España – Movistar Imagenio, AlloCiné, Crackle, CinemaNow, Bravo, HBO, BBC, Rogers on Demand and Telenovelas/Sports (Televisa). Exhibit 4 Installed Base of Connected Consoles Source: DFC Intelligence, 2012 Global Video Game Console Installed Base 200.0 180.0 160.0 Units (in Millions) 140.0 120.0 100.0 80.0 60.0 40.0 20.0 0.0 2010 2011 2012 Console Installed Base 2013 2014 2015 2016 Connected Consoles 7 © Copyright 2012. Nexus Research Group. All rights reserved.
  • 8. The Connected Home: Video Game Consoles as Entertainment Hubs February 2012 Exhibit 5 Installed Base of Connected Consoles Source: Nexus Research Group, 2012 Console Installed Base Year Connected Consoles % of Installed Base Connected 2010 136.6 48.9 36% 2011 146.0 57.1 39% 2012 157.3 63.5 40% 2013 167.6 71.1 42% 2014 176.1 75.0 43% 2015 181.1 78.3 43% 2016 185.4 81.0 44% III. Video Game Consoles as Home Entertainment Systems At its most basic level, the entertainment ecosystem is comprised of three primary components (for a more in-depth examination of the entertainment ecosystem see Nexus Research Group Report - The Connected Home: Battle for Dominance in the Digital Living Room): Content. This includes things such movies and TV shows, music, games, user generated content and apps. Distribution. Distribution is defined as how consumers access content and include electronic distribution over managed and unmanaged networks, broadcasting, and physical distribution through brick-n-mortar retailers. Device. Finally, require require some kind of device to consume the content on. This includes (but are not limited to) TVs, set-top boxes, video game consoles, PCs, smartphones and tablets. Console Activities Microsoft (via Xbox Live), Sony (via the PlayStation Network) and to a lesser degree Nintendo have built an ecosystem that includes all of the components required to be a viable distribution channel for movies and TV shows, music and games. The last requirement for success is consumer adoption and early results indicate that video game consoles are off to a strong start establishing themselves as home entertainment hubs. Not surprisingly, considering it is a gaming console after all, gaming it the top activity among console users age 13+, according to a survey conducted by The Nielsen Company in 2010 (see Exhibit 6). Detailed examination of usage patterns by console, however, yields unique user profiles. Eighty-seven percent of both Xbox 360 and Wii users age 13+ said they had played video games on the respective console, while 80% had done on the PlayStation 3. The vast majority of this game play 8 © Copyright 2012. Nexus Research Group. All rights reserved.
  • 9. The Connected Home: Video Game Consoles as Entertainment Hubs February 2012 was offline, but just over half (54%) of Xbox 360 users and 45% of PlayStation 3 users said that they play games online. In comparison, only 27% of Wii users age 13+ play games online. Given the emphasis both Sony and Microsoft place on online game play, these results are not surprising. After gaming, watching video is the next most popular activity on video game consoles. Video consumption comes in a number of forms on video game consoles, including streaming, downloading and watching physical media (DVDs and Blu-ray disks). Physical media (DVDs and Blu-ray disks) is the most popular format for video on both the PlayStation 3 and Xbox 360. According to The Nielsen Company, 72% of PlayStation 3 users age 13+ said they had watched a DVD or Blu-ray movies on the PlayStation 3 and 43% of Xbox 360 users age 13+ said they had watched a DVD or Blu-ray movieson the Xbox 360. (Please note that the Xbox 360 does not support Blu-ray and the Wii does not support video playback from either DVD or Blu-ray) After physical media, streaming is the next most popular method for watching video on a console. Twenty-six percent of Xbox 360 users age 13+ said they watch VOD/subscription streaming services (e.g., Netflix, Hulu Plus, LOVEFiLM) on their Xbox 360, followed by 23% of both PlayStaion 3 users and Wii users. Downloading is nearly as popular with 22% of Xbox 360 users age 13+ and 21% of PlayStation 3 users age 13+ saying that they had watched downloaded movies or TV shows on their respective console. (Please note that the Wii does not have a hard drive, negating the ability to download content) Exhibit 6 % of Users* Age 13+ Who Do Each Activity Source: The Nielsen Company, 2012 % of Users* Age 13+ Who Do Each Activity 87% 80% 87% 81% 72% 75% Play Video Games (Net) Play Video Games Offline 27% Play Video Games Online Watch DVDs/Blu-Ray 72% 43% 23% 23% 26% Watch VOD/Streaming Subscription Service Listen to CDs, MP3s or other Music (Online or … 8% Watch Downloaded Movies or TV Shows 0% 23% 23% 21% 22% 20% 27% 20% Use Internet for Browsing, Social Networking… Wii 46%54% 20% PlayStation 3 40% 60% 80% 100% Xbox 360 9 © Copyright 2012. Nexus Research Group. All rights reserved.
  • 10. The Connected Home: Video Game Consoles as Entertainment Hubs February 2012 * User is defined as someone who owns the console and uses at least one of these features (October 2010) Music, web browsing and social networking are also popular activities on video game consoles. Twenty-three percent of both Xbox 360 and PlayStation 3 users age 13+ listen to CDs, MP3s or other music (online or purchased) on their respective console. Music consumption is less popular on the Wii with only 8% of users reporting that they listen to music. Twenty-seven percent of PlayStation 3 users age 13+ use their console for web browsing, social networking and watching video (user generated) followed by 20% of Xbox 360 and Wii users. Time Spent by Activity Microsoft Xbox 360 Examining activities by time spent yields distinct usage patterns for each console. According to Nielsen, despite all the non-gaming content available on the Xbox 360, users age 13+ spend the majority of their console time (67%) playing games, up 8% YoY (see Exhibit 7). Xbox 360 users age 13+ are also far more likely to engage in online game play than users of the PlayStation 3 or Wii. Thirty-three percent of Xbox 360 users age 13+ console time was spent playing games online compared to 16% of PlayStation 3 users and 8% of Wii users. Exhibit 7 Share of Console Time Among Xbox 360 Users* Age 13+ Source: The Nielsen Company, 2012 Share of Console Time Among Xbox 360 Users* Age 13+ 34% 34% Play Video Games Offline 28% Play Video Games Online 10% Watch VOD/Streaming Services Watch DVDs/Blu-Ray 9% Watch Downloaded Movies/TV Shows All Other (Brows Web, Listen to Music, Other) 33% 14% 11% 6% 5% 11% 5% 0% 20% 2010 40% 2011 10 © Copyright 2012. Nexus Research Group. All rights reserved.
  • 11. The Connected Home: Video Game Consoles as Entertainment Hubs February 2012 * User is defined as someone who owns the console and uses at least one of these features (October 2010 and 2011) It should be noted that this data was collected prior to Microsoft’s redesign of the Xbox 360’s user interface which made it easier to discover movies, TV shows, music, and social networking apps as well as the expansion of these offerings which began in late 2011 and continues through 2012. According to Microsoft, prior to its latest update in the fall of 2011, 40% of all Xbox activity was non-game. This translated to an average of 30 hours of video consumption per month per Xbox. Overall, global video consumption on Xbox LIVE increased 140% from CY 2010 to CY 2011. Overall, time spent on non-gaming activities by Xbox 360 users fell by 13% YoY, from 38% of console time in October 2010 to 33% in October 2011. The majority of this decline was in the “Other” category that included listening to music, web browsing, social media and any other miscellaneous applications and services. In 2011, video (DVDs, streamed and downloads) accounted for 85% of Xbox 360 users age 13+ console time spent on non-gaming activities, up 19% YoY. Watching video-on-demand (VOD)/streaming services saw the most grow in the video category. Growing 40%, from 10% of console time spent in October 2010 to 14% of console time spent in October 2011. Given the improvements to the Xbox’s user interface and expanded content offerings it is likely that 2012 will see time spent on the non-gaming activities grow. Sony PlayStation 3 While the Xbox 360 appeals most strongly to hardcore gamers, the PlayStation 3, primarily due to the inclusion of Blu-ray, has a more diversified usage profile. According to the Nielsen study, gaming accounts for 54% of console time among PlayStation 3 users age 13+, up 10% YoY (see Exhibit 8). Whereas online and offline game play is evenly split among Xbox 360 users, PlayStation 3 users age 13+ show a clear preference for offline game play. In 2012 offline game play accounted for 38% of PlayStation 3 users age 13+ console time, up nearly 27% YoY. Online play declined nearly 16%, from 19% of console time spent in 2010 to 16% in 2011. Among PlayStation 3 users age 13+ console time spent on non-gaming activities fell nearly 10% YoY, from 51% of console time in October 2010 to 46% in October 2011. Like Xbox 360 users, the majority of this decline was in the “Other” category that included listening to music, web browsing, social media and any other miscellaneous applications and services. In 2011, video (DVDs, streamed and downloads) accounted for the vast majority (91%) of PlayStation 3 users age 13+ console time spent on non-gaming activities, up 16% YoY. Watching DVDs/Blu-ray is the most popular non-gaming activity among PlayStation users age 13+, accounting for 22% of their console game time, followed by watching video-on-demand (VOD)/streaming services (15%). The success of Blu-ray on the PlayStation 3 has been critical to Sony as the PlayStation 3 accounts for roughly two-thirds of the Blu-ray player installed base, however, streaming video is beginning to cut into Blu-ray viewing. According to the Nielsen study, console time spent watching DVDs/Blu- 11 © Copyright 2012. Nexus Research Group. All rights reserved.
  • 12. The Connected Home: Video Game Consoles as Entertainment Hubs February 2012 ray fell 19% YoY, from 27% of console time spent in October 2010 to 22% of console time spent in October 2011. This trend, if it continues, is troubling to both Sony (corporate) and the movie studios who hoped that Blu-ray would replace the roughly $20 billion in revenue that DVDs once produced. Exhibit 8 Share of Console Time Among PlayStation 3 Users* Age 13+ Source: The Nielsen Company, 2012 Share of Console Time Among PlayStation 3 Users* Age 13+ 30% Play Video Games Offline Play Video Games Online 16% 9% Watch VOD/Streaming Services 19% 15% Watch DVDs/Blu-Ray 22% Watch Downloaded Movies/TV Shows All Other (Brows Web, Listen to Music, Other) 38% 27% 4% 5% 11% 4% 0% 20% 2010 40% 2011 * User is defined as someone who owns the console and uses at least one of these features (October 2010 and 2011) Nintendo Wii While the majority of console time spent by Wii users age 13+ is playing offline games, streaming video usage is surprisingly strong as well. According to the Nielsen study, gaming accounted for 66% of Wii users age 13+ console time in October 2011. Of this, offline game play accounted for 87% of their time spent playing games. In October 2011, 8% of Wii users console game time was spent playing games online, a decline of 33% from 12% in October 2010. Among Wii users age 13+, console time spent on non-gaming activities grew 19% YoY, from 31% of console time in October 2010 to 37% in October 2011. Driving this growth is consumption of video. This is surprising since Nintendo did not design the Wii to be an entertainment hub. The Wii lacks the ability to playback DVDs or Blu-ray disks and does not have a hard drive that movies or TV show can be downloaded to. What you can do is watch video-on-demand (VOD)/streaming services, and this category grew 65% YoY, from 20% of Wii users console time in October 2010 to 33% in October 2011. 12 © Copyright 2012. Nexus Research Group. All rights reserved.
  • 13. The Connected Home: Video Game Consoles as Entertainment Hubs February 2012 Exhibit 9 Share of Console Time Among Wii Users* Age 13+ Source: The Nielsen Company, 2012 Share of Console Time Among Wii Users* Age 13+ 57% 55% Play Video Games Offline Play Video Games Online 12% 8% 20% Watch VOD/Streaming Services Watch DVDs/Blu-Ray Not Applicable Watch Downloaded Movies/TV Shows 33% Not Applicable All Other 4% 11% 0% 20% 2010 40% 60% 2011 * User is defined as someone who owns the console and uses at least one of these features (October 2010 and 2011) Clearly all three consoles have established themselves as viable alternative for movies and TV shows, what is surprising in the degrees of success. Despite aspiring to be an entertainment hub Microsoft still has a ways to go with only 28% of Xbox 360 users console time spent on video (see Exhibit 10). However, with its revamped user interface, significantly more content partners, and voice activated search through Kinect we are likely to see video consumption grow among Xbox 360 users. Though, video usage accounts for the smallest percentage of time among Xbox users, compared to the PlayStation 3 and Wii, it is the most profitable as most, if not all, video services require users to have a Gold subscription to Xbox Live ($59.99 annually). Plus the cost to download a movie or TV show or subscribe to a streaming service. Equally surprising is the strength of Nintendo in the video category. Though you cannot play DVDs or Blu-ray disks or download movies or TV show to the Wii, Wii users still spent a third (33%) of their console time watching video, 18% more than Xbox 360 users. Though Nintendo did not design the Wii to be an entertainment hub the addition of Netflix has clearly had a significant impact on the Wii. Also helping the Wii establish itself as a video platform is its position in the household. 13 © Copyright 2012. Nexus Research Group. All rights reserved.
  • 14. The Connected Home: Video Game Consoles as Entertainment Hubs February 2012 According to Nielsen, the Wii is the console most likely to be found in living / family room making it available to a wide range of family members. Exhibit 10 Share of Console Time Among PlayStation 3 Users* Age 13+ Source: The Nielsen Company, 2012 Share of Time Spent Watching Video Among Console Users* Age 13+ 60% 40% 5% 5% 9% 22% 14% 15% Xbox 360 20% PlayStation 3 33% 0% Watch VOD/Streaming Services Watch DVDs/Blu-Ray Wii Watch Downloaded Movies/TV Shows * User is defined as someone who owns the console and uses at least one of these features (October 2011) As a game console the PlayStation 3 seems to have lost something, particularly when compared to its predecessors, but as a home entertainment system the PlayStation is clearly hitting its stride with PlayStation 3 users spending nearly as much time with non-game activities, particularly video, as gaming. Overall, PlayStation 3 users spent 50% more console time watching video than Xbox users and 27% more than Wii users. 14 © Copyright 2012. Nexus Research Group. All rights reserved.
  • 15. The Connected Home: Video Game Consoles as Entertainment Hubs IV. February 2012 Netflix and Hulu Come to the Console As evidenced in the previous section video game console are emerging as important platforms for video distribution but what impact will they have on individual providers’ distribution plans. For at least one video provider, Netflix, video game consoles have emerged as an important distribution channel. According to a survey of 12,000 U.S. Hulu and Netflix users in March 2011 by the Nielsen Company, video game consoles were the top device for accessing Netflix. Fifty percent of Netflix subscribers surveyed said that they use a video game console to watch Netflix. This was followed by watching directly on a computer (42%) and watching on a computer connected to a TV (14%) (see Exhibit 11). In comparison, Hulu, though available on all three video game consoles (same as Netflix), saw only 8% of its user’s say that they watch on a game console. Hulu users are much more likely to watch directly on a computer (89%) or on a computer connected to a TV. Exhibit 11 How are Netflix and Hulu Users Watching? Source: The Nielsen Company, 2012 % of Netflix and Hulu Viewers Who Watch Using a(n)... (March 2011) Computer Directly 89% 42% 14%20% Computer Connected to TV 8% Video Game Console 50% 3% 5% 2% 3% Roku Box Mobile Phone 2%6% 2% 11% Connected TV Internet-Connected Blu-ray Player iPad 1% 3% TiVo w/Netflix Access 2% 1% 1% 1% 1% Apple TV Google TV 0% 10% 20% Hulu 30% 40% 50% 60% 70% 80% 90% 100% Netflix Now a large part of the discrepancy between Hulu and Netflix usage on video game consoles is attributable to differing business models. Netflix content is only available via subscription ($7.99 per 15 © Copyright 2012. Nexus Research Group. All rights reserved.
  • 16. The Connected Home: Video Game Consoles as Entertainment Hubs February 2012 month), however, subscribers can access movies and TV shows across multiple devices (video game consoles, connected TVs, iPads, connected media players, Blu-ray players, etc.). In contrast, Hulu has both a free ad-supported service and a more robust subscription service ($7.99 per month), however, only the subscription service is available via video game console. In addition to having different business model the way consumers use Netflix and Hulu differ as well. Netflix users are more well rounded; consuming both movies and television shows. According to Nielsen, 53% of Netflix users watch both movies and television shows, 36% watch movies only and 11% watch TV shows only (see Exhibit 12). In comparison, the vast majority of Hulu users (73%) only watch TV shows, 18% only watch movies while 9% watch both movies and TV shows. Exhibit 12 What are Netflix and Hulu Viewers Watching? Source: The Nielsen Company, 2012 % of Netflix and Hulu Viewers Who Watch... (March 2011) 36% Movies 18% 11% TV Shows 73% 53% Both Equaly 9% 0% 20% 40% Netflix 60% 80% Hulu The different usage profiles for Hulu and Netflix is significant as it indicates the need for video providers to differentiate in some way. Many of the video providers available on the Xbox Live (Netflix, Hulu Plus, Crackle, Vudu, CinemaNow) offer very similar content making it difficult for them to breakout from the pack. Particularly since Netflix, with its high brand recognition and large subscription base is available on all the consoles. Video providers offering movies and TV shows must find a way to carve out their own niche or be content with the crumbs left behind by larger providers like Netflix. 16 © Copyright 2012. Nexus Research Group. All rights reserved.
  • 17. The Connected Home: Video Game Consoles as Entertainment Hubs February 2012 Some ways to do this include the following. Use marketing promotions. In the UK, Blinkbox is collaborating with Domino’s Pizza to promote themed movie packages that provides customers with a 40% discount when they spend £25 or more at Domino’s Pizza. Combine physical and digital media. In the UK, Tesco (a grocery and general merchandise retailer) and Blinkbox (Tesco owns 80% of Blinkbox) rewards customers who buy physical DVDs and Blu-rays in-store with online access to the same movie on Blinkbox. Since rolling out this initiative, Blinkbox has seen its monthly online sales double. Focus on the high-end, early adopter. While not quite up to the quality of Blu-ray, Vudu's high-quality HDX format significantly outperforms standard DVDs, and at least comes close to the video quality of Blu-ray. In addition, Vudu was also the first online video service to offer 3D video, though not surprisingly the selection is limited. 17 © Copyright 2012. Nexus Research Group. All rights reserved.
  • 18. The Connected Home: Video Game Consoles as Entertainment Hubs VI. February 2012 Conclusions and Recommendations Conclusions While many in-home connected devices (such as connected TVs, Blu-ray players and connected media players) are entering the market none can claim to be having the same impact as video game consoles. This can be seen in Exhibit 1, which shows 25% of Netflix users watch on a Nintendo Wii. While competition from other devices is sure to increase in the next several years it is unlikely that video game consoles will recede into the background. Rather they will continue to add new capabilities (such as Xbox 360’s voice search) and additional content and grow. Additional insights include the following: Connected devices are driving the growth on real-time entertainment. According to Sandvine (a network management company), 55% of real-time entertainment is consumed on the television (either directly to a connected TV or indirectly via a game console, Blu-ray player or connected media player), a mobile device or tablet. The remaining 45% is consumed on desktop and laptop computers, with some of this being forward to the TV. The global installed base of video game consoles continues to grow. In 2011, there were 146 million current generation consoles (PlayStation 3, Xbox 360 and Wii) in consumer’s homes worldwide (see Exhibit 4, & 5). By 2016, Nexus Research Group estimates that the global installed base of video game consoles will grow to 170 million. Unlike other in-home connected devices, consumers are actually using the connectivity in video game consoles. While many devices are network capable, it does not mean that consumers are actually connecting them to their home network or use them to access online content. This however, is not the case with video game consoles. In 2011, 39% of the global installed base of video game consoles were connected, by 2016, this will grow to 44%. Xbox is the top console for connectivity. Nexus Research Group estimates that 57% of the Xbox 360 global installed base are connected to Xbox Live (Microsoft’s online service for the Xbox 360). In comparison, 47% of the PlayStation 3 are connected and only 23% of Wii’s are connected. Geography is a contributing factor to console connectivity. In 2011, 65% of both the Xbox 360 and PlayStation 3 installed base was connected in North America. In comparison, 55% of the Western European Xbox 360 installed base was connected and 30% of the Japanese installed base. Among the PlayStation 3 installed base in Japan 40% was connected, while 30% of the Western European installed base was connected. The number of content options available on video game consoles is growing. Content owners and aggregrators are embracing the video game console as a distribution partner. The PlayStation 3 is a true entertainment hub. More than any other console, PlayStation 3 users split their console time evenly between gaming and non-gaming activities. Gaming 18 © Copyright 2012. Nexus Research Group. All rights reserved.
  • 19. The Connected Home: Video Game Consoles as Entertainment Hubs February 2012 accounts for 54% of console time among PlayStation 3 users age 13+ while non-gaming activities account for 46% of their console time. Recent updates make the Xbox 360 a more formidable entertainment hub. While nongaming activities have lagged on the Xbox 360 (compared to the PlayStation 3 and Wii), improvements to its user interface and expanded content offerings make it likely that 2012 will see time spent on the non-gaming activities, particularly video, grow significantly. Streaming, particularly on game consoles is having a negative influence on Blu-ray. The success of Blu-ray on the PlayStation 3 has been critical to Sony as the PlayStation 3 accounts for roughly two-thirds of the Blu-ray installed base, however, streaming video is beginning to cut into Blu-ray viewing. This trend, if it continues, is troubling to both Sony (corporate) and movie studios who hoped that Blu-ray would replace the roughly $20 billion in revenue that DVDs once produced. Recommendations Discovery must improve. Regardless of the device if you don’t know the programming is available or can’t find it, you can’t view it. Currently it is difficult to discover movies and TV shows if you are not specifically searching for it. This must improve. Video providers must differentiate themselves from each other. Too a large extent, video providers are much of the same content. This gives Netflix with its large subscriber base and high brand awareness a large advantage. Whether it is through promotions, exclusive rights, unique business models, or niche offerings, just to name a few, video providers must find ways to differentiate themselves from the competition. Simplify the registration process. If the registration process is too complicated or requires too many steps consumers will just abandon the process. There are lots of other video services with similar content. For example, the registration for Crackle on the Xbox 360 is a two step process requiring you to register on both Xbox Live and online. Don’t forget about customer care. You never get a second chance to make a first impression and nowhere can you make a bigger impression than with excellent customer care. This should include email and instant help through chat and telephone support. In addition, companies should also publish a comprehensive FAQs and help page online. Combine physical and digital media. In the UK, Tesco (a grocery and general merchandise retailer) and Blinkbox (Tesco owns 80% of Blinkbox) rewards customers who buy physical DVDs and Blu-rays in-store with online access to the same movie on Blinkbox. Since rolling out this initiative, Blinkbox has seen its monthly online sales double. Offer movies that will appeal to the high-end, early adopter. While not quite up to the quality of Blu-ray, Vudu's high-quality HDX format significantly outperforms standard DVDs, and at least comes close to the video quality of Blu-ray. In addition, Vudu was also the first online video service to offer 3D video, though not surprisingly the selection is limited. 19 © Copyright 2012. Nexus Research Group. All rights reserved.
  • 20. The Connected Home: Video Game Consoles as Entertainment Hubs February 2012 20 © Copyright 2012. Nexus Research Group. All rights reserved.
  • 21. The Connected Home: Video Game Consoles as Entertainment Hubs February 2012 Conditions of Purchase Purchase of this multi-client study is on a nonexclusive basis. This study has not been commissioned or contracted for by any one person or organization. The information contained is confidential to the purchaser, and the purchaser agrees not to circulate or loan the study in whole or in part to: their subsidiaries or divisions, industry trade associations (if not the purchaser), the general public, the media, nor other parties not belonging to their company, agency or organization. Unauthorized reproduction and dissemination which is discovered by Nexus Research Group (the publisher) shall constitute grounds for legal prosecution and damages under U. S. copyright law. Nexus Research Group has made every attempt to verify the accuracy and completeness of information in this study from sources we believe to be reliable. It is understood, however, that our estimates, forecasts, opinions and recommendations represent the judgment of our analysts, based on the best information available at the time of publication. It is recommended that purchasers also consult other available business sources and not rely solely on this analysis as the basis for major strategic, financial, or management decisions. Nexus Research Group makes no warranty or representation, either expressed or implied, with respect to the information in this report. In no event will Nexus Research Group be liable for direct, indirect or consequential damages resulting from any defect or inaccuracy in this report, even if advised of the possibility of such damages. Information about specific companies is not intended to be a complete description, nor of their securities, nor is this study an offer to buy or sell such securities. Nexus Research Group’s liability, if any, shall not exceed the amount paid for this study. About This Report This report is part of a series of reports on Advertising and Games. The focus of this report is on the overall industry. Other reports have more detailed analysis of companies, business models, trends and breakouts of individual segments like advertising in and around console / PC games or social / casual games.. The reports in this Advertising and Games series, including this report, are based on a review of historical trends and opinions of leading members of the video game industry, including analysts, consultants, developers, publishers, retailers and consumers. This report has been prepared by utilizing a variety of primary and secondary research techniques including: telephone and personal interviews; analysis of market surveys, trade journals and company literature; extensive database searches; and Nexus Research Group’s original compilations and analysis. A Nexus Research Group report is more than a collection of raw statistics. We carefully scrutinize and analyze data from a variety of sources. The result is a comprehensive overview that puts facts and figures in context. Anyone who has attempted to collect figures for the online game industry knows that is difficult to obtain accurate statistics. We have studied market surveys, investment analyst reports and other sources of industry information. Our statistics and forecasts are based on the careful analysis of the available research, a great deal of which is contradictory. In many cases, we made assumptions based on the best available information. We feel our figures accurately reflect past and future market conditions. At the very least, these numbers track the industry trends and accurately estimate the market share of the various players. 21 © Copyright 2012. Nexus Research Group. All rights reserved.