El documento presenta los resultados del Indicador Trimestral de la Actividad Económica Estatal para el tercer trimestre de 2011. Las entidades con mayores crecimientos económicos fueron Colima, Sinaloa, Sonora, Querétaro y Tabasco. Las actividades primarias tuvieron avances en Sinaloa, Aguascalientes, Tamaulipas y Nuevo León, mientras que las secundarias crecieron en Colima, Quintana Roo, Sonora y Puebla.
Herramientas para mejorar la calidad del gasto público
•Con información del INEGI sobre Finanzas públicas municipales y estatales se realizó una comparación entre las partidas presupuestales de servicios personales vs. obra pública para todas las entidades de la república
Retos del proyecto
•Retos de apertura: cuando las autoridades estatales no aportan información presupuestal certera y verificable.
•Retos de clasificación: cuando la información presupuestal no está catalogada de acuerdo normas claras de semántica y contabilidad
El documento presenta la metodología utilizada para elaborar un Reglamento Municipal Tipo de Transparencia y Acceso a la Información Pública. Se describen 4 etapas: 1) lectura de reglamentos existentes para identificar similitudes y diferencias, 2) lectura de reglamentos de municipios capitales, 3) análisis comparativo de los contenidos, y 4) redacción del Reglamento Tipo. Finalmente, se incluye una introducción general y una propuesta de exposición de motivos para el Reglamento.
Este documento describe el Sistema Nacional de Coordinación Fiscal de México en 3 oraciones. Explica que el sistema coordina la recaudación y distribución de impuestos entre los distintos niveles de gobierno. Se creó en 1978 para simplificar el sistema tributario mediante la administración centralizada de los principales impuestos y la distribución de participaciones a los estados. El documento detalla las diferentes entidades que componen el sistema como la Comisión Permanente de Funcionarios Fiscales.
Este documento presenta información sobre los principales flujos migratorios en México. Los estados con mayores flujos migratorios son Durango, Zacatecas, Guanajuato, San Luis Potosí, Nayarit y Jalisco. La gráfica muestra los flujos migratorios entre estos estados y otros como Michoacán, Morelos, Chihuahua, Colima, Querétaro, Hidalgo y Tamaulipas. El documento analiza las causas de la migración en México, atribuyéndola principalmente a problemas de gobernabilidad
Este documento contiene la resolución de la Dirección General de Trabajo publicando la lista de días festivos para el año 2012 en España. Se enumeran los días festivos a nivel nacional y los que han sido designados por cada una de las 17 comunidades autónomas y las ciudades de Ceuta y Melilla.
Este documento es una guía de productos de luminarios de Schneider Electric para México. Presenta la historia y oferta de JUNO e incluye un índice de los diferentes tipos de luminarios como decorativos, empotrados, comerciales, de oficinas, industriales, exteriores y de señalización y emergencia. También describe la presencia de Schneider Electric en México a través de oficinas regionales, centros de servicio, distribuidores, plantas industriales y su cobertura a nivel nacional.
Este documento proporciona información general sobre la región Laguna en el estado de Coahuila, México. La región se compone de cinco municipios y se caracteriza por la agricultura y la industria, especialmente textiles y automotrices. Describe la ubicación, clima, población, infraestructura de transporte, parques industriales, principales empresas y servicios básicos de la región.
2024 State of Marketing Report – by HubspotMarius Sescu
https://www.hubspot.com/state-of-marketing
· Scaling relationships and proving ROI
· Social media is the place for search, sales, and service
· Authentic influencer partnerships fuel brand growth
· The strongest connections happen via call, click, chat, and camera.
· Time saved with AI leads to more creative work
· Seeking: A single source of truth
· TLDR; Get on social, try AI, and align your systems.
· More human marketing, powered by robots
ChatGPT is a revolutionary addition to the world since its introduction in 2022. A big shift in the sector of information gathering and processing happened because of this chatbot. What is the story of ChatGPT? How is the bot responding to prompts and generating contents? Swipe through these slides prepared by Expeed Software, a web development company regarding the development and technical intricacies of ChatGPT!
Product Design Trends in 2024 | Teenage EngineeringsPixeldarts
The realm of product design is a constantly changing environment where technology and style intersect. Every year introduces fresh challenges and exciting trends that mold the future of this captivating art form. In this piece, we delve into the significant trends set to influence the look and functionality of product design in the year 2024.
How Race, Age and Gender Shape Attitudes Towards Mental HealthThinkNow
Mental health has been in the news quite a bit lately. Dozens of U.S. states are currently suing Meta for contributing to the youth mental health crisis by inserting addictive features into their products, while the U.S. Surgeon General is touring the nation to bring awareness to the growing epidemic of loneliness and isolation. The country has endured periods of low national morale, such as in the 1970s when high inflation and the energy crisis worsened public sentiment following the Vietnam War. The current mood, however, feels different. Gallup recently reported that national mental health is at an all-time low, with few bright spots to lift spirits.
To better understand how Americans are feeling and their attitudes towards mental health in general, ThinkNow conducted a nationally representative quantitative survey of 1,500 respondents and found some interesting differences among ethnic, age and gender groups.
Technology
For example, 52% agree that technology and social media have a negative impact on mental health, but when broken out by race, 61% of Whites felt technology had a negative effect, and only 48% of Hispanics thought it did.
While technology has helped us keep in touch with friends and family in faraway places, it appears to have degraded our ability to connect in person. Staying connected online is a double-edged sword since the same news feed that brings us pictures of the grandkids and fluffy kittens also feeds us news about the wars in Israel and Ukraine, the dysfunction in Washington, the latest mass shooting and the climate crisis.
Hispanics may have a built-in defense against the isolation technology breeds, owing to their large, multigenerational households, strong social support systems, and tendency to use social media to stay connected with relatives abroad.
Age and Gender
When asked how individuals rate their mental health, men rate it higher than women by 11 percentage points, and Baby Boomers rank it highest at 83%, saying it’s good or excellent vs. 57% of Gen Z saying the same.
Gen Z spends the most amount of time on social media, so the notion that social media negatively affects mental health appears to be correlated. Unfortunately, Gen Z is also the generation that’s least comfortable discussing mental health concerns with healthcare professionals. Only 40% of them state they’re comfortable discussing their issues with a professional compared to 60% of Millennials and 65% of Boomers.
Race Affects Attitudes
As seen in previous research conducted by ThinkNow, Asian Americans lag other groups when it comes to awareness of mental health issues. Twenty-four percent of Asian Americans believe that having a mental health issue is a sign of weakness compared to the 16% average for all groups. Asians are also considerably less likely to be aware of mental health services in their communities (42% vs. 55%) and most likely to seek out information on social media (51% vs. 35%).
AI Trends in Creative Operations 2024 by Artwork Flow.pdfmarketingartwork
Creative operations teams expect increased AI use in 2024. Currently, over half of tasks are not AI-enabled, but this is expected to decrease in the coming year. ChatGPT is the most popular AI tool currently. Business leaders are more actively exploring AI benefits than individual contributors. Most respondents do not believe AI will impact workforce size in 2024. However, some inhibitions still exist around AI accuracy and lack of understanding. Creatives primarily want to use AI to save time on mundane tasks and boost productivity.
Organizational culture includes values, norms, systems, symbols, language, assumptions, beliefs, and habits that influence employee behaviors and how people interpret those behaviors. It is important because culture can help or hinder a company's success. Some key aspects of Netflix's culture that help it achieve results include hiring smartly so every position has stars, focusing on attitude over just aptitude, and having a strict policy against peacocks, whiners, and jerks.
PEPSICO Presentation to CAGNY Conference Feb 2024Neil Kimberley
PepsiCo provided a safe harbor statement noting that any forward-looking statements are based on currently available information and are subject to risks and uncertainties. It also provided information on non-GAAP measures and directing readers to its website for disclosure and reconciliation. The document then discussed PepsiCo's business overview, including that it is a global beverage and convenient food company with iconic brands, $91 billion in net revenue in 2023, and nearly $14 billion in core operating profit. It operates through a divisional structure with a focus on local consumers.
Content Methodology: A Best Practices Report (Webinar)contently
This document provides an overview of content methodology best practices. It defines content methodology as establishing objectives, KPIs, and a culture of continuous learning and iteration. An effective methodology focuses on connecting with audiences, creating optimal content, and optimizing processes. It also discusses why a methodology is needed due to the competitive landscape, proliferation of channels, and opportunities for improvement. Components of an effective methodology include defining objectives and KPIs, audience analysis, identifying opportunities, and evaluating resources. The document concludes with recommendations around creating a content plan, testing and optimizing content over 90 days.
How to Prepare For a Successful Job Search for 2024Albert Qian
The document provides guidance on preparing a job search for 2024. It discusses the state of the job market, focusing on growth in AI and healthcare but also continued layoffs. It recommends figuring out what you want to do by researching interests and skills, then conducting informational interviews. The job search should involve building a personal brand on LinkedIn, actively applying to jobs, tailoring resumes and interviews, maintaining job hunting as a habit, and continuing self-improvement. Once hired, the document advises setting new goals and keeping skills and networking active in case of future opportunities.
A report by thenetworkone and Kurio.
The contributing experts and agencies are (in an alphabetical order): Sylwia Rytel, Social Media Supervisor, 180heartbeats + JUNG v MATT (PL), Sharlene Jenner, Vice President - Director of Engagement Strategy, Abelson Taylor (USA), Alex Casanovas, Digital Director, Atrevia (ES), Dora Beilin, Senior Social Strategist, Barrett Hoffher (USA), Min Seo, Campaign Director, Brand New Agency (KR), Deshé M. Gully, Associate Strategist, Day One Agency (USA), Francesca Trevisan, Strategist, Different (IT), Trevor Crossman, CX and Digital Transformation Director; Olivia Hussey, Strategic Planner; Simi Srinarula, Social Media Manager, The Hallway (AUS), James Hebbert, Managing Director, Hylink (CN / UK), Mundy Álvarez, Planning Director; Pedro Rojas, Social Media Manager; Pancho González, CCO, Inbrax (CH), Oana Oprea, Head of Digital Planning, Jam Session Agency (RO), Amy Bottrill, Social Account Director, Launch (UK), Gaby Arriaga, Founder, Leonardo1452 (MX), Shantesh S Row, Creative Director, Liwa (UAE), Rajesh Mehta, Chief Strategy Officer; Dhruv Gaur, Digital Planning Lead; Leonie Mergulhao, Account Supervisor - Social Media & PR, Medulla (IN), Aurelija Plioplytė, Head of Digital & Social, Not Perfect (LI), Daiana Khaidargaliyeva, Account Manager, Osaka Labs (UK / USA), Stefanie Söhnchen, Vice President Digital, PIABO Communications (DE), Elisabeth Winiartati, Managing Consultant, Head of Global Integrated Communications; Lydia Aprina, Account Manager, Integrated Marketing and Communications; Nita Prabowo, Account Manager, Integrated Marketing and Communications; Okhi, Web Developer, PNTR Group (ID), Kei Obusan, Insights Director; Daffi Ranandi, Insights Manager, Radarr (SG), Gautam Reghunath, Co-founder & CEO, Talented (IN), Donagh Humphreys, Head of Social and Digital Innovation, THINKHOUSE (IRE), Sarah Yim, Strategy Director, Zulu Alpha Kilo (CA).
Trends In Paid Search: Navigating The Digital Landscape In 2024Search Engine Journal
The search marketing landscape is evolving rapidly with new technologies, and professionals, like you, rely on innovative paid search strategies to meet changing demands.
It’s important that you’re ready to implement new strategies in 2024.
Check this out and learn the top trends in paid search advertising that are expected to gain traction, so you can drive higher ROI more efficiently in 2024.
You’ll learn:
- The latest trends in AI and automation, and what this means for an evolving paid search ecosystem.
- New developments in privacy and data regulation.
- Emerging ad formats that are expected to make an impact next year.
Watch Sreekant Lanka from iQuanti and Irina Klein from OneMain Financial as they dive into the future of paid search and explore the trends, strategies, and technologies that will shape the search marketing landscape.
If you’re looking to assess your paid search strategy and design an industry-aligned plan for 2024, then this webinar is for you.
5 Public speaking tips from TED - Visualized summarySpeakerHub
From their humble beginnings in 1984, TED has grown into the world’s most powerful amplifier for speakers and thought-leaders to share their ideas. They have over 2,400 filmed talks (not including the 30,000+ TEDx videos) freely available online, and have hosted over 17,500 events around the world.
With over one billion views in a year, it’s no wonder that so many speakers are looking to TED for ideas on how to share their message more effectively.
The article “5 Public-Speaking Tips TED Gives Its Speakers”, by Carmine Gallo for Forbes, gives speakers five practical ways to connect with their audience, and effectively share their ideas on stage.
Whether you are gearing up to get on a TED stage yourself, or just want to master the skills that so many of their speakers possess, these tips and quotes from Chris Anderson, the TED Talks Curator, will encourage you to make the most impactful impression on your audience.
See the full article and more summaries like this on SpeakerHub here: https://speakerhub.com/blog/5-presentation-tips-ted-gives-its-speakers
See the original article on Forbes here:
http://www.forbes.com/forbes/welcome/?toURL=http://www.forbes.com/sites/carminegallo/2016/05/06/5-public-speaking-tips-ted-gives-its-speakers/&refURL=&referrer=#5c07a8221d9b
ChatGPT and the Future of Work - Clark Boyd Clark Boyd
Everyone is in agreement that ChatGPT (and other generative AI tools) will shape the future of work. Yet there is little consensus on exactly how, when, and to what extent this technology will change our world.
Businesses that extract maximum value from ChatGPT will use it as a collaborative tool for everything from brainstorming to technical maintenance.
For individuals, now is the time to pinpoint the skills the future professional will need to thrive in the AI age.
Check out this presentation to understand what ChatGPT is, how it will shape the future of work, and how you can prepare to take advantage.
The document provides career advice for getting into the tech field, including:
- Doing projects and internships in college to build a portfolio.
- Learning about different roles and technologies through industry research.
- Contributing to open source projects to build experience and network.
- Developing a personal brand through a website and social media presence.
- Networking through events, communities, and finding a mentor.
- Practicing interviews through mock interviews and whiteboarding coding questions.
Google's Just Not That Into You: Understanding Core Updates & Search IntentLily Ray
1. Core updates from Google periodically change how its algorithms assess and rank websites and pages. This can impact rankings through shifts in user intent, site quality issues being caught up to, world events influencing queries, and overhauls to search like the E-A-T framework.
2. There are many possible user intents beyond just transactional, navigational and informational. Identifying intent shifts is important during core updates. Sites may need to optimize for new intents through different content types and sections.
3. Responding effectively to core updates requires analyzing "before and after" data to understand changes, identifying new intents or page types, and ensuring content matches appropriate intents across video, images, knowledge graphs and more.
A brief introduction to DataScience with explaining of the concepts, algorithms, machine learning, supervised and unsupervised learning, clustering, statistics, data preprocessing, real-world applications etc.
It's part of a Data Science Corner Campaign where I will be discussing the fundamentals of DataScience, AIML, Statistics etc.
Time Management & Productivity - Best PracticesVit Horky
Here's my presentation on by proven best practices how to manage your work time effectively and how to improve your productivity. It includes practical tips and how to use tools such as Slack, Google Apps, Hubspot, Google Calendar, Gmail and others.
The six step guide to practical project managementMindGenius
The six step guide to practical project management
If you think managing projects is too difficult, think again.
We’ve stripped back project management processes to the
basics – to make it quicker and easier, without sacrificing
the vital ingredients for success.
“If you’re looking for some real-world guidance, then The Six Step Guide to Practical Project Management will help.”
Dr Andrew Makar, Tactical Project Management
Beginners Guide to TikTok for Search - Rachel Pearson - We are Tilt __ Bright...
Actividad económica estatal
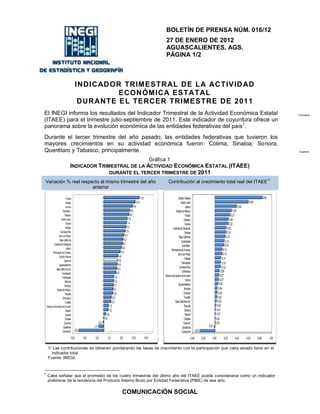
1. BOLETÍN DE PRENSA NÚM. 016/12
27 DE ENERO DE 2012
AGUASCALIENTES, AGS.
PÁGINA 1/2
INDIC AD OR TRIMES TR AL D E LA AC TIVID AD
ECON ÓMIC A ES TATAL
DUR ANTE E L TE RCER TRIMES TRE DE 2011
El INEGI informa los resultados del Indicador Trimestral de la Actividad Económica Estatal Formatos
(ITAEE) para el trimestre julio-septiembre de 2011. Este indicador de coyuntura ofrece un
panorama sobre la evolución económica de las entidades federativas del país 1.
Durante el tercer trimestre del año pasado, las entidades federativas que tuvieron los
mayores crecimientos en su actividad económica fueron: Colima, Sinaloa, Sonora,
Querétaro y Tabasco, principalmente. Cuadros
Gráfica 1
INDICADOR TRIMESTRAL DE LA ACTIVIDAD ECONÓMICA ESTATAL (ITAEE)
DURANTE EL TERCER TRIMESTRE DE 2011
1/
Variación % real respecto al mismo trimestre del año Contribución al crecimiento total real del ITAEE
anterior
Colima 11.6 Distrito Federal 0.84
Sinaloa 10.3 Nuevo León 0.59
Sonora 9.4 Jalisco 0.38
Querétaro 8.5 Estado de México 0.29
Tabasco 8.2 Puebla 0.27
Nuevo León 7.6 Tabasco 0.24
Puebla 7.4 Sonora 0.23
Hidalgo 7.3 Coahuila de Zaragoza 0.20
Quintana Roo 7.0 Sinaloa 0.19
San Luis Potosí 6.5 Baja California 0.18
Baja California 6.3 Guanajuato 0.17
Coahuila de Zaragoza 6.1 Querétaro 0.16
Jalisco 5.8 0.13
Michoacán de Ocampo
Michoacán de Ocampo 5.4
San Luis Potosí 0.13
Distrito Federal 4.6
4.5
Hidalgo 0.11
Nacional
Tamaulipas 0.10
Aguascalientes 4.4
4.3 Quintana Roo 0.10
Baja California Sur
4.0 Chihuahua 0.08
Guanajuato
Tamaulipas 3.2 Veracruz de Ignacio de la Llave 0.07
Morelos 3.2 Colima 0.07
Durango 3.1 Aguascalientes 0.05
Estado de México 3.1 Morelos 0.04
Tlaxcala 2.9 Durango 0.04
Chihuahua 2.5 Yucatán 0.03
Yucatán 2.3 Baja California Sur 0.03
Veracruz de Ignacio de la Llave 1.5 Tlaxcala 0.02
Nayarit 1.5 Oaxaca 0.01
Oaxaca 0.6 Nayarit 0.01
Chiapas 0.0 Chiapas 0.00
Guerrero -0.2 Guerrero 0.00
Zacatecas -1.7 Zacatecas -0.01
Campeche -8.2 Campeche -0.27
-10.0 -6.0 -2.0 2.0 6.0 10.0 14.0 -0.40 -0.20 0.00 0.20 0.40 0.60 0.80 1.00
1/ Las contribuciones se obtienen ponderando las tasas de crecimiento con la participación que cada estado tiene en el
indicador total.
Fuente: INEGI.
1
Cabe señalar que el promedio de los cuatro trimestres del último año del ITAEE puede considerarse como un indicador
preliminar de la tendencia del Producto Interno Bruto por Entidad Federativa (PIBE) de ese año.
COMUNICACIÓN SOCIAL
2. BOLETÍN DE PRENSA NÚM. 016/12
27 DE ENERO DE 2012
AGUASCALIENTES, AGS.
PÁGINA 2/2
Por grupos de actividades económicas, en las Primarias destacaron los avances
registrados en Sinaloa, Aguascalientes, Tamaulipas, Nuevo León y en el Estado de
México, entre otros; en las Secundarias sobresalieron los incrementos en Colima, Quintana
Roo, Sonora, Puebla, Querétaro y el Distrito Federal, y en las Terciarias las alzas
reportadas en Sonora, Hidalgo, Nuevo León, Querétaro y Coahuila de Zaragoza,
fundamentalmente.
INDICADOR TRIMESTRAL DE LA ACTIVIDAD ECONÓMICA ESTATAL
AL TERCER TRIMESTRE DE 2011
(Variaciones % real respecto al mismo periodo del año anterior)
III Trimestre Ene-Sep
Estado
1
Total / Primarias Secundarias Terciarias Total1/
Total 4.5 8.3 3.4 4.8 4.0
Aguascalientes 4.4 25.2 1.7 4.8 3.8
Baja California 6.3 (-) 2.9 8.3 5.7 4.6
Baja California Sur 4.3 0.5 3.3 4.8 5.6
Campeche (-) 8.2 (-) 2.0 (-) 10.7 3.9 (-) 4.1
Coahuila de Zaragoza 6.1 3.3 6.2 6.4 6.8
Colima 11.6 2.6 29.0 5.2 11.0
Chiapas 0.0 10.0 (-) 12.1 4.4 3.9
Chihuahua 2.5 11.3 (-) 0.6 3.2 1.9
Distrito Federal 4.6 (-) 0.9 11.1 3.8 4.1
Durango 3.1 3.6 4.6 2.9 3.3
Guanajuato 4.0 (-) 0.5 4.1 4.1 5.0
Guerrero (-) 0.2 0.7 (-) 2.9 0.4 0.8
Hidalgo 7.3 1.6 8.5 6.9 4.9
Jalisco 5.8 3.9 6.7 5.5 5.2
Estado de México 3.1 12.3 (-) 2.3 6.0 4.1
Michoacán de Ocampo 5.4 10.7 4.2 4.9 4.2
Morelos 3.2 4.3 (-) 0.1 5.2 4.1
Nayarit 1.5 (-) 3.9 (-) 1.3 3.3 2.2
Nuevo León 7.6 21.2 9.0 6.9 7.1
Oaxaca 0.6 4.8 (-) 2.7 1.3 1.5
Puebla 7.4 5.6 12.6 4.2 7.1
Querétaro 8.5 0.3 11.9 6.8 8.3
Quintana Roo 7.0 (-) 7.4 22.1 5.6 5.3
San Luis Potosí 6.5 2.5 8.8 5.3 5.5
Sinaloa 10.3 83.6 (-) 0.9 6.0 (-) 1.6
Sonora 9.4 6.3 12.6 8.1 6.8
Tabasco 8.2 0.2 9.5 6.1 4.7
Tamaulipas 3.2 22.8 (-) 1.4 5.1 1.5
Tlaxcala 2.9 (-) 7.2 2.1 3.9 3.4
Veracruz de Ignacio de la Llave 1.5 1.4 (-) 1.8 3.8 1.3
Yucatán 2.3 6.6 (-) 5.6 4.8 2.4
Zacatecas (-) 1.7 (-) 6.3 (-) 7.3 2.7 (-) 0.5
1/ Incluye los Servicios de Intermediación Financiera Medidos Indirectamente (SIFMI).
Fuente: INEGI.
Se anexa Nota Técnica
COMUNICACIÓN SOCIAL
3. NOTA TÉ CNIC A
INDIC AD OR TRIMES TR AL D E LA AC TIVID AD
ECON ÓMIC A ES TATAL
D UR A NT E E L T E R C E R T R I ME S T R E D E 2 0 1 1
El INEGI informa los resultados del Indicador Trimestral de
la Actividad Económica Estatal (ITAEE) para el trimestre
julio-septiembre de 2011. Este indicador de coyuntura
ofrece un panorama sobre la evolución económica de las
entidades federativas del país2.
Durante el tercer trimestre del año pasado, las entidades
federativas que tuvieron los mayores crecimientos en su
actividad económica fueron: Colima, Sinaloa, Sonora,
Querétaro y Tabasco, principalmente.
Por grupos de actividades económicas, en las Primarias
destacaron los avances registrados en Sinaloa,
Aguascalientes, Tamaulipas, Nuevo León y en el Estado de
México, entre otros; en las Secundarias sobresalieron los
incrementos en Colima, Quintana Roo, Sonora, Puebla,
Querétaro y el Distrito Federal, y en las Terciarias las alzas
reportadas en Sonora, Hidalgo, Nuevo León, Querétaro y
Coahuila de Zaragoza, fundamentalmente.
ASPECTOS GENERALES
El Indicador Trimestral de la Actividad Económica Estatal (ITAEE) es un indicador
de coyuntura que ofrece un panorama de la evolución económica de las entidades
del país en el corto plazo.
Los resultados que aquí se presentan dan cuenta también de los tres grandes
grupos de actividades (Primarias, Secundarias y Terciarias) que se desarrollan en
las economías de los estados.
PRINCIPALES RESULTADOS
En el trimestre julio-septiembre de 2011, las entidades federativas que mostraron
los crecimientos anuales más importantes fueron Colima con 11.6%, Sinaloa
10.3%, Sonora 9.4%, Querétaro 8.5%, Tabasco 8.2%, Nuevo León 7.6%, Puebla
7.4% e Hidalgo 7.3 por ciento. Les siguieron Quintana Roo con un avance de 7%,
San Luis Potosí 6.5%, Baja California 6.3% y Coahuila de Zaragoza 6.1%, entre
otras. La actividad económica de Chiapas no presentó variación.
2
Cabe señalar que el promedio de los cuatro trimestres del último año del ITAEE puede considerarse como un indicador
preliminar de la tendencia del Producto Interno Bruto por Entidad Federativa (PIBE) de ese año.
COMUNICACIÓN SOCIAL
4. En cambio, el ITAEE disminuyó en Campeche en (-)8.2%, Zacatecas (-)1.7% y en
Guerrero el descenso fue de (-)0.2% en el tercer trimestre de 2011.
En el lapso de referencia el crecimiento del total nacional fue de 4.5% a tasa
anual. Las entidades que más aportaron al incremento total del ITAEE fueron el
Distrito Federal (producto del ascenso reportado en las Actividades Terciarias),
Nuevo León y Jalisco (derivado de las alzas observadas en las Secundarias y
Terciarias), el Estado de México (debido a los aumentos en las Primarias y
Terciarias) y en Puebla por el desempeño positivo registrado en las Secundarias.
Gráfica 1
INDICADOR TRIMESTRAL DE LA ACTIVIDAD ECONÓMICA ESTATAL (ITAEE)
DURANTE EL TERCER TRIMESTRE DE 2011
Variación % real respecto al mismo trimestre del año Contribución al crecimiento total real del ITAEE1/
anterior
Colima 11.6 Distrito Federal 0.84
Sinaloa 10.3 Nuevo León 0.59
Sonora 9.4 Jalisco 0.38
Querétaro 8.5 Estado de México 0.29
Tabasco 8.2 Puebla 0.27
Nuevo León 7.6 Tabasco 0.24
Puebla 7.4 Sonora 0.23
Hidalgo 7.3 Coahuila de Zaragoza 0.20
Quintana Roo 7.0 Sinaloa 0.19
San Luis Potosí 6.5 Baja California 0.18
Baja California 6.3 Guanajuato 0.17
Coahuila de Zaragoza 6.1 Querétaro 0.16
Jalisco 5.8 0.13
Michoacán de Ocampo
Michoacán de Ocampo 5.4
San Luis Potosí 0.13
Distrito Federal 4.6
4.5
Hidalgo 0.11
Nacional
Tamaulipas 0.10
Aguascalientes 4.4
4.3 Quintana Roo 0.10
Baja California Sur
4.0 Chihuahua 0.08
Guanajuato
Tamaulipas 3.2 Veracruz de Ignacio de la Llave 0.07
Morelos 3.2 Colima 0.07
Durango 3.1 Aguascalientes 0.05
Estado de México 3.1 Morelos 0.04
Tlaxcala 2.9 Durango 0.04
Chihuahua 2.5 Yucatán 0.03
Yucatán 2.3 Baja California Sur 0.03
Veracruz de Ignacio de la Llave 1.5 Tlaxcala 0.02
Nayarit 1.5 Oaxaca 0.01
Oaxaca 0.6 Nayarit 0.01
Chiapas 0.0 Chiapas 0.00
Guerrero -0.2 Guerrero 0.00
Zacatecas -1.7 Zacatecas -0.01
Campeche -8.2 Campeche -0.27
-10.0 -6.0 -2.0 2.0 6.0 10.0 14.0 -0.40 -0.20 0.00 0.20 0.40 0.60 0.80 1.00
1/ Las contribuciones se obtienen ponderando las tasas de crecimiento con la participación que cada estado tiene en el
indicador total.
Fuente: INEGI.
COMUNICACIÓN SOCIAL
5. POR GRUPOS DE ACTIVIDADES
ACTIVIDADES PRIMARIAS
Las actividades de agricultura, ganadería, aprovechamiento forestal, pesca y caza
aumentaron 8.3% en el tercer trimestre del año pasado respecto a igual lapso de
2010. Las entidades que obtuvieron las mayores tasas en el trimestre de
referencia fueron Sinaloa con 83.6% (debido al incremento de la producción de
maíz, sorgo y oleaginosas, derivado del Programa de Resiembra realizado en la
zona por las heladas atípicas en febrero de ese año), Aguascalientes 25.2%,
Tamaulipas 22.8%, Nuevo León 21.2%, Estado de México 12.3%, Chihuahua
11.3%, Michoacán de Ocampo 10.7% y Chiapas con 10 por ciento.
Por el contrario, entre los estados que reportaron retrocesos en sus Actividades
Primarias se encuentran Quintana Roo con (-)7.4%, Tlaxcala (-)7.2%, Zacatecas
(-)6.3%, Nayarit (-)3.9%, Baja California (-)2.9%, Campeche (-)2%, Distrito
Federal (-)0.9% y Guanajuato con (-)0.5% a tasa anual.
Gráfica 2
ITAEE: ACTIVIDADES PRIMARIAS
DURANTE EL TERCER TRIMESTRE DE 2011
Variación % real respecto al mismo trimestre del año Contribución al crecimiento total real de las
anterior Actividades Primarias
Sinaloa 83.6 Sinaloa 3.30
Aguascalientes 25.2 Chihuahua 0.75
Tamaulipas 22.8 Michoacán de Ocampo 0.71
Nuevo León 21.2 Tamaulipas 0.52
Estado de México 12.3 Estado de México 0.49
Chihuahua 11.3 Jalisco 0.47
Michoacán de Ocampo 10.7 Aguascalientes 0.42
Chiapas 10.0 Chiapas 0.39
Nacional 8.3 Sonora 0.35
Yucatán 6.6 0.33
Nuevo León
Sonora 6.3 0.25
Puebla
Puebla 5.6
Durango 0.17
Oaxaca 4.8
Oaxaca 0.16
Morelos 4.3
Yucatán 0.12
Jalisco 3.9
Coahuila de Zaragoza 0.10
Durango 3.6
3.3 Veracruz de Ignacio de la Llave 0.09
Coahuila de Zaragoza
San Luis Potosí 0.05
Colima 2.6
San Luis Potosí 2.5 Morelos 0.05
Hidalgo 1.6 Hidalgo 0.03
Veracruz de Ignacio de la Llave 1.4 Colima 0.03
Guerrero 0.7 Guerrero 0.02
Baja California Sur 0.5 Baja California Sur 0.01
Querétaro 0.3 Querétaro 0.00
Tabasco 0.2 Tabasco 0.00
Guanajuato -0.5 Distrito Federal 0.00
Distrito Federal -0.9 Guanajuato -0.02
Campeche -2.0 Quintana Roo -0.02
Baja California -2.9 Campeche -0.02
Nayarit -3.9 Tlaxcala -0.04
Zacatecas -6.3 Baja California -0.07
Tlaxcala -7.2 -0.08
-7.4 Nayarit
Quintana Roo -0.25
Zacatecas
-20.0 -10.0 0.0 10.0 20.0 30.0 40.0 50.0 60.0 70.0 80.0 90.0 100.0 -1.0 0.0 1.0 2.0 3.0 4.0
Fuente: INEGI.
COMUNICACIÓN SOCIAL
6. Las entidades que contribuyeron en mayor medida al incremento de las
Actividades Primarias fueron: Sinaloa, Chihuahua, Michoacán de Ocampo,
Tamaulipas, Estado de México y Jalisco.
ACTIVIDADES SECUNDARIAS
Las entidades que mostraron los avances más significativos en las actividades
industriales (minería; electricidad, agua y suministro de gas por ductos al
consumidor final; construcción, e industrias manufactureras) durante el tercer
trimestre de 2011 respecto al mismo periodo de 2010 fueron Colima con 29%
(producto de la mayor construcción y ampliación de autopistas, carreteras y
caminos, y líneas de transmisión de energía eléctrica), Quintana Roo 22.1%,
Sonora y Puebla 12.6% cada una, Querétaro 11.9% y Distrito Federal con 11.1
por ciento.
Gráfica 3
ITAEE: ACTIVIDADES SECUNDARIAS
DURANTE EL TERCER TRIMESTRE DE 2011
Variación % real respecto al mismo trimestre del año Contribución al crecimiento total real de las
anterior Actividades Secundarias
Colima 29.0 Distrito Federal 0.86
Quintana Roo 22.1 Nuevo León 0.79
Sonora 12.6 Tabasco 0.56
Puebla 12.6 Puebla 0.52
Querétaro 11.9 Jalisco 0.40
Distrito Federal 11.1 Sonora 0.31
Tabasco 9.5 Coahuila de Zaragoza 0.28
Nuevo León 9.0 Querétaro 0.25
San Luis Potosí 8.8 Baja California 0.24
Hidalgo 8.5 San Luis Potosí 0.21
Baja California 8.3 Guanajuato 0.21
Jalisco 6.7 Hidalgo 0.15
Coahuila de Zaragoza 6.2 Colima 0.14
Durango 4.6 0.09
Quintana Roo
Michoacán de Ocampo 4.2 0.06
Michoacán de Ocampo
Guanajuato 4.1 0.05
Durango
Nacional 3.4
Aguascalientes 0.03
Baja California Sur 3.3
2.1 Baja California Sur 0.01
Tlaxcala
1.7 Tlaxcala 0.01
Aguascalientes
Morelos -0.1 Morelos 0.00
Chihuahua -0.6 Nayarit -0.01
Sinaloa -0.9 Sinaloa -0.01
-1.3 Chihuahua -0.02
Nayarit
Tamaulipas -1.4 Guerrero -0.02
Veracruz de Ignacio de la Llave -1.8 Oaxaca -0.03
Estado de México -2.3 Tamaulipas -0.05
Oaxaca -2.7 Zacatecas -0.06
Guerrero -2.9 Yucatán -0.06
Yucatán -5.6 Veracruz de Ignacio de la Llave -0.10
Zacatecas -7.3 Chiapas -0.22
Campeche -10.7 Estado de México -0.26
Chiapas -12.1 Campeche -0.92
-20.0 -10.0 0.0 10.0 20.0 30.0 40.0 -1.20 -1.00 -0.80 -0.60 -0.40 -0.20 0.00 0.20 0.40 0.60 0.80 1.00
Fuente: INEGI.
COMUNICACIÓN SOCIAL
7. En contraste, trece estados mostraron disminuciones anuales en este tipo de
actividades en el trimestre julio-septiembre de 2011, sobresalen las caídas en
Chiapas con (-)12.1%, Campeche (-)10.7%, Zacatecas (-)7.3% y en Yucatán con
(-)5.6 por ciento.
Por otra parte, entre los estados que más contribuyeron al incremento de las
Actividades Secundarias se encuentran el Distrito Federal, Nuevo León, Tabasco,
Puebla y Jalisco.
ACTIVIDADES TERCIARIAS
En las actividades relacionadas con los servicios (comercio; transportes, correos y
almacenamiento; información en medios masivos; inmobiliarios y alquiler de
bienes muebles e intangibles; profesionales, científicos y técnicos; alojamiento
temporal y de preparación de alimentos y bebidas, entre otros), las entidades
federativas donde más aumentaron fueron Sonora con una variación de 8.1%,
Hidalgo y Nuevo León 6.9% de manera individual, Querétaro 6.8%, Coahuila de
Zaragoza 6.4%, Tabasco 6.1%, Estado de México y Sinaloa 6% cada una, Baja
California 5.7% y Quintana Roo con un crecimiento de 5.6% en el tercer trimestre
de 2011 respecto a igual trimestre de 2010.
Los estados que reportaron los menores ascensos en este tipo de actividades
fueron Guerrero con una tasa anual de 0.4%, Oaxaca 1.3%, Zacatecas 2.7% y
Durango 2.9% en el periodo de referencia.
Las entidades que más contribuyeron al avance de las Actividades Terciarias
totales fueron el Distrito Federal, Estado de México, Nuevo León y Jalisco,
principalmente.
COMUNICACIÓN SOCIAL
8. Gráfica 4
ITAEE: ACTIVIDADES TERCIARIAS
DURANTE EL TERCER TRIMESTRE DE 2011
Variación % real respecto al mismo trimestre del año Contribución al crecimiento total real de las
anterior Actividades Terciarias
Sonora 8.1 Distrito Federal 0.97
Hidalgo 6.9 Estado de México 0.55
Nuevo León 6.9 Nuevo León 0.54
Querétaro 6.8 Jalisco 0.36
Coahuila de Zaragoza 6.4 Sonora 0.19
Tabasco 6.1 Baja California 0.16
Estado de México 6.0 Coahuila de Zaragoza 0.16
Sinaloa 6.0 Veracruz de Ignacio de la Llave 0.15
Baja California 5.7 Guanajuato 0.15
Quintana Roo 5.6 Tamaulipas 0.15
Jalisco 5.5 Puebla 0.14
San Luis Potosí 5.3 Sinaloa 0.13
Colima 5.2 Michoacán de Ocampo 0.13
Morelos 5.2
Querétaro 0.12
Tamaulipas 5.1
Quintana Roo 0.11
Michoacán de Ocampo 4.9
Chihuahua 0.09
Baja California Sur 4.8
4.8 Tabasco 0.09
Nacional
4.8 San Luis Potosí 0.09
Yucatán
Aguascalientes 4.8 Hidalgo 0.08
4.4 Chiapas 0.08
Chiapas
Puebla 4.2 Yucatán 0.08
4.1 Morelos 0.06
Guanajuato
Campeche 3.9 Aguascalientes 0.05
Tlaxcala 3.9 Baja California Sur 0.03
Distrito Federal 3.8 Campeche 0.03
Veracruz de Ignacio de la Llave 3.8 Durango 0.03
Nayarit 3.3 Colima 0.03
Chihuahua 3.2 Nayarit 0.02
Durango 2.9 Tlaxcala 0.02
Zacatecas 2.7 Oaxaca 0.02
Oaxaca 1.3 Zacatecas 0.02
Guerrero 0.4 Guerrero 0.01
0.0 2.0 4.0 6.0 8.0 10.0 0.00 0.20 0.40 0.60 0.80 1.00
Fuente: INEGI.
En el siguiente cuadro se presentan las variaciones anuales por grupo de
actividad económica al interior de cada entidad federativa, para el tercer trimestre
de 2011.
COMUNICACIÓN SOCIAL
9. INDICADOR TRIMESTRAL DE LA ACTIVIDAD ECONÓMICA ESTATAL
AL TERCER TRIMESTRE DE 2011
(Variaciones % real respecto al mismo periodo del año anterior)
III Trimestre Ene-Sep
Estado
1
Total / Primarias Secundarias Terciarias Total1/
Total 4.5 8.3 3.4 4.8 4.0
Aguascalientes 4.4 25.2 1.7 4.8 3.8
Baja California 6.3 (-) 2.9 8.3 5.7 4.6
Baja California Sur 4.3 0.5 3.3 4.8 5.6
Campeche (-) 8.2 (-) 2.0 (-) 10.7 3.9 (-) 4.1
Coahuila de Zaragoza 6.1 3.3 6.2 6.4 6.8
Colima 11.6 2.6 29.0 5.2 11.0
Chiapas 0.0 10.0 (-) 12.1 4.4 3.9
Chihuahua 2.5 11.3 (-) 0.6 3.2 1.9
Distrito Federal 4.6 (-) 0.9 11.1 3.8 4.1
Durango 3.1 3.6 4.6 2.9 3.3
Guanajuato 4.0 (-) 0.5 4.1 4.1 5.0
Guerrero (-) 0.2 0.7 (-) 2.9 0.4 0.8
Hidalgo 7.3 1.6 8.5 6.9 4.9
Jalisco 5.8 3.9 6.7 5.5 5.2
Estado de México 3.1 12.3 (-) 2.3 6.0 4.1
Michoacán de Ocampo 5.4 10.7 4.2 4.9 4.2
Morelos 3.2 4.3 (-) 0.1 5.2 4.1
Nayarit 1.5 (-) 3.9 (-) 1.3 3.3 2.2
Nuevo León 7.6 21.2 9.0 6.9 7.1
Oaxaca 0.6 4.8 (-) 2.7 1.3 1.5
Puebla 7.4 5.6 12.6 4.2 7.1
Querétaro 8.5 0.3 11.9 6.8 8.3
Quintana Roo 7.0 (-) 7.4 22.1 5.6 5.3
San Luis Potosí 6.5 2.5 8.8 5.3 5.5
Sinaloa 10.3 83.6 (-) 0.9 6.0 (-) 1.6
Sonora 9.4 6.3 12.6 8.1 6.8
Tabasco 8.2 0.2 9.5 6.1 4.7
Tamaulipas 3.2 22.8 (-) 1.4 5.1 1.5
Tlaxcala 2.9 (-) 7.2 2.1 3.9 3.4
Veracruz de Ignacio de la Llave 1.5 1.4 (-) 1.8 3.8 1.3
Yucatán 2.3 6.6 (-) 5.6 4.8 2.4
Zacatecas (-) 1.7 (-) 6.3 (-) 7.3 2.7 (-) 0.5
1/ Incluye los Servicios de Intermediación Financiera Medidos Indirectamente (SIFMI).
Fuente: INEGI.
COMUNICACIÓN SOCIAL
10. El ITAEE incorpora información preliminar de distintas actividades económicas
como las agropecuarias, industriales, comerciales y de servicios, por lo que debe
considerarse como un indicador de tendencia o dirección de la economía a nivel
estatal en el corto plazo.
NOTA METODOLÓGICA
El ITAEE, en términos generales, sigue los mismos principios y normas contables
del cálculo anual del PIB Estatal, brindando información oportuna sobre el
desarrollo de la situación económica de las entidades federativas del país.
Los cálculos estatales que efectúa el SCNM, tienen su base en agregaciones de la
información estadística básica del INEGI, tales como censos económicos y de
población, encuestas como las industriales, del comercio, construcción y empleo,
además de estadísticas como la minero-metalúrgica, y las asociadas al transporte;
asimismo, se aprovecharon los registros administrativos de empresas públicas y
privadas. De esta manera, el propio INEGI aporta un enorme acervo estadístico
para los cálculos del indicador.
Entre la información obtenida de fuentes externas al Instituto, se puede mencionar
la suministrada por la Secretaría de Agricultura, Ganadería, Desarrollo Rural,
Pesca y Alimentación (SAGARPA); Petróleos Mexicanos (PEMEX); La Comisión
Federal de Electricidad (CFE); Comisión Reguladora de Energía (CRE); Secretaría
de Energía (SENER); Comisión Nacional de Vivienda (CONAVI); Instituto
Mexicano del Seguro Social (IMSS); Secretaría de Comunicaciones y Transportes
(SCT); Comisión Nacional Bancaria y de Valores (CNBV); Secretaría de
Educación Pública (SEP); Instituto de Seguridad y Servicios Sociales de los
Trabajadores del Estado (ISSSTE); Secretaría de Turismo (SECTUR), y Cuentas
de la Hacienda Pública de los Gobiernos Locales (Estatales) y del Gobierno del
Distrito Federal.
El ordenamiento de las actividades económicas, se realizó de acuerdo al Sistema
de Clasificación Industrial de América del Norte (SCIAN) 2002, el cual fue
adoptado por los socios del Tratado de Libre Comercio (TLC) de América del
Norte: Canadá, Estados Unidos y México, con la finalidad de coadyuvar en la
armonización y comparabilidad de indicadores económicos en la región.
COMUNICACIÓN SOCIAL
11. La cobertura sectorial del indicador se estimó con la disponibilidad de información
trimestral que permitió la aplicación de las mismas metodologías de cálculo
desarrolladas en el PIB por Entidad Federativa, en cuyo caso se consideró que la
cobertura correspondía al 100%; por el contrario, cuando no fue posible compilar
información trimestral, teniendo así actividades con baja cobertura, fueron
estimadas a través de la implementación de indicadores de evolución alternativos,
mediante la aplicación de proyecciones numéricas, basadas ya sea en las
tendencias de datos pasados, en los datos anuales disponibles o bien por
analogía de las actividades que sí fueron medidas.
El proceso de alineación de los datos se realiza a través del proceso denominado
“Benchmarking”, el cual ajusta las series trimestrales a los datos anuales
disponibles, preservando al máximo las variaciones de los datos trimestrales; el
proceso se realiza a través de la aplicación de la técnica Denton.
Las series del ITAEE, podrán ser consultadas en el Banco de Información
Económica (BIE) de la página www.inegi.org.mx del Instituto en Internet.
******
COMUNICACIÓN SOCIAL