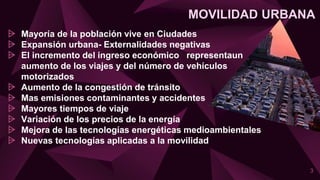
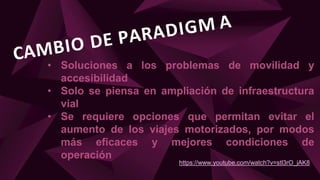
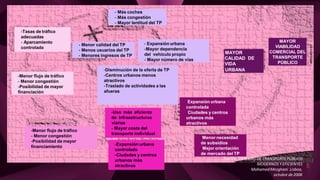
PROBLEMAS
DE TRÁNSITO
CAPÍTULO 2
CONTENIDO
1. Análisis de trazados viales urbanos y rurales
2. Factores que intervienen en problemas de tránsito
3. Bases para la solución
4. Educación y legislación vial
2
MOVILIDAD URBANA
⩥ Mayoría de la población vive en Ciudades
⩥ Expansión urbana- Externalidades negativas
⩥ El incremento del ingreso económico representaun
aumento de los viajes y del número de vehículos
motorizados
⩥ Aumento de la congestión de tránsito
⩥ Mas emisiones contaminantes y accidentes
⩥ Mayores tiempos de viaje
⩥ Variación de los precios de la energía
⩥ Mejora de las tecnologías energéticas medioambientales
⩥ Nuevas tecnologías aplicadas a la movilidad
3
• Soluciones a los problemas de movilidad y
accesibilidad
• Solo se piensa en ampliación de infraestructura
vial
• Se requiere opciones que permitan evitar el
aumento de los viajes motorizados, por modos
más eficaces y mejores condiciones de
operación
https://www.youtube.com/watch?v=stl3rO_jAK8
“
5
Fuente: SISTEMAS DE TRANSPORTEPÚBLICO
MODERNOS Y EFICIENTES
MohamedMezghani Lisboa,
octubre de2006
-Tasas de tráfico
adecuadas
- Aparcamiento
controlado
-Menor flujo de tráfico
- Menor congestión
-Posibilidad de mayor
financiación
-Menor flujo de tráfico
- Menor congestión
-Posibilidad de mayor
financiamiento
-Uso más eficiente
de infraestructuras
viarias
- Mayor coste del
transporte individual
-Menor necesidad
de subsidios
-Mejor orientación
de mercado del TP
-Expansión urbana
controlada
-Ciudades y centros
urbanos más
atractivos
MAYOR
VIABILIDAD
COMERCIAL DEL
TRANSPORTE
PÚBLICO
MAYOR
CALIDAD DE
VIDA
URBANA
- Más coches
- Más congestión
- Mayor lentitud del TP
- Expansión urbana
-Mayor dependencia
del vehículo propio
- Mayor número de vías
-Disminución de la oferta de TP
-Centros urbanos menos
atractivos
-Traslado de actividades a las
afueras
- Menor calidad del TP
- Menos usuarios del TP
- Menores ingresos de TP
-Expansión urbana
controlada
-Ciudades y centros
urbanos más
atractivos
Situacion actual en el tráfico de la ciudad de La Paz y El Alto
6
http://www.abc.gob.bo/?p=5767
FACTORES
7
* La Demanda Vehicular: Es la cantidad de
vehículos que requieren desplazarse por un sistema
vial cualquiera u oferta vial.
* La Oferta Vial: Es la cantidad máxima de vehículos
que finalmente pueden desplazarse o circular en
dicho espacio físico.
Si la DEMANDA VEHICULAR < OFERTA VIAL, las
condiciones son buenas en tránsito.
Si la DEMANDA VEHICULAR = OFERTA VIAL, el
tránsito es inestable y se originará posible
congestión.
Si la DEMANDA VEHICULAR > OFERTA VIAL,
tendremos colas vehiculares, detenciones
frecuentes y grandes demoras.
8
1. Diferente Tipología
Vehicular en la misma
Vialidad
Contar con variedad de
vehículos, el
comportamiento de cada
uno de ellos por sus
características
presentarán diferentes
velocidades, aceleración,
desplazamientos, entre
otros, que influyen en el
tránsito.
2. Superposición del tránsito
motorizado en vías
inadecuadas
Hay poco cambio en el trazo
urbano debido a que existen
calles angostas y de
pendientes pronunciadas.
No existen vías alternas
3. Ausencia de
Planificación del tránsito
Inadecuada política de
estacionamiento,
incoherencia de
localización de zonas
residenciales en
relación con el
funcionamiento de
zonas industriales o
comerciales, entre otros.
9
El gobierno central carece o no le da la
importancia a la educación vial del conductor, del
pasajero y del peatón, lo que vemos son
accidentes de tránsito por cual de ello.
10
11
12
13
14
A picture is
worth a
thousand words
A complex idea can be
conveyed with just a single
still image, namely making
it possible to absorb large
amounts of data quickly.
15
Want big impact?
Use big image.
16
Use diagrams to explain
your ideas
17
Vestibulum congue
tempus
Lorem ipsum dolor sit amet,
consectetur adipiscing elit, sed do
eiusmod tempor. Donec facilisis
lacus eget mauris.
3
Vestibulum congue
tempus
Lorem ipsum dolor sit amet,
consectetur adipiscing elit, sed do
eiusmod tempor. Donec facilisis
lacus eget mauris.
2
Vestibulum congue
tempus
Lorem ipsum dolor sit amet,
consectetur adipiscing elit, sed do
eiusmod tempor. Donec facilisis
lacus eget mauris.
1
And tables to compare
data
A B C
Yellow 10 20 7
Blue 30 15 10
Orange 5 24 16
18
Maps
our
office
19
Find more maps at slidescarnival.com/extra-free-resources-icons-and-maps
89,526,124$
That’s a lot of money
100%
Total success!
185,244 users
And a lot of users
20
Our process is easy
21
Lorem 3
Lorem ipsum dolor sit amet,
consectetur adipiscing elit.
Duis sit amet odio vel purus
bibendum luctus. Morbi iaculis
dapibus tristique. In hac
habitasse platea dictumst.
Mauris convallis quam at.
Morbi iaculis dapibus tristique.
Lorem 1
Lorem ipsum dolor sit amet,
consectetur adipiscing elit.
Duis sit amet odio vel purus
bibendum luctus. Morbi iaculis
dapibus tristique. In hac
habitasse platea dictumst.
Mauris convallis quam at.
Morbi iaculis dapibus tristique.
Lorem 2
Lorem ipsum dolor sit amet,
consectetur adipiscing elit.
Duis sit amet odio vel purus
bibendum luctus. Morbi iaculis
dapibus tristique. In hac
habitasse platea dictumst.
Mauris convallis quam at.
Morbi iaculis dapibus tristique.
Let’s review some
concepts
Yellow
Is the color of gold, butter
and ripe lemons. In the
spectrum of visible light,
yellow is found between
green and orange.
Blue
Is the colour of the clear sky
and the deep sea. It is
located between violet and
green on the optical
spectrum.
Red
Is the color of blood, and
because of this it has
historically been associated
with sacrifice, danger and
courage.
22
Yellow
Is the color of gold, butter
and ripe lemons. In the
spectrum of visible light,
yellow is found between
green and orange.
Blue
Is the colour of the clear sky
and the deep sea. It is
located between violet and
green on the optical
spectrum.
Red
Is the color of blood, and
because of this it has
historically been associated
with sacrifice, danger and
courage.
You can insert graphs from Excel or Google Sheets
23
Mobile
project
Show and explain
your web, app or
software projects
using these gadget
templates.
Place your screenshot here
24
Place your screenshot here
25
Tablet
project
Show and explain
your web, app or
software projects
using these gadget
templates.
Place your screenshot here
26
Desktop
project
Show and explain your
web, app or software
projects using these
gadget templates.
27
thank
s!
Any questions?
@username
user@mail.me
Credits
Special thanks to all the people who made and
released these awesome resources for free:
⩥ Presentation template by SlidesCarnival
⩥ Photographs by Unsplash
28
Presentation design
This presentation uses the following typographies:
⩥ Titles: Bebas Neue
⩥ Body copy: Saira SemiCondensed
Download for free at:
https://www.fontsquirrel.com/fonts/bebas-neue
https://www.fontsquirrel.com/fonts/saira
You don’t need to keep this slide in your presentation. It’s only here to serve you as a design
guide if you need to create new slides or download the fonts to edit the presentation in
PowerPoint®
29
SlidesCarnival icons are editable shapes.
This means that you can:
⩥ Resize them without losing quality.
⩥ Change fill color and opacity.
⩥ Change line color, width and style.
Isn’t that nice? :)
Examples:
30
Find more icons at slidescarnival.com/extra-
free-resources-icons-and-maps
Diagrams and infographics
31
✋👆👉👍👤👦👧👨👩👪💃🏃💑❤😂😉
😋😒😭👶😸🐟🍒🍔💣📌📖🔨🎃🎈🎨🏈
🏰🌏🔌🔑 and many more...
😉
32
You can also use any emoji as an icon!
And of course it resizes without losing quality.
How? Follow Google instructions
https://twitter.com/googledocs/status/730087240156643328
Free templates for all your presentation needs
Ready to use,
professional and
customizable
100% free for personal
or commercial use
Blow your audience
away with attractive
visuals
For PowerPoint and
Google Slides

PROBLEMAS EN LA INGENIERÍA DE TRANSITOTO

  • 1.
  • 2.
    CONTENIDO 1. Análisis detrazados viales urbanos y rurales 2. Factores que intervienen en problemas de tránsito 3. Bases para la solución 4. Educación y legislación vial 2
  • 3.
    MOVILIDAD URBANA ⩥ Mayoríade la población vive en Ciudades ⩥ Expansión urbana- Externalidades negativas ⩥ El incremento del ingreso económico representaun aumento de los viajes y del número de vehículos motorizados ⩥ Aumento de la congestión de tránsito ⩥ Mas emisiones contaminantes y accidentes ⩥ Mayores tiempos de viaje ⩥ Variación de los precios de la energía ⩥ Mejora de las tecnologías energéticas medioambientales ⩥ Nuevas tecnologías aplicadas a la movilidad 3
  • 4.
    • Soluciones alos problemas de movilidad y accesibilidad • Solo se piensa en ampliación de infraestructura vial • Se requiere opciones que permitan evitar el aumento de los viajes motorizados, por modos más eficaces y mejores condiciones de operación https://www.youtube.com/watch?v=stl3rO_jAK8
  • 5.
    “ 5 Fuente: SISTEMAS DETRANSPORTEPÚBLICO MODERNOS Y EFICIENTES MohamedMezghani Lisboa, octubre de2006 -Tasas de tráfico adecuadas - Aparcamiento controlado -Menor flujo de tráfico - Menor congestión -Posibilidad de mayor financiación -Menor flujo de tráfico - Menor congestión -Posibilidad de mayor financiamiento -Uso más eficiente de infraestructuras viarias - Mayor coste del transporte individual -Menor necesidad de subsidios -Mejor orientación de mercado del TP -Expansión urbana controlada -Ciudades y centros urbanos más atractivos MAYOR VIABILIDAD COMERCIAL DEL TRANSPORTE PÚBLICO MAYOR CALIDAD DE VIDA URBANA - Más coches - Más congestión - Mayor lentitud del TP - Expansión urbana -Mayor dependencia del vehículo propio - Mayor número de vías -Disminución de la oferta de TP -Centros urbanos menos atractivos -Traslado de actividades a las afueras - Menor calidad del TP - Menos usuarios del TP - Menores ingresos de TP -Expansión urbana controlada -Ciudades y centros urbanos más atractivos
  • 6.
    Situacion actual enel tráfico de la ciudad de La Paz y El Alto 6 http://www.abc.gob.bo/?p=5767
  • 7.
    FACTORES 7 * La DemandaVehicular: Es la cantidad de vehículos que requieren desplazarse por un sistema vial cualquiera u oferta vial. * La Oferta Vial: Es la cantidad máxima de vehículos que finalmente pueden desplazarse o circular en dicho espacio físico.
  • 8.
    Si la DEMANDAVEHICULAR < OFERTA VIAL, las condiciones son buenas en tránsito. Si la DEMANDA VEHICULAR = OFERTA VIAL, el tránsito es inestable y se originará posible congestión. Si la DEMANDA VEHICULAR > OFERTA VIAL, tendremos colas vehiculares, detenciones frecuentes y grandes demoras. 8
  • 9.
    1. Diferente Tipología Vehicularen la misma Vialidad Contar con variedad de vehículos, el comportamiento de cada uno de ellos por sus características presentarán diferentes velocidades, aceleración, desplazamientos, entre otros, que influyen en el tránsito. 2. Superposición del tránsito motorizado en vías inadecuadas Hay poco cambio en el trazo urbano debido a que existen calles angostas y de pendientes pronunciadas. No existen vías alternas 3. Ausencia de Planificación del tránsito Inadecuada política de estacionamiento, incoherencia de localización de zonas residenciales en relación con el funcionamiento de zonas industriales o comerciales, entre otros. 9
  • 10.
    El gobierno centralcarece o no le da la importancia a la educación vial del conductor, del pasajero y del peatón, lo que vemos son accidentes de tránsito por cual de ello. 10
  • 11.
  • 12.
  • 13.
  • 14.
  • 15.
    A picture is wortha thousand words A complex idea can be conveyed with just a single still image, namely making it possible to absorb large amounts of data quickly. 15
  • 16.
    Want big impact? Usebig image. 16
  • 17.
    Use diagrams toexplain your ideas 17 Vestibulum congue tempus Lorem ipsum dolor sit amet, consectetur adipiscing elit, sed do eiusmod tempor. Donec facilisis lacus eget mauris. 3 Vestibulum congue tempus Lorem ipsum dolor sit amet, consectetur adipiscing elit, sed do eiusmod tempor. Donec facilisis lacus eget mauris. 2 Vestibulum congue tempus Lorem ipsum dolor sit amet, consectetur adipiscing elit, sed do eiusmod tempor. Donec facilisis lacus eget mauris. 1
  • 18.
    And tables tocompare data A B C Yellow 10 20 7 Blue 30 15 10 Orange 5 24 16 18
  • 19.
    Maps our office 19 Find more mapsat slidescarnival.com/extra-free-resources-icons-and-maps
  • 20.
    89,526,124$ That’s a lotof money 100% Total success! 185,244 users And a lot of users 20
  • 21.
    Our process iseasy 21 Lorem 3 Lorem ipsum dolor sit amet, consectetur adipiscing elit. Duis sit amet odio vel purus bibendum luctus. Morbi iaculis dapibus tristique. In hac habitasse platea dictumst. Mauris convallis quam at. Morbi iaculis dapibus tristique. Lorem 1 Lorem ipsum dolor sit amet, consectetur adipiscing elit. Duis sit amet odio vel purus bibendum luctus. Morbi iaculis dapibus tristique. In hac habitasse platea dictumst. Mauris convallis quam at. Morbi iaculis dapibus tristique. Lorem 2 Lorem ipsum dolor sit amet, consectetur adipiscing elit. Duis sit amet odio vel purus bibendum luctus. Morbi iaculis dapibus tristique. In hac habitasse platea dictumst. Mauris convallis quam at. Morbi iaculis dapibus tristique.
  • 22.
    Let’s review some concepts Yellow Isthe color of gold, butter and ripe lemons. In the spectrum of visible light, yellow is found between green and orange. Blue Is the colour of the clear sky and the deep sea. It is located between violet and green on the optical spectrum. Red Is the color of blood, and because of this it has historically been associated with sacrifice, danger and courage. 22 Yellow Is the color of gold, butter and ripe lemons. In the spectrum of visible light, yellow is found between green and orange. Blue Is the colour of the clear sky and the deep sea. It is located between violet and green on the optical spectrum. Red Is the color of blood, and because of this it has historically been associated with sacrifice, danger and courage.
  • 23.
    You can insertgraphs from Excel or Google Sheets 23
  • 24.
    Mobile project Show and explain yourweb, app or software projects using these gadget templates. Place your screenshot here 24
  • 25.
    Place your screenshothere 25 Tablet project Show and explain your web, app or software projects using these gadget templates.
  • 26.
    Place your screenshothere 26 Desktop project Show and explain your web, app or software projects using these gadget templates.
  • 27.
  • 28.
    Credits Special thanks toall the people who made and released these awesome resources for free: ⩥ Presentation template by SlidesCarnival ⩥ Photographs by Unsplash 28
  • 29.
    Presentation design This presentationuses the following typographies: ⩥ Titles: Bebas Neue ⩥ Body copy: Saira SemiCondensed Download for free at: https://www.fontsquirrel.com/fonts/bebas-neue https://www.fontsquirrel.com/fonts/saira You don’t need to keep this slide in your presentation. It’s only here to serve you as a design guide if you need to create new slides or download the fonts to edit the presentation in PowerPoint® 29
  • 30.
    SlidesCarnival icons areeditable shapes. This means that you can: ⩥ Resize them without losing quality. ⩥ Change fill color and opacity. ⩥ Change line color, width and style. Isn’t that nice? :) Examples: 30 Find more icons at slidescarnival.com/extra- free-resources-icons-and-maps
  • 31.
  • 32.
    ✋👆👉👍👤👦👧👨👩👪💃🏃💑❤😂😉 😋😒😭👶😸🐟🍒🍔💣📌📖🔨🎃🎈🎨🏈 🏰🌏🔌🔑 and manymore... 😉 32 You can also use any emoji as an icon! And of course it resizes without losing quality. How? Follow Google instructions https://twitter.com/googledocs/status/730087240156643328
  • 33.
    Free templates forall your presentation needs Ready to use, professional and customizable 100% free for personal or commercial use Blow your audience away with attractive visuals For PowerPoint and Google Slides