SlideShare una empresa de Scribd logo
1 de 5
Descargar para leer sin conexión
Comparación estudios de opinión nacional                                                                                                                                                        Hoja 1


                                 Comparación de Estudios de Opinión Realizados a Nivel Nacional
                 # Personas encuestas      1,230   1,416   1,293     1,485   1,484   1,310    1,306     1,284    1,292     1,311    1,316    1,315     1,319    1,315    1,316     1,316     1,315
                        Error Muestral     2.8%    2.6%    2.7%      2.5%    2.5%    2.7%     2.7%      2.7%     2.7%      2.7%     2.7%     2.7%      2.7%     2.7%     2.7%      2.7%      2.7%

  En general, ¿cómo se entera usted de las noticias?
                                    ago 09    nov 09 mar 10        jul 10  nov 10  feb 11  jun 11     jul 11  oct 11     dic 11  ene 12 feb 12  mar 12 abr 12 may 12 4/06/12 18/06/12
                               Tv.    77.6%     76.8%  72.5%         79.5%  81.3%    79.3%   75.5%      74.9%  76.9%      77.9%   78.6%   78.7%  78.7%  73.6%  78.2%   79.6%    77.3%
                             Radio    10.9%     12.3%   7.6%          9.6%    9.2%   10.2%   13.1%      12.6%  11.5%      10.5%   10.0%   10.6%  10.1%  12.6%  11.2%    9.1%    10.4%
                        Periódicos     6.6%       5.5%  4.9%          6.1%    5.1%    5.8%    6.3%       7.9%    5.5%       6.0%   5.6%    4.8%   6.3%    6.8%  5.3%    4.4%     4.5%
                          Internet                                    2.4%    1.2%    1.3%    1.4%       1.5%    1.5%       1.4%   1.8%    1.9%   2.2%    1.8%  2.1%    2.7%     3.0%
                           Amigos      0.9%       1.5%  1.5%          0.8%    1.1%    0.9%    1.5%       0.7%    1.2%       0.8%   1.0%    0.8%   0.7%    1.4%  0.8%    0.8%     1.2%
                        Familiares     0.6%       0.8%  0.5%          0.5%    0.7%    0.2%    0.4%       0.5%    1.2%       0.5%   0.7%    0.6%   0.2%    1.0%  0.5%    0.5%     0.5%
                          Revistas     0.1%             0.3%          0.1%                                                  0.0%   0.1%    0.0%   0.0%    0.0%  0.0%    0.0%     0.0%
                             Otros     1.7%       1.3%  5.8%          0.3%    0.3%    0.3%    0.2%      0.5%     0.6%       0.5%   0.5%    0.9%   0.8%    0.6%  0.6%    1.1%     0.8%
                            NS/NC      1.7%       1.8%  6.9%          0.6%    1.1%    2.0%    1.7%      1.4%     1.5%       2.3%   1.7%    1.7%   1.1%    2.1%  1.2%    1.8%     2.4%

  ¿Cómo cree que será su situación económica este año, en comparación con el pasado?
                                    ago 09  nov 09 mar 10      jul 10   nov 10   feb 11  jun 11       jul 11  oct 11     dic 11  ene 12 feb 12  mar 12 abr 12 may 12 4/06/12 18/06/12
                             Mejor             4.7%      9.9%     8.8%   10.6%      9.3%   11.3%        12.1%  10.9%      14.0%   16.1%   14.7%  14.5%  14.5%  12.6%   12.6%    13.5%
                             Igual            23.9%     25.0%    39.1%   36.5%     39.9%   39.5%        36.7%  36.6%      35.4%   35.2%   32.0%  39.8%  37.7%  39.7%   40.9%    36.7%
                              Peor            70.6%     56.9%    51.1%   52.5%     48.7%   48.8%        49.5%  51.8%      49.8%   45.5%   50.9%  44.1%  45.9%  44.3%   43.4%    46.5%
                            NS/NC              0.8%      8.2%     0.9%     0.4%     2.1%    0.4%         1.7%    0.7%       0.8%   3.2%    2.4%   1.6%    1.9%  3.4%    3.0%     3.3%

  En una escala del 0 al 10, donde 0 significa que lo hace muy mal y 10 muy bien ¿Qué calificación le daría a Felipe Calderón como Presidente de la República?
                                     ago 09     nov 09 mar 10      jul 10   nov 10   feb 11     jun 11    jul 11     oct 11   dic 11   ene 12   feb 12    mar 12   abr 12 may 12 4/06/12 18/06/12
                                   0    6.6%       8.3%    11.0%      9.6%   10.8%      9.1%       8.7%      9.9%       9.4%     8.1%    7.6%       8.1%     8.2%     8.8%   8.5%   9.1%     9.8%
                                   1    0.4%       1.6%     1.1%      1.1%     1.1%     1.2%       0.7%      1.4%       1.7%     1.5%    1.0%       0.5%     0.9%     0.7%   1.1%   1.2%     0.6%
                                   2    1.6%       2.3%     2.7%      1.4%     1.9%     2.1%       1.5%      2.1%       1.7%     2.0%    1.9%       1.1%     1.4%     2.6%   2.1%   1.9%     1.2%
                                   3    2.9%       3.2%     3.6%      3.4%     2.8%     3.1%       1.9%      2.0%       4.1%     2.4%    2.5%       2.8%     3.8%     2.9%   3.9%   2.1%     2.0%
                                   4    3.5%       4.4%     4.0%      5.1%     3.5%     4.7%       3.1%      2.4%       3.8%     3.3%    3.3%       2.9%     2.4%     4.5%   5.2%   3.7%     4.5%
                                   5   15.6%     18.9%     16.7%     15.5%   20.3%     15.7%      18.1%     16.7%     15.2%    16.6%    12.8%     15.4%     16.3%   15.2%   16.2%  17.2%    17.5%
                                   6   13.2%     11.9%      9.0%     13.0%   11.8%     11.5%      11.0%      9.9%       9.2%     9.3%    8.9%     10.6%      8.9%     9.4%  10.4%  10.6%    10.8%
                                   7   14.2%     15.0%     11.5%     14.1%   15.2%     16.3%      14.4%     12.9%     12.5%    12.8%    13.7%     13.2%     14.3%   14.6%   14.4%  14.7%    14.5%
                                   8   20.6%     18.4%     17.6%     20.1%   19.3%     18.8%      19.7%     20.6%     21.9%    22.9%    22.1%     22.8%     24.3%   22.0%   20.8%  20.4%    17.9%
                                   9    8.1%       5.2%     4.9%      6.4%     4.6%     7.0%       7.6%      7.1%       6.9%     7.6%    9.3%       7.9%     8.9%     6.6%   7.1%   6.2%     7.1%
                                  10    8.2%       6.2%     5.9%      5.9%     5.5%     5.7%       8.9%      9.7%       9.7%     8.8%   11.5%     11.2%      7.9%     8.6%   7.1%   7.5%     7.6%
                              NS/NC     5.0%       4.5%    11.9%      4.4%     3.1%     4.8%       4.4%      5.4%       3.9%     4.7%    5.5%       3.4%     2.7%     4.2%   3.3%   5.6%     6.4%
                        Calificación       6.3       5.9      5.6       5.9      5.7      5.9        6.2       6.1        6.1      6.2      6.5       6.4      6.3      6.1    6.0    6.1      6.0

  Normalmente, ¿Con qué partido simpatiza usted mas?
                                   ago 09   nov 09 mar 10          jul 10  nov 10  feb 11  jun 11     jul 11  oct 11     dic 11  ene 12 feb 12  mar 12 abr 12 may 12 4/06/12 18/06/12
                             PAN     21.5%    21.4%  17.7%           20.3%  21.0%    22.1%   24.6%      19.3%  20.3%      21.2%   25.9%   24.6%  22.0%  21.5%  19.4%   19.9%    17.5%
                              PRI    29.0%    33.3%  25.1%           31.6%  30.9%    30.0%   29.2%      30.0%  32.4%      28.8%   27.5%   28.5%  27.6%  28.6%  29.3%   26.7%    28.4%
                             PRD     13.1%    13.0%  10.3%           11.6%  12.3%     9.8%   10.3%       9.7%  11.4%      12.1%   11.5%   12.5%  11.7%  12.1%  14.7%   16.3%    15.7%
                               PT     1.1%     1.1%   1.0%            1.5%    1.8%    1.6%    0.8%       1.0%    1.4%       1.1%   1.1%    0.8%   1.4%    0.7%  0.5%    1.2%     1.3%
          MC (antes Conv oct 11)      0.3%     0.4%   0.8%            0.5%    0.3%    0.7%    0.2%       0.7%    0.6%       0.5%   0.7%    0.6%   0.3%    0.7%  0.0%    0.2%     0.4%
                           PVEM       2.5%     1.7%   3.2%            0.9%    1.1%    1.6%    1.1%       1.6%    1.3%       1.4%   0.7%    1.1%   1.4%    1.1%  0.3%    1.3%     1.2%
                          PANAL       0.4%     0.5%   2.0%            0.3%            0.5%    0.9%       0.3%    0.2%       0.4%   5.1%    0.9%   0.1%    0.2%  1.1%    0.8%     0.5%
                        Ninguno      15.4%    25.3%  28.3%           29.2%  28.8%    30.0%   29.4%      31.2%  28.4%      29.9%    0.8%   27.5%  31.6%  29.8%  30.5%   29.8%    30.5%
                          NS/NC      16.6%     3.3%  11.6%            4.0%    3.8%    3.7%    3.6%       6.2%    4.1%       4.7%  27.4%    3.7%   4.0%    5.3%  4.2%    3.9%     4.5%
Comparación estudios de opinión nacional                                                                                                                                       Hoja 2

  ¿Por cuál partido nunca votaría?
                                       ago 09  nov 09 mar 10   jul 10  nov 10  feb 11  jun 11    jul 11  oct 11     dic 11  ene 12 feb 12  mar 12 abr 12 may 12 4/06/12 18/06/12
                               PAN       10.5%  19.3%  16.6%     13.5%  13.8%    12.1%   11.4%     13.7%  12.8%      16.6%   12.9%   14.5%  14.8%  17.6%  16.5%   14.3%    14.8%
                                PRI      12.9%  12.6%  14.1%     14.5%  16.0%    15.3%   14.4%     14.3%  16.9%      16.1%   18.8%   20.1%  18.1%  18.8%  22.3%   27.2%    23.8%
                               PRD       17.6%  21.5%  20.9%     18.6%  23.1%    19.5%   24.5%     18.9%  21.0%      20.8%   21.9%   22.4%  22.1%  20.2%  18.3%   18.6%    18.4%
                                 PT       8.5%    5.5%  4.6%      6.8%    5.1%    8.3%    5.0%      6.2%    6.0%       6.3%   4.6%    4.9%   5.5%    4.2%  3.3%    3.7%     2.3%
             MC (antes Conv oct 11)       4.6%    4.1%  2.9%      3.9%    3.9%    5.6%    5.7%      3.6%    2.9%       3.3%   4.0%    2.4%   2.6%    2.0%  1.8%    2.1%     1.6%
                              PVEM        2.8%    2.3%  8.4%      2.3%    2.0%    3.0%    2.8%      2.0%    2.7%       2.8%   3.7%    2.5%   3.9%    2.2%  2.6%    2.1%     2.1%
                            PANAL         2.7%    2.5%  2.1%      1.9%    2.6%    2.9%    2.6%      2.5%    1.5%       1.4%   1.7%    3.0%   3.4%    3.5%  4.0%    3.8%     3.8%
                          Ninguno        11.3%  15.0%  13.0%     19.7%  17.3%    16.7%   18.1%     18.8%  19.6%      17.7%   14.9%   14.1%  13.3%  14.1%  12.1%   11.4%    14.7%
                             NS/NC       29.2%  17.2%  17.5%     18.7%  16.2%    16.6%   15.5%     20.0%  16.6%      15.0%   17.4%   16.2%  16.3%  17.5%  19.0%   16.7%    18.6%

                                                                      Conocimiento e impresión de candidatos
  ¿Conoce usted a Andrés Manuel López Obrador?
                                   ago 09  nov 09 mar 10       jul 10  nov 10  feb 11  jun 11    jul 11  oct 11     dic 11  ene 12 feb 12  mar 12 abr 12 may 12 4/06/12 18/06/12
                      Si lo conoce   93.3%   92.8% 83.1%         90.6%  88.5%    89.9%   90.2%     85.1%  92.6%      94.7%   93.5%   93.2%  94.1%  95.2%  96.7%   96.7%    97.8%
                     No lo conoce     6.7%    7.1%  8.4%          8.1%  11.1%     9.3%    9.8%     13.3%    6.9%       5.0%   6.4%    6.8%   5.8%    4.7%  3.1%    3.2%     2.1%
                                NC    0.0%    0.1%  8.6%          1.3%    0.4%    0.8%    0.1%      1.6%    0.5%       0.3%   0.2%    0.1%   0.1%    0.1%  0.2%    0.1%     0.1%

  ¿Qué impresión tiene de Andrés Manuel López Obrador?
                                    ago 09  nov 09 mar 10      jul 10  nov 10  feb 11  jun 11    jul 11   oct 11    dic 11  ene 12 feb 12  mar 12 abr 12 may 12 4/06/12 18/06/12
                             Buena    28.5%   28.9%    24.1%     33.5%  28.0%    27.1%   26.8%             32.9%     36.4%   35.9%   34.6%  37.2%  35.0%  41.9%   42.4%    37.7%
                               Mala   34.3%   33.6%    36.1%     25.4%  30.5%    31.7%   31.5%             25.9%     23.7%   25.4%   26.6%  25.6%  25.1%  22.7%   19.3%    26.7%
                        Indiferente   28.1%   29.1%    30.7%     33.8%  33.6%    35.2%   35.4%             34.3%     32.8%   32.3%   30.5%  30.2%  32.0%  29.9%   31.9%    29.3%
                           No sabe     5.9%    5.9%     7.1%      3.8%    5.6%    4.1%    4.9%               4.7%      5.6%   5.5%    7.1%   6.3%    6.3%  4.6%    4.6%     5.1%
                             NS/NC     3.2%    2.4%     2.0%      3.6%    2.4%    1.9%    1.4%               2.2%      1.5%   0.8%    1.1%   0.6%    1.6%  1.0%    1.8%     1.2%

  ¿Nunca votaría por Andrés Manuel López Obrador?
                                   ago 09   nov 09 mar 10      jul 10  nov 10 feb 11  jun 11     jul 11   oct 11    dic 11 ene 12 feb 12  mar 12 abr 12 may 12 4/06/12 18/06/12
                     Nunca votaría   27.7%   24.5%  25.4%        22.5%  25.1%   29.0%   28.5%              22.5%     25.7%  32.3%   28.2%  25.8%  27.2%  19.3%   15.6%    21.2%
                            NS/NC    72.3%   75.5%  74.6%        77.5%  74.9%   71.0%   71.5%              77.5%     74.3%  67.7%   71.8%  74.2%  72.8%  80.7%   84.4%    78.8%

  ¿Conoce usted a Enrique Peña Nieto?
                                   ago 09  nov 09 mar 10       jul 10  nov 10  feb 11  jun 11    jul 11  oct 11     dic 11  ene 12 feb 12  mar 12 abr 12 may 12 4/06/12 18/06/12
                      Si lo conoce   77.1%  78.0%  74.0%         81.1%  82.1%    86.3%   82.6%     78.2%  85.9%      88.3%   88.7%   89.4%  91.1%  94.4%  97.9%   96.3%    98.3%
                     No lo conoce    22.9%  21.7%  24.4%         18.4%  17.9%    13.4%   17.3%     20.4%  13.7%      11.1%   11.2%   10.6%   8.9%    5.6%  2.1%    3.7%     1.7%
                                NC    0.0%    0.3%  1.6%          0.5%    0.0%    0.3%    0.1%      1.4%    0.4%       0.5%   0.1%    0.0%   0.1%    0.0%  0.1%    0.0%     0.0%

  ¿Qué impresión tiene de Enrique Peña Nieto?
                                    ago 09   nov 09 mar 10     jul 10  nov 10  feb 11  jun 11    jul 11   oct 11    dic 11  ene 12 feb 12  mar 12 abr 12 may 12 4/06/12 18/06/12
                             Buena    59.7%   54.8%  49.9%       47.8%  44.6%    43.9%   46.6%             50.0%     44.0%   47.9%   42.2%  45.3%  42.4%  35.9%   31.0%    32.5%
                               Mala    4.1%     7.2% 11.5%        9.1%  11.4%    10.2%    9.7%               8.9%    12.7%   15.7%   16.9%  17.5%  19.4%  24.8%   33.7%    28.6%
                        Indiferente   26.3%   29.0%  30.4%       34.7%  35.4%    37.9%   37.0%             34.3%     35.5%   28.6%   32.9%  30.3%  28.8%  32.4%   28.2%    31.8%
                           No sabe     7.5%     6.9%  7.5%        5.3%    7.2%    5.8%    6.2%               5.0%      6.4%   6.8%    7.0%   6.6%    7.9%  5.9%    5.3%     6.0%
                             NS/NC     2.4%     2.1%  0.6%        3.0%    1.4%    2.2%    0.6%               1.7%      1.4%   1.0%    1.0%   0.3%    1.5%  1.0%    1.8%     1.0%

  ¿Nunca votaría por Enrique Peña Nieto?
                                    ago 09  nov 09 mar 10      jul 10  nov 10  feb 11  jun 11    jul 11   oct 11    dic 11 ene 12 feb 12  mar 12 abr 12 may 12 4/06/12 18/06/12
                     Nunca votaría     5.5%    7.0%  9.5%         8.0%    9.1%   11.8%   11.8%               9.3%    13.7%  19.9%   19.9%  18.5%  19.0%  23.0%   27.2%    24.5%
                            NS/NC     94.5%  93.0%  90.5%        92.0%  90.9%    88.2%   88.2%             90.7%     86.3%  80.1%   80.1%  81.5%  81.0%  77.0%   72.8%    75.5%
Comparación estudios de opinión nacional                                                                                                                                                     Hoja 3

  ¿Conoce usted a Josefina Vázquez Mota?
                                    ago 09      nov 09   mar 10    jul 10    nov 10    feb 11    jun 11   jul 11   oct 11    dic 11  ene 12 feb 12  mar 12 abr 12 may 12 4/06/12 18/06/12
                       Si lo conoce                                                                                 46.7%     58.7%   72.2%   75.7%  76.7%  86.5%  92.0%   92.9%    95.4%
                      No lo conoce                                                                                  52.7%     40.7%   27.3%   24.2%  22.9%  13.3%   7.7%    6.9%     4.4%
                                 NC                                                                                   0.6%      0.6%   0.5%    0.1%   0.4%    0.2%  0.4%    0.2%     0.2%

  ¿Que opinión tiene de Josefina Vázquez Mota?
                                     ago 09  nov 09      mar 10    jul 10    nov 10    feb 11    jun 11   jul 11   oct 11    dic 11  ene 12 feb 12  mar 12 abr 12 may 12 4/06/12 18/06/12
                             Buena                                                                                  24.9%     24.8%   31.9%   35.0%  31.7%  34.3%  30.3%   28.4%    29.9%
                               Mala                                                                                 16.9%     16.6%   14.7%   16.5%  19.2%  22.1%  27.7%   26.5%    26.5%
                        Indiferente                                                                                 45.6%     47.1%   42.0%   36.7%  39.2%  33.0%  34.4%   37.2%    37.0%
                           No sabe                                                                                    8.6%      9.1%   9.9%    9.8%   9.2%    8.5%  6.4%    6.0%     5.2%
                             NS/NC                                                                                    4.0%      2.3%   1.5%    1.9%   0.7%    2.0%  1.2%    1.9%     1.5%

  ¿Nunca votaría por Josefina Vázquez Mota?
                                    ago 09      nov 09   mar 10    jul 10    nov 10    feb 11    jun 11   jul 11   oct 11    dic 11 ene 12 feb 12  mar 12 abr 12 may 12 4/06/12 18/06/12
                     Nunca votaría                                                                                  11.9%     21.7%  25.5%   23.0%  19.6%  22.4%  25.5%   18.7%    18.6%
                             NS/NC                                                                                  88.1%     78.3%  74.5%   77.0%  80.4%  77.6%  74.5%   81.3%    81.4%

  ¿Conoce usted a Gabriel Quadri de la Torre?
                                    ago 09    nov 09     mar 10    jul 10    nov 10    feb 11    jun 11   jul 11   oct 11    dic 11   ene 12   feb 12   mar 12 abr 12 may 12 4/06/12 18/06/12
                      Si lo conoce                                                                                                                       14.3%  34.9%  63.7%   69.0%    78.4%
                     No lo conoce                                                                                                                        84.8%  64.9%  35.8%   30.5%    20.9%
                                NC                                                                                                                        0.9%    0.2%  0.5%    0.5%     0.7%

  ¿Que opinión tiene de Gabriel Quadri de la Torre?
                                    ago 09     nov 09    mar 10    jul 10    nov 10    feb 11    jun 11   jul 11   oct 11    dic 11   ene 12   feb 12   mar 12 abr 12 may 12 4/06/12 18/06/12
                             Buena                                                                                                                        7.9%  12.6%  24.7%   18.6%    19.7%
                               Mala                                                                                                                      12.7%  20.9%  16.6%   17.5%    20.6%
                        Indiferente                                                                                                                      56.6%  49.2%  46.8%   50.6%    47.1%
                           No sabe                                                                                                                       20.1%  14.2%  10.3%   11.2%    11.3%
                             NS/NC                                                                                                                        2.6%    3.1%  1.7%    2.2%     1.3%

                                                                                ¿Nunca votaría por Gabriel Quadri de la Torre?
                                       ago 09   nov 09   mar 10    jul 10    nov 10  feb 11    jun 11    jul 11    oct 11    dic 11   ene 12   feb 12   mar 12 abr 12 may 12 4/06/12 18/06/12
                       Nunca votaría                                                                                                                     18.5%  28.5%  15.4%   19.8%    17.5%
                              NS/NC                                                                                                                      81.5%  71.5%  84.6%   80.2%    82.5%

                                                                                           Simulación de voto
  Si las elecciones fueran hoy, ¿por quién votaría para Presidente de la república en el 2012?
                                      ago 09   nov 09 mar 10        jul 10   nov 10     feb 11   jun 11   jul 11   oct 11    dic 11   ene 12   feb 12   mar 12 abr 12 may 12 4/06/12 18/06/12
        PAN – Josefina Vázquez Mota                                                                                                                      19.9%  22.2%  18.4%   19.3%    18.4%
    PRI – VERDE Enrique Peña Nieto                                                                                                                       36.7%  33.2%  29.5%   26.0%    26.4%
        PRD – PT – MC(antes Conv) –
                                                                                                                                                         21.6%   21.3%   24.1%   28.1%   27.8%
      Andrés Manuel López Obrador
        PANAL – Gabriel Quadri de la
                                                                                                                                                          0.8%    1.1%    4.1%    2.9%    2.5%
                               Torre
                            Ninguno                                                                                                                       8.5%    7.0%    7.3%    5.7%    6.8%
                            No sabe                                                                                                                      10.1%   12.6%   12.7%   13.7%   13.8%
                              NS/NC                                                                                                                       2.4%    2.7%    3.9%    4.3%    4.4%
Comparación estudios de opinión nacional                                                                                                                                                        Hoja 4

  Entre las siguientes personas, ¿Quién de ellos garantizaría un cambio verdadero para el país?
                                     ago 09    nov 09 mar 10       jul 10   nov 10    feb 11    jun 11    jul 11   oct 11   dic 11    ene 12 feb 12  mar 12   abr 12 may 12 4/06/12 18/06/12
       PRD – PT – MC(antes Conv) –
                                                                                                            18.8%    21.3%    23.4%    22.3%   22.1%  23.3%    21.4%   27.5%  28.4%    34.0%
      Andrés Manuel López Obrador
    PRI – VERDE Enrique Peña Nieto                                                                          28.3%    28.7%    26.9%    24.8%   23.1%  24.4%    23.7%   19.0%  18.4%    18.3%
       PAN – Josefina Vázquez Mota                                                                                    5.1%    10.5%    16.4%   17.8%  14.8%    17.4%   12.8%  14.3%    15.1%
       PANAL – Gabriel Quadri de la
                                                                                                                                                       0.5%      0.8%   3.3%   1.9%     1.8%
                               Torre
             Santiago Creel Miranda                                                                          4.9%     4.5%          -                       -        -      -      -        -
           Marcelo Ebrard Casaubón                                                                           2.9%     2.9%          -                       -        -      -      -        -
             Beatriz Paredes Rangel                                                                          3.8%     0.0%          -                       -        -      -      -        -
       Margarita Zavala Gómez Del
                                                                                                             1.2%     0.0%          -                       -        -      -      -        -
                             Campo
                Elba Esther Gordillo                                                                         0.7%     0.0%          -                       -        -      -      -        -
              Manlio Fabio Beltrones                                                                                  1.2%          -                       -        -      -      -        -
                            Ninguno                                                                         16.1%    18.2%    17.3%    17.9%   18.6%  19.2%    19.6%   19.9%  20.3%    17.5%
                            No sabe                                                                         21.8%    15.4%    20.2%    16.7%   16.4%  16.0%    15.9%   16.3%  14.7%    12.3%
                              NS/NC                                                                          1.3%     2.7%      1.6%    1.9%    1.9%   1.8%      1.2%   1.2%   2.0%     1.0%
  * anteriormente se preguntaba (dic11): Entre las siguientes personas, ¿Quién de ellos garantizaría un cambio de fondo para el país?
  ** anteriormente se preguntaba sin partidos (feb2012)

  ¿Escucho o vió el debate entre los candidatos presidenciales?
                                     ago 09   nov 09 mar 10       jul 10   nov 10    feb 11   jun 11    jul 11    oct 11    dic 11   ene 12   feb 12   mar 12   abr 12   may 12 4/06/12 18/06/12
                                  Si                                                                                                                                      46.2%   43.3%    53.5%
                                No                                                                                                                                        53.0%   56.0%    46.0%
                           No sabe                                                                                                                                         0.4%    0.5%     0.1%
                                NC                                                                                                                                         0.4%    0.2%     0.4%

  ¿A cuál de los candidatos le entendió mejor?
                                     ago 09    nov 09   mar 10    jul 10   nov 10    feb 11   jun 11    jul 11    oct 11    dic 11   ene 12   feb 12   mar 12   abr 12   may 12 4/06/12 18/06/12
   PRI – VERDE Enrique Peña Nieto                                                                                                                                         15.9%   15.7%    23.4%
       PRD – PT – MC(antes Conv) –
                                                                                                                                                                          21.3%     24.5%   23.3%
     Andrés Manuel López Obrador
       PAN – Josefina Vázquez Mota                                                                                                                                        11.8%     14.3%   19.3%
      PANAL – Gabriel Quadri de la
                                                                                                                                                                          28.6%     21.8%   12.9%
                               Torre
                           Ninguno                                                                                                                                        16.7%     16.4%   15.9%
                           No sabe                                                                                                                                         4.1%      4.4%    3.8%
                                 NC                                                                                                                                        1.5%      3.0%    1.3%

  ¿El debate le hizo cambiar su intención de voto?
                                     ago 09    nov 09   mar 10    jul 10   nov 10    feb 11   jun 11    jul 11    oct 11    dic 11   ene 12   feb 12   mar 12   abr 12   may 12 4/06/12 18/06/12
                                  Si                                                                                                                                      22.3%   20.6%    19.0%
                                 No                                                                                                                                       72.7%   75.0%    76.4%
                           No sabe                                                                                                                                         3.6%    2.5%     2.8%
                                 NC                                                                                                                                        1.3%    1.9%     1.7%

  ¿Se ha enterado de que en los últimos días ha habido protestas de estudiantes en contra de Enrique Peña Nieto y Televisa?
                                     ago 09   nov 09 mar 10       jul 10   nov 10    feb 11   jun 11    jul 11    oct 11    dic 11   ene 12   feb 12   mar 12   abr 12   may 12   4/06/12 18/06/12
                                 Si                                                                                                                                                 83.1%    82.1%
                                No                                                                                                                                                  14.9%    16.4%
                          No sabe                                                                                                                                                    2.0%     1.4%
                               NC                                                                                                                                                    0.1%     0.2%
Comparación estudios de opinión nacional                                                                                                                                                         Hoja 5

  En su opinión,¿los estudiantes tienen razón?
                                     ago 09    nov 09   mar 10    jul 10   nov 10   feb 11    jun 11       jul 11   oct 11   dic 11   ene 12   feb 12   mar 12   abr 12   may 12   4/06/12 18/06/12
                                  Si                                                                                                                                                 58.2%    54.0%
                                 No                                                                                                                                                  16.1%    20.2%
                            No sabe                                                                                                                                                  17.5%    17.9%
                                 NC                                                                                                                                                   8.3%     7.9%

                                                                                 Características de la población
  Sexo
                                         ago 09  nov 09 mar 10    jul 10  nov 10 feb 11  jun 11            jul 11  oct 11    dic 11 ene 12 feb 12  mar 12 abr 12 may 12 4/06/12 18/06/12
                           Masculino       46.5%  45.7%  46.3%      45.6%  44.7%   42.4%   41.6%             41.9%  43.3%     43.1%  41.3%   39.7%  42.3%  45.6%  46.6%   47.3%    44.9%
                           Femenino        53.5%  53.5%  50.6%      53.7%  54.8%   57.3%   58.2%             57.9%  56.4%     56.8%  58.3%   60.1%  57.7%  54.1%  53.2%   52.7%    54.9%

  Edad
                                         ago 09  nov 09 mar 10    jul 10  nov 10  feb 11  jun 11           jul 11  oct 11    dic 11  ene 12 feb 12  mar 12 abr 12 may 12 4/06/12 18/06/12
                             18 a   19      3.3%    4.7%  3.2%       5.1%    5.0%    5.6%    4.2%             5.5%    3.3%      5.0%   5.0%    4.3%   5.4%    6.5%  4.7%    5.9%     6.2%
                             20 a   35     34.0%  32.5%  32.6%      34.2%  34.5%    33.3%   32.8%            33.8%  34.2%     34.8%   32.4%   32.5%  37.0%  31.4%  33.7%   31.9%    28.7%
                             36 a   50     36.1%  37.0%  31.2%      32.3%  32.8%    35.2%   35.3%            34.2%  36.8%     31.9%   32.8%   34.1%  32.6%  34.1%  33.9%   32.4%    34.4%
                             51 a   60     13.3%  13.3%  22.0%      13.9%  15.1%    15.6%   13.5%            15.3%  13.1%     15.0%   15.0%   15.0%  13.2%  15.5%  15.5%   15.6%    17.8%
                           Mas de   60     13.3%  11.6%   9.4%      13.7%  12.3%     8.4%   13.7%            11.1%  12.1%     12.9%   14.4%   13.7%  11.6%  11.9%  12.1%   14.0%    12.8%

  Pensando en la persona que aporta la mayor parte del ingreso en este hogar, ¿Cuál fue el último año de   estudios que completó?
                                   ago 09   nov 09 mar 10        jul 10   nov 10     feb 11     jun 11     jul 11   oct 11   dic 11  ene 12 feb 12  mar 12 abr 12 may 12 4/06/12 18/06/12
                        No Estudio     5.4%    7.5%       5.2%      5.5%     6.3%       4.5%       5.7%       4.4%     5.5%     6.3%   5.6%    5.4%   4.7%    6.4%  5.5%    7.2%     5.7%
              Primaria incompleta    10.6%    12.2%      10.6%     10.8%   12.6%       11.6%       9.7%      11.9%    13.2%   12.1%   12.9%   10.6%  11.9%  11.8%   9.9%   13.0%     9.8%
                Primaria completa    15.8%    17.9%      16.6%     16.5%   19.1%       17.3%      17.7%      17.4%    16.8%   16.2%   16.6%   17.2%  17.3%  15.4%  17.7%   15.8%    18.0%
           Secundaria incompleta       4.4%    4.0%       2.9%      3.0%     4.9%       3.4%       2.4%       4.1%     4.4%     3.4%   4.4%    4.0%   4.0%    4.6%  3.6%    3.4%     3.0%
             Secundaria completa     18.9%    20.9%      17.2%     20.5%   21.2%       24.1%      24.0%      24.5%    23.0%   23.0%   21.5%   25.2%  21.6%  22.7%  22.6%   23.0%    23.3%
                 Carrera comercial     1.5%    2.9%       2.7%      1.5%     2.1%       1.7%       2.1%       1.5%     1.1%     1.8%   1.2%    1.0%   1.1%    1.2%  1.0%    0.8%     1.8%
                   Carrera técnica     5.0%    4.1%       4.3%      5.3%     4.3%       3.1%       3.1%       4.0%     4.1%     3.1%   2.9%    4.1%   4.5%    4.3%  5.2%    4.4%     3.7%
          Preparatoria incompleta      4.1%    4.2%       4.0%      6.0%     5.1%       4.1%       3.8%       4.3%     4.8%     4.7%   4.3%    3.7%   3.3%    3.9%  4.6%    4.0%     4.5%
            Preparatoria completa      9.3%   10.4%      10.8%     13.1%   11.3%       12.5%      12.4%      11.3%    11.3%   12.1%   12.4%   11.4%  13.9%  13.5%  11.2%   10.5%    12.8%
          Licenciatura incompleta      2.4%    2.3%       3.2%      2.0%     2.4%       3.1%       3.3%       3.0%     2.4%     2.7%   2.8%    2.1%   2.6%    2.5%  3.3%    2.1%     3.2%
            Licenciatura completa      9.7%   10.5%      10.7%     12.2%     8.8%      12.4%      12.6%      10.2%     8.9%   11.7%   10.9%   11.6%  12.4%  11.3%  12.7%   12.3%    11.0%
            Diplomado o maestría       1.0%    1.4%       3.9%      1.3%     0.4%       0.7%       1.7%       0.6%     1.0%     1.1%   1.4%    0.8%   1.3%    0.8%  0.6%    1.4%     0.9%
                        Doctorado      0.1%    0.3%       4.5%      0.3%     0.1%       0.2%       0.1%       0.2%     0.2%     0.2%   0.3%    0.1%   0.0%    0.3%  2.0%    0.1%     0.2%
                            NS/NC    11.8%     1.5%       3.6%      1.8%     1.4%       1.2%       1.5%       2.6%     3.3%     1.8%   2.7%    2.9%   1.4%    1.4%  0.2%    1.9%     2.1%

  Nivel Socio-económico
                                         ago 09  nov 09 mar 10    jul 10  nov 10  feb 11  jun 11           jul 11  oct 11    dic 11  ene 12 feb 12  mar 12 abr 12 may 12 4/06/12 18/06/12
                                  A/B       2.8%    3.1%  2.9%       4.0%    1.1%    2.3%    2.6%             1.9%    1.5%      2.1%   3.3%    2.0%   2.7%    1.6%  2.9%    3.4%     3.0%
                                  C+        8.0%    8.9%  7.9%      10.5%    8.1%    9.1%    9.7%             7.4%    8.9%      9.4%   8.8%    7.8%  12.0%    9.9% 10.7%    9.8%    11.0%
                                    C      11.8%  12.9%  11.2%      18.7%  14.5%    17.9%   16.0%            13.9%  13.5%     16.9%   14.5%   16.1%  18.7%  15.0%  16.9%   14.2%    17.5%
                                  D+       32.5%  35.1%  35.5%      34.4%  38.7%    37.6%   37.0%            38.4%  36.0%     34.2%   34.4%   37.0%  33.6%  37.3%  37.4%   36.4%    34.4%
                                    D      22.5%  25.7%  28.8%      22.8%  27.2%    23.0%   24.0%            26.1%  27.4%     24.0%   25.1%   23.0%  23.8%  23.8%  23.9%   23.6%    22.8%
                                    E      22.4%  14.3%  13.7%       9.7%  10.4%    10.2%   10.8%            12.4%  12.7%     13.3%   13.9%   14.1%   9.2%  12.5%   8.2%   12.6%    11.3%

  Nivel Socio-económico
                                         ago 09  nov 09 mar 10    jul 10  nov 10  feb 11  jun 11           jul 11  oct 11    dic 11  ene 12 feb 12  mar 12 abr 12 may 12 4/06/12 18/06/12
                                Alto        2.8%    3.1%  2.9%       4.0%    1.1%    2.3%    2.6%             1.9%    1.5%      2.1%   3.3%    2.0%   2.7%    1.6%  2.9%    3.4%     3.0%
                               Medio       19.8%  21.8%  19.1%      29.2%  22.6%    27.0%   25.6%            21.3%  22.4%     26.3%   23.3%   24.0%  30.7%  24.9%  27.6%   24.0%    28.5%
                                Bajo       77.4%  75.1%  78.0%      66.9%  76.3%    70.7%   71.8%            76.9%  76.1%     71.6%   73.4%   74.1%  66.6%  73.5%  69.6%   72.6%    68.5%

Más contenido relacionado

La actualidad más candente

Online time ex 30 data g
Online time ex 30 data gOnline time ex 30 data g
Online time ex 30 data gEdgar Mata
 
Global Views on Immigration and the Refugee Crisis
Global Views on Immigration and the Refugee CrisisGlobal Views on Immigration and the Refugee Crisis
Global Views on Immigration and the Refugee CrisisIpsos
 
Dr. Jason Ross - Strategies to Improve Swine Reproduction
Dr. Jason Ross - Strategies to Improve Swine ReproductionDr. Jason Ross - Strategies to Improve Swine Reproduction
Dr. Jason Ross - Strategies to Improve Swine ReproductionJohn Blue
 
2012 Mid Year Industrial Market Report
2012 Mid Year Industrial Market Report2012 Mid Year Industrial Market Report
2012 Mid Year Industrial Market Reportbrianparrish
 
Data Story 2: Supply Matters
Data Story 2: Supply MattersData Story 2: Supply Matters
Data Story 2: Supply MattersMediaMath
 
2020 nmfwa drone_session_2_tmo_nmfwa slides_final[19] copy_small
2020 nmfwa drone_session_2_tmo_nmfwa slides_final[19] copy_small2020 nmfwa drone_session_2_tmo_nmfwa slides_final[19] copy_small
2020 nmfwa drone_session_2_tmo_nmfwa slides_final[19] copy_smallBryanHall58
 
Vc diversity-methodology-write-up-v final
Vc diversity-methodology-write-up-v finalVc diversity-methodology-write-up-v final
Vc diversity-methodology-write-up-v finallingathoti
 
Entressen kirjaston lainaus heinäkuussa 2011
Entressen kirjaston lainaus heinäkuussa 2011Entressen kirjaston lainaus heinäkuussa 2011
Entressen kirjaston lainaus heinäkuussa 2011Jaakko Sannemann
 
William blair june 2017 final
William blair   june 2017 finalWilliam blair   june 2017 final
William blair june 2017 finalultainvestors
 
WEG Q2 2012 Conference Call
WEG Q2 2012 Conference CallWEG Q2 2012 Conference Call
WEG Q2 2012 Conference CallWEG
 
Latisha brown lom
Latisha brown lomLatisha brown lom
Latisha brown lomtiphini2
 
Progress and S curve
Progress and S curveProgress and S curve
Progress and S curveSohail Jamal
 

La actualidad más candente (12)

Online time ex 30 data g
Online time ex 30 data gOnline time ex 30 data g
Online time ex 30 data g
 
Global Views on Immigration and the Refugee Crisis
Global Views on Immigration and the Refugee CrisisGlobal Views on Immigration and the Refugee Crisis
Global Views on Immigration and the Refugee Crisis
 
Dr. Jason Ross - Strategies to Improve Swine Reproduction
Dr. Jason Ross - Strategies to Improve Swine ReproductionDr. Jason Ross - Strategies to Improve Swine Reproduction
Dr. Jason Ross - Strategies to Improve Swine Reproduction
 
2012 Mid Year Industrial Market Report
2012 Mid Year Industrial Market Report2012 Mid Year Industrial Market Report
2012 Mid Year Industrial Market Report
 
Data Story 2: Supply Matters
Data Story 2: Supply MattersData Story 2: Supply Matters
Data Story 2: Supply Matters
 
2020 nmfwa drone_session_2_tmo_nmfwa slides_final[19] copy_small
2020 nmfwa drone_session_2_tmo_nmfwa slides_final[19] copy_small2020 nmfwa drone_session_2_tmo_nmfwa slides_final[19] copy_small
2020 nmfwa drone_session_2_tmo_nmfwa slides_final[19] copy_small
 
Vc diversity-methodology-write-up-v final
Vc diversity-methodology-write-up-v finalVc diversity-methodology-write-up-v final
Vc diversity-methodology-write-up-v final
 
Entressen kirjaston lainaus heinäkuussa 2011
Entressen kirjaston lainaus heinäkuussa 2011Entressen kirjaston lainaus heinäkuussa 2011
Entressen kirjaston lainaus heinäkuussa 2011
 
William blair june 2017 final
William blair   june 2017 finalWilliam blair   june 2017 final
William blair june 2017 final
 
WEG Q2 2012 Conference Call
WEG Q2 2012 Conference CallWEG Q2 2012 Conference Call
WEG Q2 2012 Conference Call
 
Latisha brown lom
Latisha brown lomLatisha brown lom
Latisha brown lom
 
Progress and S curve
Progress and S curveProgress and S curve
Progress and S curve
 

Similar a Comparativo estudios de_opinion

Market neutral model daily model - equities vs. market
Market neutral model   daily model - equities vs. marketMarket neutral model   daily model - equities vs. market
Market neutral model daily model - equities vs. marketNadav Goldman
 
Excel Chart Gallery
Excel Chart GalleryExcel Chart Gallery
Excel Chart GalleryJohn Fuller
 
Market neutral model daily model - long short
Market neutral model   daily model - long shortMarket neutral model   daily model - long short
Market neutral model daily model - long shortNadav Goldman
 
[대학내일20대연구소] 2017 20대 전시회/페스티벌 문화 향유 실태 및 트렌드 조사 (연구리포트 2017-12)
[대학내일20대연구소] 2017 20대 전시회/페스티벌 문화 향유 실태 및 트렌드 조사 (연구리포트 2017-12)[대학내일20대연구소] 2017 20대 전시회/페스티벌 문화 향유 실태 및 트렌드 조사 (연구리포트 2017-12)
[대학내일20대연구소] 2017 20대 전시회/페스티벌 문화 향유 실태 및 트렌드 조사 (연구리포트 2017-12)20slab(대학내일20대연구소)
 
Result sensex valuation october 2011
Result sensex valuation october 2011Result sensex valuation october 2011
Result sensex valuation october 2011Tanesh Gagnani
 
Variaciones Merval 1993 - 2008
Variaciones Merval 1993 - 2008Variaciones Merval 1993 - 2008
Variaciones Merval 1993 - 2008Cityblog
 
Table 11, us hunger & poverty trends
Table 11, us hunger & poverty trendsTable 11, us hunger & poverty trends
Table 11, us hunger & poverty trendsBread for the World
 
T2 annual letter 2011
T2 annual letter 2011T2 annual letter 2011
T2 annual letter 2011Frank Ragol
 
Restaurant Monthly Update - July 2017
Restaurant Monthly Update - July 2017Restaurant Monthly Update - July 2017
Restaurant Monthly Update - July 2017Duff & Phelps
 
RESULTADOS DE LA ECE 2018-CUARTO GRADO DE PRIMARIA-DISTRITOS
RESULTADOS DE LA ECE 2018-CUARTO GRADO DE PRIMARIA-DISTRITOSRESULTADOS DE LA ECE 2018-CUARTO GRADO DE PRIMARIA-DISTRITOS
RESULTADOS DE LA ECE 2018-CUARTO GRADO DE PRIMARIA-DISTRITOSEugenio Marlon Evaristo Borja
 
Multiculturalism in Canada: What Census 2016 and Other Data Tell Us
Multiculturalism in Canada:  What Census 2016 and Other Data Tell UsMulticulturalism in Canada:  What Census 2016 and Other Data Tell Us
Multiculturalism in Canada: What Census 2016 and Other Data Tell UsAndrew Griffith
 
Bnm analisis financiero estructural nov 2000 - oct 2001
Bnm   analisis financiero estructural nov 2000 - oct 2001Bnm   analisis financiero estructural nov 2000 - oct 2001
Bnm analisis financiero estructural nov 2000 - oct 2001gonzaloromani
 
Final grades 2 11 codes only
Final grades 2 11 codes onlyFinal grades 2 11 codes only
Final grades 2 11 codes onlyLuz
 
Final grades 2 11 codes only
Final grades 2 11 codes onlyFinal grades 2 11 codes only
Final grades 2 11 codes onlyLuz
 

Similar a Comparativo estudios de_opinion (20)

Market neutral model daily model - equities vs. market
Market neutral model   daily model - equities vs. marketMarket neutral model   daily model - equities vs. market
Market neutral model daily model - equities vs. market
 
Excel Chart Gallery
Excel Chart GalleryExcel Chart Gallery
Excel Chart Gallery
 
Market neutral model daily model - long short
Market neutral model   daily model - long shortMarket neutral model   daily model - long short
Market neutral model daily model - long short
 
Reporte Notas
Reporte NotasReporte Notas
Reporte Notas
 
[대학내일20대연구소] 2017 20대 전시회/페스티벌 문화 향유 실태 및 트렌드 조사 (연구리포트 2017-12)
[대학내일20대연구소] 2017 20대 전시회/페스티벌 문화 향유 실태 및 트렌드 조사 (연구리포트 2017-12)[대학내일20대연구소] 2017 20대 전시회/페스티벌 문화 향유 실태 및 트렌드 조사 (연구리포트 2017-12)
[대학내일20대연구소] 2017 20대 전시회/페스티벌 문화 향유 실태 및 트렌드 조사 (연구리포트 2017-12)
 
Staff Demand and Shift Bidding
Staff Demand and Shift BiddingStaff Demand and Shift Bidding
Staff Demand and Shift Bidding
 
Result sensex valuation october 2011
Result sensex valuation october 2011Result sensex valuation october 2011
Result sensex valuation october 2011
 
Matematicas Financieras: Tablas de tasas factores financieros (2020)
Matematicas Financieras: Tablas de tasas factores financieros (2020)Matematicas Financieras: Tablas de tasas factores financieros (2020)
Matematicas Financieras: Tablas de tasas factores financieros (2020)
 
Variaciones Merval 1993 - 2008
Variaciones Merval 1993 - 2008Variaciones Merval 1993 - 2008
Variaciones Merval 1993 - 2008
 
Table 11, us hunger & poverty trends
Table 11, us hunger & poverty trendsTable 11, us hunger & poverty trends
Table 11, us hunger & poverty trends
 
T2 annual letter 2011
T2 annual letter 2011T2 annual letter 2011
T2 annual letter 2011
 
Restaurant Monthly Update - July 2017
Restaurant Monthly Update - July 2017Restaurant Monthly Update - July 2017
Restaurant Monthly Update - July 2017
 
Students Reporting Use of Selected Substances in the Last 30 Days
Students Reporting Use of Selected Substances in the Last 30 Days Students Reporting Use of Selected Substances in the Last 30 Days
Students Reporting Use of Selected Substances in the Last 30 Days
 
RESULTADOS DE LA ECE 2018-CUARTO GRADO DE PRIMARIA-DISTRITOS
RESULTADOS DE LA ECE 2018-CUARTO GRADO DE PRIMARIA-DISTRITOSRESULTADOS DE LA ECE 2018-CUARTO GRADO DE PRIMARIA-DISTRITOS
RESULTADOS DE LA ECE 2018-CUARTO GRADO DE PRIMARIA-DISTRITOS
 
Multiculturalism in Canada: What Census 2016 and Other Data Tell Us
Multiculturalism in Canada:  What Census 2016 and Other Data Tell UsMulticulturalism in Canada:  What Census 2016 and Other Data Tell Us
Multiculturalism in Canada: What Census 2016 and Other Data Tell Us
 
Bnm analisis financiero estructural nov 2000 - oct 2001
Bnm   analisis financiero estructural nov 2000 - oct 2001Bnm   analisis financiero estructural nov 2000 - oct 2001
Bnm analisis financiero estructural nov 2000 - oct 2001
 
HR analytics report
HR analytics reportHR analytics report
HR analytics report
 
Eff Set2 Assets
Eff Set2 AssetsEff Set2 Assets
Eff Set2 Assets
 
Final grades 2 11 codes only
Final grades 2 11 codes onlyFinal grades 2 11 codes only
Final grades 2 11 codes only
 
Final grades 2 11 codes only
Final grades 2 11 codes onlyFinal grades 2 11 codes only
Final grades 2 11 codes only
 

Más de Martin Triana

Comunicado de prensa de morena 5 mayo
Comunicado de prensa de morena 5 mayoComunicado de prensa de morena 5 mayo
Comunicado de prensa de morena 5 mayoMartin Triana
 
Comunicado de prensa de morena 15 de abril (2) (1)
Comunicado de prensa de morena 15 de abril (2) (1)Comunicado de prensa de morena 15 de abril (2) (1)
Comunicado de prensa de morena 15 de abril (2) (1)Martin Triana
 
Tematicas de campaña Nuevo Leon
Tematicas de campaña Nuevo LeonTematicas de campaña Nuevo Leon
Tematicas de campaña Nuevo LeonMartin Triana
 
Programas de gobierno Morena NL
Programas de gobierno Morena NLProgramas de gobierno Morena NL
Programas de gobierno Morena NLMartin Triana
 
Manual de brigada 2 Gatos En La Azotea NL
Manual de brigada 2 Gatos En La Azotea NLManual de brigada 2 Gatos En La Azotea NL
Manual de brigada 2 Gatos En La Azotea NLMartin Triana
 
Kgosni 140 esa economía mata
Kgosni 140 esa economía mataKgosni 140 esa economía mata
Kgosni 140 esa economía mataMartin Triana
 
Kgosni 138 amasijo de poderes
Kgosni 138 amasijo de poderesKgosni 138 amasijo de poderes
Kgosni 138 amasijo de poderesMartin Triana
 
Política energética texto completo
Política energética texto completoPolítica energética texto completo
Política energética texto completoMartin Triana
 
Dieterich chavez y el socialismo del siglo xxi
Dieterich  chavez y el socialismo del siglo xxiDieterich  chavez y el socialismo del siglo xxi
Dieterich chavez y el socialismo del siglo xxiMartin Triana
 
Kgosni 121 retiran máquina en olintla
Kgosni 121 retiran máquina en olintlaKgosni 121 retiran máquina en olintla
Kgosni 121 retiran máquina en olintlaMartin Triana
 
Convocatoria nacional jóvenes 2013 version pdf
Convocatoria nacional jóvenes 2013 version pdfConvocatoria nacional jóvenes 2013 version pdf
Convocatoria nacional jóvenes 2013 version pdfMartin Triana
 
Joan manuel serrat padre
Joan manuel serrat padreJoan manuel serrat padre
Joan manuel serrat padreMartin Triana
 
10postulados imprimible
10postulados imprimible10postulados imprimible
10postulados imprimibleMartin Triana
 

Más de Martin Triana (20)

Comunicado de prensa de morena 5 mayo
Comunicado de prensa de morena 5 mayoComunicado de prensa de morena 5 mayo
Comunicado de prensa de morena 5 mayo
 
Comunicado de prensa de morena 15 de abril (2) (1)
Comunicado de prensa de morena 15 de abril (2) (1)Comunicado de prensa de morena 15 de abril (2) (1)
Comunicado de prensa de morena 15 de abril (2) (1)
 
Tematicas de campaña Nuevo Leon
Tematicas de campaña Nuevo LeonTematicas de campaña Nuevo Leon
Tematicas de campaña Nuevo Leon
 
Programas de gobierno Morena NL
Programas de gobierno Morena NLProgramas de gobierno Morena NL
Programas de gobierno Morena NL
 
Manual de brigada 2 Gatos En La Azotea NL
Manual de brigada 2 Gatos En La Azotea NLManual de brigada 2 Gatos En La Azotea NL
Manual de brigada 2 Gatos En La Azotea NL
 
Kgosni 140 esa economía mata
Kgosni 140 esa economía mataKgosni 140 esa economía mata
Kgosni 140 esa economía mata
 
Freudomarxism2
Freudomarxism2Freudomarxism2
Freudomarxism2
 
Kgosni 138 amasijo de poderes
Kgosni 138 amasijo de poderesKgosni 138 amasijo de poderes
Kgosni 138 amasijo de poderes
 
Froidomarxism2
Froidomarxism2Froidomarxism2
Froidomarxism2
 
Política energética texto completo
Política energética texto completoPolítica energética texto completo
Política energética texto completo
 
Dieterich chavez y el socialismo del siglo xxi
Dieterich  chavez y el socialismo del siglo xxiDieterich  chavez y el socialismo del siglo xxi
Dieterich chavez y el socialismo del siglo xxi
 
Kgosni 121 retiran máquina en olintla
Kgosni 121 retiran máquina en olintlaKgosni 121 retiran máquina en olintla
Kgosni 121 retiran máquina en olintla
 
Regeneracion27
Regeneracion27Regeneracion27
Regeneracion27
 
Volante color
Volante colorVolante color
Volante color
 
Convocatoria nacional jóvenes 2013 version pdf
Convocatoria nacional jóvenes 2013 version pdfConvocatoria nacional jóvenes 2013 version pdf
Convocatoria nacional jóvenes 2013 version pdf
 
Anexo 1
Anexo 1Anexo 1
Anexo 1
 
Regeneracion26
Regeneracion26Regeneracion26
Regeneracion26
 
Joan manuel serrat padre
Joan manuel serrat padreJoan manuel serrat padre
Joan manuel serrat padre
 
10postulados imprimible
10postulados imprimible10postulados imprimible
10postulados imprimible
 
Wensen nl mx
Wensen nl mxWensen nl mx
Wensen nl mx
 

Comparativo estudios de_opinion

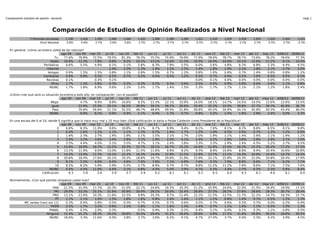
  • 1. Comparación estudios de opinión nacional Hoja 1 Comparación de Estudios de Opinión Realizados a Nivel Nacional # Personas encuestas 1,230 1,416 1,293 1,485 1,484 1,310 1,306 1,284 1,292 1,311 1,316 1,315 1,319 1,315 1,316 1,316 1,315 Error Muestral 2.8% 2.6% 2.7% 2.5% 2.5% 2.7% 2.7% 2.7% 2.7% 2.7% 2.7% 2.7% 2.7% 2.7% 2.7% 2.7% 2.7% En general, ¿cómo se entera usted de las noticias? ago 09 nov 09 mar 10 jul 10 nov 10 feb 11 jun 11 jul 11 oct 11 dic 11 ene 12 feb 12 mar 12 abr 12 may 12 4/06/12 18/06/12 Tv. 77.6% 76.8% 72.5% 79.5% 81.3% 79.3% 75.5% 74.9% 76.9% 77.9% 78.6% 78.7% 78.7% 73.6% 78.2% 79.6% 77.3% Radio 10.9% 12.3% 7.6% 9.6% 9.2% 10.2% 13.1% 12.6% 11.5% 10.5% 10.0% 10.6% 10.1% 12.6% 11.2% 9.1% 10.4% Periódicos 6.6% 5.5% 4.9% 6.1% 5.1% 5.8% 6.3% 7.9% 5.5% 6.0% 5.6% 4.8% 6.3% 6.8% 5.3% 4.4% 4.5% Internet 2.4% 1.2% 1.3% 1.4% 1.5% 1.5% 1.4% 1.8% 1.9% 2.2% 1.8% 2.1% 2.7% 3.0% Amigos 0.9% 1.5% 1.5% 0.8% 1.1% 0.9% 1.5% 0.7% 1.2% 0.8% 1.0% 0.8% 0.7% 1.4% 0.8% 0.8% 1.2% Familiares 0.6% 0.8% 0.5% 0.5% 0.7% 0.2% 0.4% 0.5% 1.2% 0.5% 0.7% 0.6% 0.2% 1.0% 0.5% 0.5% 0.5% Revistas 0.1% 0.3% 0.1% 0.0% 0.1% 0.0% 0.0% 0.0% 0.0% 0.0% 0.0% Otros 1.7% 1.3% 5.8% 0.3% 0.3% 0.3% 0.2% 0.5% 0.6% 0.5% 0.5% 0.9% 0.8% 0.6% 0.6% 1.1% 0.8% NS/NC 1.7% 1.8% 6.9% 0.6% 1.1% 2.0% 1.7% 1.4% 1.5% 2.3% 1.7% 1.7% 1.1% 2.1% 1.2% 1.8% 2.4% ¿Cómo cree que será su situación económica este año, en comparación con el pasado? ago 09 nov 09 mar 10 jul 10 nov 10 feb 11 jun 11 jul 11 oct 11 dic 11 ene 12 feb 12 mar 12 abr 12 may 12 4/06/12 18/06/12 Mejor 4.7% 9.9% 8.8% 10.6% 9.3% 11.3% 12.1% 10.9% 14.0% 16.1% 14.7% 14.5% 14.5% 12.6% 12.6% 13.5% Igual 23.9% 25.0% 39.1% 36.5% 39.9% 39.5% 36.7% 36.6% 35.4% 35.2% 32.0% 39.8% 37.7% 39.7% 40.9% 36.7% Peor 70.6% 56.9% 51.1% 52.5% 48.7% 48.8% 49.5% 51.8% 49.8% 45.5% 50.9% 44.1% 45.9% 44.3% 43.4% 46.5% NS/NC 0.8% 8.2% 0.9% 0.4% 2.1% 0.4% 1.7% 0.7% 0.8% 3.2% 2.4% 1.6% 1.9% 3.4% 3.0% 3.3% En una escala del 0 al 10, donde 0 significa que lo hace muy mal y 10 muy bien ¿Qué calificación le daría a Felipe Calderón como Presidente de la República? ago 09 nov 09 mar 10 jul 10 nov 10 feb 11 jun 11 jul 11 oct 11 dic 11 ene 12 feb 12 mar 12 abr 12 may 12 4/06/12 18/06/12 0 6.6% 8.3% 11.0% 9.6% 10.8% 9.1% 8.7% 9.9% 9.4% 8.1% 7.6% 8.1% 8.2% 8.8% 8.5% 9.1% 9.8% 1 0.4% 1.6% 1.1% 1.1% 1.1% 1.2% 0.7% 1.4% 1.7% 1.5% 1.0% 0.5% 0.9% 0.7% 1.1% 1.2% 0.6% 2 1.6% 2.3% 2.7% 1.4% 1.9% 2.1% 1.5% 2.1% 1.7% 2.0% 1.9% 1.1% 1.4% 2.6% 2.1% 1.9% 1.2% 3 2.9% 3.2% 3.6% 3.4% 2.8% 3.1% 1.9% 2.0% 4.1% 2.4% 2.5% 2.8% 3.8% 2.9% 3.9% 2.1% 2.0% 4 3.5% 4.4% 4.0% 5.1% 3.5% 4.7% 3.1% 2.4% 3.8% 3.3% 3.3% 2.9% 2.4% 4.5% 5.2% 3.7% 4.5% 5 15.6% 18.9% 16.7% 15.5% 20.3% 15.7% 18.1% 16.7% 15.2% 16.6% 12.8% 15.4% 16.3% 15.2% 16.2% 17.2% 17.5% 6 13.2% 11.9% 9.0% 13.0% 11.8% 11.5% 11.0% 9.9% 9.2% 9.3% 8.9% 10.6% 8.9% 9.4% 10.4% 10.6% 10.8% 7 14.2% 15.0% 11.5% 14.1% 15.2% 16.3% 14.4% 12.9% 12.5% 12.8% 13.7% 13.2% 14.3% 14.6% 14.4% 14.7% 14.5% 8 20.6% 18.4% 17.6% 20.1% 19.3% 18.8% 19.7% 20.6% 21.9% 22.9% 22.1% 22.8% 24.3% 22.0% 20.8% 20.4% 17.9% 9 8.1% 5.2% 4.9% 6.4% 4.6% 7.0% 7.6% 7.1% 6.9% 7.6% 9.3% 7.9% 8.9% 6.6% 7.1% 6.2% 7.1% 10 8.2% 6.2% 5.9% 5.9% 5.5% 5.7% 8.9% 9.7% 9.7% 8.8% 11.5% 11.2% 7.9% 8.6% 7.1% 7.5% 7.6% NS/NC 5.0% 4.5% 11.9% 4.4% 3.1% 4.8% 4.4% 5.4% 3.9% 4.7% 5.5% 3.4% 2.7% 4.2% 3.3% 5.6% 6.4% Calificación 6.3 5.9 5.6 5.9 5.7 5.9 6.2 6.1 6.1 6.2 6.5 6.4 6.3 6.1 6.0 6.1 6.0 Normalmente, ¿Con qué partido simpatiza usted mas? ago 09 nov 09 mar 10 jul 10 nov 10 feb 11 jun 11 jul 11 oct 11 dic 11 ene 12 feb 12 mar 12 abr 12 may 12 4/06/12 18/06/12 PAN 21.5% 21.4% 17.7% 20.3% 21.0% 22.1% 24.6% 19.3% 20.3% 21.2% 25.9% 24.6% 22.0% 21.5% 19.4% 19.9% 17.5% PRI 29.0% 33.3% 25.1% 31.6% 30.9% 30.0% 29.2% 30.0% 32.4% 28.8% 27.5% 28.5% 27.6% 28.6% 29.3% 26.7% 28.4% PRD 13.1% 13.0% 10.3% 11.6% 12.3% 9.8% 10.3% 9.7% 11.4% 12.1% 11.5% 12.5% 11.7% 12.1% 14.7% 16.3% 15.7% PT 1.1% 1.1% 1.0% 1.5% 1.8% 1.6% 0.8% 1.0% 1.4% 1.1% 1.1% 0.8% 1.4% 0.7% 0.5% 1.2% 1.3% MC (antes Conv oct 11) 0.3% 0.4% 0.8% 0.5% 0.3% 0.7% 0.2% 0.7% 0.6% 0.5% 0.7% 0.6% 0.3% 0.7% 0.0% 0.2% 0.4% PVEM 2.5% 1.7% 3.2% 0.9% 1.1% 1.6% 1.1% 1.6% 1.3% 1.4% 0.7% 1.1% 1.4% 1.1% 0.3% 1.3% 1.2% PANAL 0.4% 0.5% 2.0% 0.3% 0.5% 0.9% 0.3% 0.2% 0.4% 5.1% 0.9% 0.1% 0.2% 1.1% 0.8% 0.5% Ninguno 15.4% 25.3% 28.3% 29.2% 28.8% 30.0% 29.4% 31.2% 28.4% 29.9% 0.8% 27.5% 31.6% 29.8% 30.5% 29.8% 30.5% NS/NC 16.6% 3.3% 11.6% 4.0% 3.8% 3.7% 3.6% 6.2% 4.1% 4.7% 27.4% 3.7% 4.0% 5.3% 4.2% 3.9% 4.5%
  • 2. Comparación estudios de opinión nacional Hoja 2 ¿Por cuál partido nunca votaría? ago 09 nov 09 mar 10 jul 10 nov 10 feb 11 jun 11 jul 11 oct 11 dic 11 ene 12 feb 12 mar 12 abr 12 may 12 4/06/12 18/06/12 PAN 10.5% 19.3% 16.6% 13.5% 13.8% 12.1% 11.4% 13.7% 12.8% 16.6% 12.9% 14.5% 14.8% 17.6% 16.5% 14.3% 14.8% PRI 12.9% 12.6% 14.1% 14.5% 16.0% 15.3% 14.4% 14.3% 16.9% 16.1% 18.8% 20.1% 18.1% 18.8% 22.3% 27.2% 23.8% PRD 17.6% 21.5% 20.9% 18.6% 23.1% 19.5% 24.5% 18.9% 21.0% 20.8% 21.9% 22.4% 22.1% 20.2% 18.3% 18.6% 18.4% PT 8.5% 5.5% 4.6% 6.8% 5.1% 8.3% 5.0% 6.2% 6.0% 6.3% 4.6% 4.9% 5.5% 4.2% 3.3% 3.7% 2.3% MC (antes Conv oct 11) 4.6% 4.1% 2.9% 3.9% 3.9% 5.6% 5.7% 3.6% 2.9% 3.3% 4.0% 2.4% 2.6% 2.0% 1.8% 2.1% 1.6% PVEM 2.8% 2.3% 8.4% 2.3% 2.0% 3.0% 2.8% 2.0% 2.7% 2.8% 3.7% 2.5% 3.9% 2.2% 2.6% 2.1% 2.1% PANAL 2.7% 2.5% 2.1% 1.9% 2.6% 2.9% 2.6% 2.5% 1.5% 1.4% 1.7% 3.0% 3.4% 3.5% 4.0% 3.8% 3.8% Ninguno 11.3% 15.0% 13.0% 19.7% 17.3% 16.7% 18.1% 18.8% 19.6% 17.7% 14.9% 14.1% 13.3% 14.1% 12.1% 11.4% 14.7% NS/NC 29.2% 17.2% 17.5% 18.7% 16.2% 16.6% 15.5% 20.0% 16.6% 15.0% 17.4% 16.2% 16.3% 17.5% 19.0% 16.7% 18.6% Conocimiento e impresión de candidatos ¿Conoce usted a Andrés Manuel López Obrador? ago 09 nov 09 mar 10 jul 10 nov 10 feb 11 jun 11 jul 11 oct 11 dic 11 ene 12 feb 12 mar 12 abr 12 may 12 4/06/12 18/06/12 Si lo conoce 93.3% 92.8% 83.1% 90.6% 88.5% 89.9% 90.2% 85.1% 92.6% 94.7% 93.5% 93.2% 94.1% 95.2% 96.7% 96.7% 97.8% No lo conoce 6.7% 7.1% 8.4% 8.1% 11.1% 9.3% 9.8% 13.3% 6.9% 5.0% 6.4% 6.8% 5.8% 4.7% 3.1% 3.2% 2.1% NC 0.0% 0.1% 8.6% 1.3% 0.4% 0.8% 0.1% 1.6% 0.5% 0.3% 0.2% 0.1% 0.1% 0.1% 0.2% 0.1% 0.1% ¿Qué impresión tiene de Andrés Manuel López Obrador? ago 09 nov 09 mar 10 jul 10 nov 10 feb 11 jun 11 jul 11 oct 11 dic 11 ene 12 feb 12 mar 12 abr 12 may 12 4/06/12 18/06/12 Buena 28.5% 28.9% 24.1% 33.5% 28.0% 27.1% 26.8% 32.9% 36.4% 35.9% 34.6% 37.2% 35.0% 41.9% 42.4% 37.7% Mala 34.3% 33.6% 36.1% 25.4% 30.5% 31.7% 31.5% 25.9% 23.7% 25.4% 26.6% 25.6% 25.1% 22.7% 19.3% 26.7% Indiferente 28.1% 29.1% 30.7% 33.8% 33.6% 35.2% 35.4% 34.3% 32.8% 32.3% 30.5% 30.2% 32.0% 29.9% 31.9% 29.3% No sabe 5.9% 5.9% 7.1% 3.8% 5.6% 4.1% 4.9% 4.7% 5.6% 5.5% 7.1% 6.3% 6.3% 4.6% 4.6% 5.1% NS/NC 3.2% 2.4% 2.0% 3.6% 2.4% 1.9% 1.4% 2.2% 1.5% 0.8% 1.1% 0.6% 1.6% 1.0% 1.8% 1.2% ¿Nunca votaría por Andrés Manuel López Obrador? ago 09 nov 09 mar 10 jul 10 nov 10 feb 11 jun 11 jul 11 oct 11 dic 11 ene 12 feb 12 mar 12 abr 12 may 12 4/06/12 18/06/12 Nunca votaría 27.7% 24.5% 25.4% 22.5% 25.1% 29.0% 28.5% 22.5% 25.7% 32.3% 28.2% 25.8% 27.2% 19.3% 15.6% 21.2% NS/NC 72.3% 75.5% 74.6% 77.5% 74.9% 71.0% 71.5% 77.5% 74.3% 67.7% 71.8% 74.2% 72.8% 80.7% 84.4% 78.8% ¿Conoce usted a Enrique Peña Nieto? ago 09 nov 09 mar 10 jul 10 nov 10 feb 11 jun 11 jul 11 oct 11 dic 11 ene 12 feb 12 mar 12 abr 12 may 12 4/06/12 18/06/12 Si lo conoce 77.1% 78.0% 74.0% 81.1% 82.1% 86.3% 82.6% 78.2% 85.9% 88.3% 88.7% 89.4% 91.1% 94.4% 97.9% 96.3% 98.3% No lo conoce 22.9% 21.7% 24.4% 18.4% 17.9% 13.4% 17.3% 20.4% 13.7% 11.1% 11.2% 10.6% 8.9% 5.6% 2.1% 3.7% 1.7% NC 0.0% 0.3% 1.6% 0.5% 0.0% 0.3% 0.1% 1.4% 0.4% 0.5% 0.1% 0.0% 0.1% 0.0% 0.1% 0.0% 0.0% ¿Qué impresión tiene de Enrique Peña Nieto? ago 09 nov 09 mar 10 jul 10 nov 10 feb 11 jun 11 jul 11 oct 11 dic 11 ene 12 feb 12 mar 12 abr 12 may 12 4/06/12 18/06/12 Buena 59.7% 54.8% 49.9% 47.8% 44.6% 43.9% 46.6% 50.0% 44.0% 47.9% 42.2% 45.3% 42.4% 35.9% 31.0% 32.5% Mala 4.1% 7.2% 11.5% 9.1% 11.4% 10.2% 9.7% 8.9% 12.7% 15.7% 16.9% 17.5% 19.4% 24.8% 33.7% 28.6% Indiferente 26.3% 29.0% 30.4% 34.7% 35.4% 37.9% 37.0% 34.3% 35.5% 28.6% 32.9% 30.3% 28.8% 32.4% 28.2% 31.8% No sabe 7.5% 6.9% 7.5% 5.3% 7.2% 5.8% 6.2% 5.0% 6.4% 6.8% 7.0% 6.6% 7.9% 5.9% 5.3% 6.0% NS/NC 2.4% 2.1% 0.6% 3.0% 1.4% 2.2% 0.6% 1.7% 1.4% 1.0% 1.0% 0.3% 1.5% 1.0% 1.8% 1.0% ¿Nunca votaría por Enrique Peña Nieto? ago 09 nov 09 mar 10 jul 10 nov 10 feb 11 jun 11 jul 11 oct 11 dic 11 ene 12 feb 12 mar 12 abr 12 may 12 4/06/12 18/06/12 Nunca votaría 5.5% 7.0% 9.5% 8.0% 9.1% 11.8% 11.8% 9.3% 13.7% 19.9% 19.9% 18.5% 19.0% 23.0% 27.2% 24.5% NS/NC 94.5% 93.0% 90.5% 92.0% 90.9% 88.2% 88.2% 90.7% 86.3% 80.1% 80.1% 81.5% 81.0% 77.0% 72.8% 75.5%
  • 3. Comparación estudios de opinión nacional Hoja 3 ¿Conoce usted a Josefina Vázquez Mota? ago 09 nov 09 mar 10 jul 10 nov 10 feb 11 jun 11 jul 11 oct 11 dic 11 ene 12 feb 12 mar 12 abr 12 may 12 4/06/12 18/06/12 Si lo conoce 46.7% 58.7% 72.2% 75.7% 76.7% 86.5% 92.0% 92.9% 95.4% No lo conoce 52.7% 40.7% 27.3% 24.2% 22.9% 13.3% 7.7% 6.9% 4.4% NC 0.6% 0.6% 0.5% 0.1% 0.4% 0.2% 0.4% 0.2% 0.2% ¿Que opinión tiene de Josefina Vázquez Mota? ago 09 nov 09 mar 10 jul 10 nov 10 feb 11 jun 11 jul 11 oct 11 dic 11 ene 12 feb 12 mar 12 abr 12 may 12 4/06/12 18/06/12 Buena 24.9% 24.8% 31.9% 35.0% 31.7% 34.3% 30.3% 28.4% 29.9% Mala 16.9% 16.6% 14.7% 16.5% 19.2% 22.1% 27.7% 26.5% 26.5% Indiferente 45.6% 47.1% 42.0% 36.7% 39.2% 33.0% 34.4% 37.2% 37.0% No sabe 8.6% 9.1% 9.9% 9.8% 9.2% 8.5% 6.4% 6.0% 5.2% NS/NC 4.0% 2.3% 1.5% 1.9% 0.7% 2.0% 1.2% 1.9% 1.5% ¿Nunca votaría por Josefina Vázquez Mota? ago 09 nov 09 mar 10 jul 10 nov 10 feb 11 jun 11 jul 11 oct 11 dic 11 ene 12 feb 12 mar 12 abr 12 may 12 4/06/12 18/06/12 Nunca votaría 11.9% 21.7% 25.5% 23.0% 19.6% 22.4% 25.5% 18.7% 18.6% NS/NC 88.1% 78.3% 74.5% 77.0% 80.4% 77.6% 74.5% 81.3% 81.4% ¿Conoce usted a Gabriel Quadri de la Torre? ago 09 nov 09 mar 10 jul 10 nov 10 feb 11 jun 11 jul 11 oct 11 dic 11 ene 12 feb 12 mar 12 abr 12 may 12 4/06/12 18/06/12 Si lo conoce 14.3% 34.9% 63.7% 69.0% 78.4% No lo conoce 84.8% 64.9% 35.8% 30.5% 20.9% NC 0.9% 0.2% 0.5% 0.5% 0.7% ¿Que opinión tiene de Gabriel Quadri de la Torre? ago 09 nov 09 mar 10 jul 10 nov 10 feb 11 jun 11 jul 11 oct 11 dic 11 ene 12 feb 12 mar 12 abr 12 may 12 4/06/12 18/06/12 Buena 7.9% 12.6% 24.7% 18.6% 19.7% Mala 12.7% 20.9% 16.6% 17.5% 20.6% Indiferente 56.6% 49.2% 46.8% 50.6% 47.1% No sabe 20.1% 14.2% 10.3% 11.2% 11.3% NS/NC 2.6% 3.1% 1.7% 2.2% 1.3% ¿Nunca votaría por Gabriel Quadri de la Torre? ago 09 nov 09 mar 10 jul 10 nov 10 feb 11 jun 11 jul 11 oct 11 dic 11 ene 12 feb 12 mar 12 abr 12 may 12 4/06/12 18/06/12 Nunca votaría 18.5% 28.5% 15.4% 19.8% 17.5% NS/NC 81.5% 71.5% 84.6% 80.2% 82.5% Simulación de voto Si las elecciones fueran hoy, ¿por quién votaría para Presidente de la república en el 2012? ago 09 nov 09 mar 10 jul 10 nov 10 feb 11 jun 11 jul 11 oct 11 dic 11 ene 12 feb 12 mar 12 abr 12 may 12 4/06/12 18/06/12 PAN – Josefina Vázquez Mota 19.9% 22.2% 18.4% 19.3% 18.4% PRI – VERDE Enrique Peña Nieto 36.7% 33.2% 29.5% 26.0% 26.4% PRD – PT – MC(antes Conv) – 21.6% 21.3% 24.1% 28.1% 27.8% Andrés Manuel López Obrador PANAL – Gabriel Quadri de la 0.8% 1.1% 4.1% 2.9% 2.5% Torre Ninguno 8.5% 7.0% 7.3% 5.7% 6.8% No sabe 10.1% 12.6% 12.7% 13.7% 13.8% NS/NC 2.4% 2.7% 3.9% 4.3% 4.4%
  • 4. Comparación estudios de opinión nacional Hoja 4 Entre las siguientes personas, ¿Quién de ellos garantizaría un cambio verdadero para el país? ago 09 nov 09 mar 10 jul 10 nov 10 feb 11 jun 11 jul 11 oct 11 dic 11 ene 12 feb 12 mar 12 abr 12 may 12 4/06/12 18/06/12 PRD – PT – MC(antes Conv) – 18.8% 21.3% 23.4% 22.3% 22.1% 23.3% 21.4% 27.5% 28.4% 34.0% Andrés Manuel López Obrador PRI – VERDE Enrique Peña Nieto 28.3% 28.7% 26.9% 24.8% 23.1% 24.4% 23.7% 19.0% 18.4% 18.3% PAN – Josefina Vázquez Mota 5.1% 10.5% 16.4% 17.8% 14.8% 17.4% 12.8% 14.3% 15.1% PANAL – Gabriel Quadri de la 0.5% 0.8% 3.3% 1.9% 1.8% Torre Santiago Creel Miranda 4.9% 4.5% - - - - - - Marcelo Ebrard Casaubón 2.9% 2.9% - - - - - - Beatriz Paredes Rangel 3.8% 0.0% - - - - - - Margarita Zavala Gómez Del 1.2% 0.0% - - - - - - Campo Elba Esther Gordillo 0.7% 0.0% - - - - - - Manlio Fabio Beltrones 1.2% - - - - - - Ninguno 16.1% 18.2% 17.3% 17.9% 18.6% 19.2% 19.6% 19.9% 20.3% 17.5% No sabe 21.8% 15.4% 20.2% 16.7% 16.4% 16.0% 15.9% 16.3% 14.7% 12.3% NS/NC 1.3% 2.7% 1.6% 1.9% 1.9% 1.8% 1.2% 1.2% 2.0% 1.0% * anteriormente se preguntaba (dic11): Entre las siguientes personas, ¿Quién de ellos garantizaría un cambio de fondo para el país? ** anteriormente se preguntaba sin partidos (feb2012) ¿Escucho o vió el debate entre los candidatos presidenciales? ago 09 nov 09 mar 10 jul 10 nov 10 feb 11 jun 11 jul 11 oct 11 dic 11 ene 12 feb 12 mar 12 abr 12 may 12 4/06/12 18/06/12 Si 46.2% 43.3% 53.5% No 53.0% 56.0% 46.0% No sabe 0.4% 0.5% 0.1% NC 0.4% 0.2% 0.4% ¿A cuál de los candidatos le entendió mejor? ago 09 nov 09 mar 10 jul 10 nov 10 feb 11 jun 11 jul 11 oct 11 dic 11 ene 12 feb 12 mar 12 abr 12 may 12 4/06/12 18/06/12 PRI – VERDE Enrique Peña Nieto 15.9% 15.7% 23.4% PRD – PT – MC(antes Conv) – 21.3% 24.5% 23.3% Andrés Manuel López Obrador PAN – Josefina Vázquez Mota 11.8% 14.3% 19.3% PANAL – Gabriel Quadri de la 28.6% 21.8% 12.9% Torre Ninguno 16.7% 16.4% 15.9% No sabe 4.1% 4.4% 3.8% NC 1.5% 3.0% 1.3% ¿El debate le hizo cambiar su intención de voto? ago 09 nov 09 mar 10 jul 10 nov 10 feb 11 jun 11 jul 11 oct 11 dic 11 ene 12 feb 12 mar 12 abr 12 may 12 4/06/12 18/06/12 Si 22.3% 20.6% 19.0% No 72.7% 75.0% 76.4% No sabe 3.6% 2.5% 2.8% NC 1.3% 1.9% 1.7% ¿Se ha enterado de que en los últimos días ha habido protestas de estudiantes en contra de Enrique Peña Nieto y Televisa? ago 09 nov 09 mar 10 jul 10 nov 10 feb 11 jun 11 jul 11 oct 11 dic 11 ene 12 feb 12 mar 12 abr 12 may 12 4/06/12 18/06/12 Si 83.1% 82.1% No 14.9% 16.4% No sabe 2.0% 1.4% NC 0.1% 0.2%
  • 5. Comparación estudios de opinión nacional Hoja 5 En su opinión,¿los estudiantes tienen razón? ago 09 nov 09 mar 10 jul 10 nov 10 feb 11 jun 11 jul 11 oct 11 dic 11 ene 12 feb 12 mar 12 abr 12 may 12 4/06/12 18/06/12 Si 58.2% 54.0% No 16.1% 20.2% No sabe 17.5% 17.9% NC 8.3% 7.9% Características de la población Sexo ago 09 nov 09 mar 10 jul 10 nov 10 feb 11 jun 11 jul 11 oct 11 dic 11 ene 12 feb 12 mar 12 abr 12 may 12 4/06/12 18/06/12 Masculino 46.5% 45.7% 46.3% 45.6% 44.7% 42.4% 41.6% 41.9% 43.3% 43.1% 41.3% 39.7% 42.3% 45.6% 46.6% 47.3% 44.9% Femenino 53.5% 53.5% 50.6% 53.7% 54.8% 57.3% 58.2% 57.9% 56.4% 56.8% 58.3% 60.1% 57.7% 54.1% 53.2% 52.7% 54.9% Edad ago 09 nov 09 mar 10 jul 10 nov 10 feb 11 jun 11 jul 11 oct 11 dic 11 ene 12 feb 12 mar 12 abr 12 may 12 4/06/12 18/06/12 18 a 19 3.3% 4.7% 3.2% 5.1% 5.0% 5.6% 4.2% 5.5% 3.3% 5.0% 5.0% 4.3% 5.4% 6.5% 4.7% 5.9% 6.2% 20 a 35 34.0% 32.5% 32.6% 34.2% 34.5% 33.3% 32.8% 33.8% 34.2% 34.8% 32.4% 32.5% 37.0% 31.4% 33.7% 31.9% 28.7% 36 a 50 36.1% 37.0% 31.2% 32.3% 32.8% 35.2% 35.3% 34.2% 36.8% 31.9% 32.8% 34.1% 32.6% 34.1% 33.9% 32.4% 34.4% 51 a 60 13.3% 13.3% 22.0% 13.9% 15.1% 15.6% 13.5% 15.3% 13.1% 15.0% 15.0% 15.0% 13.2% 15.5% 15.5% 15.6% 17.8% Mas de 60 13.3% 11.6% 9.4% 13.7% 12.3% 8.4% 13.7% 11.1% 12.1% 12.9% 14.4% 13.7% 11.6% 11.9% 12.1% 14.0% 12.8% Pensando en la persona que aporta la mayor parte del ingreso en este hogar, ¿Cuál fue el último año de estudios que completó? ago 09 nov 09 mar 10 jul 10 nov 10 feb 11 jun 11 jul 11 oct 11 dic 11 ene 12 feb 12 mar 12 abr 12 may 12 4/06/12 18/06/12 No Estudio 5.4% 7.5% 5.2% 5.5% 6.3% 4.5% 5.7% 4.4% 5.5% 6.3% 5.6% 5.4% 4.7% 6.4% 5.5% 7.2% 5.7% Primaria incompleta 10.6% 12.2% 10.6% 10.8% 12.6% 11.6% 9.7% 11.9% 13.2% 12.1% 12.9% 10.6% 11.9% 11.8% 9.9% 13.0% 9.8% Primaria completa 15.8% 17.9% 16.6% 16.5% 19.1% 17.3% 17.7% 17.4% 16.8% 16.2% 16.6% 17.2% 17.3% 15.4% 17.7% 15.8% 18.0% Secundaria incompleta 4.4% 4.0% 2.9% 3.0% 4.9% 3.4% 2.4% 4.1% 4.4% 3.4% 4.4% 4.0% 4.0% 4.6% 3.6% 3.4% 3.0% Secundaria completa 18.9% 20.9% 17.2% 20.5% 21.2% 24.1% 24.0% 24.5% 23.0% 23.0% 21.5% 25.2% 21.6% 22.7% 22.6% 23.0% 23.3% Carrera comercial 1.5% 2.9% 2.7% 1.5% 2.1% 1.7% 2.1% 1.5% 1.1% 1.8% 1.2% 1.0% 1.1% 1.2% 1.0% 0.8% 1.8% Carrera técnica 5.0% 4.1% 4.3% 5.3% 4.3% 3.1% 3.1% 4.0% 4.1% 3.1% 2.9% 4.1% 4.5% 4.3% 5.2% 4.4% 3.7% Preparatoria incompleta 4.1% 4.2% 4.0% 6.0% 5.1% 4.1% 3.8% 4.3% 4.8% 4.7% 4.3% 3.7% 3.3% 3.9% 4.6% 4.0% 4.5% Preparatoria completa 9.3% 10.4% 10.8% 13.1% 11.3% 12.5% 12.4% 11.3% 11.3% 12.1% 12.4% 11.4% 13.9% 13.5% 11.2% 10.5% 12.8% Licenciatura incompleta 2.4% 2.3% 3.2% 2.0% 2.4% 3.1% 3.3% 3.0% 2.4% 2.7% 2.8% 2.1% 2.6% 2.5% 3.3% 2.1% 3.2% Licenciatura completa 9.7% 10.5% 10.7% 12.2% 8.8% 12.4% 12.6% 10.2% 8.9% 11.7% 10.9% 11.6% 12.4% 11.3% 12.7% 12.3% 11.0% Diplomado o maestría 1.0% 1.4% 3.9% 1.3% 0.4% 0.7% 1.7% 0.6% 1.0% 1.1% 1.4% 0.8% 1.3% 0.8% 0.6% 1.4% 0.9% Doctorado 0.1% 0.3% 4.5% 0.3% 0.1% 0.2% 0.1% 0.2% 0.2% 0.2% 0.3% 0.1% 0.0% 0.3% 2.0% 0.1% 0.2% NS/NC 11.8% 1.5% 3.6% 1.8% 1.4% 1.2% 1.5% 2.6% 3.3% 1.8% 2.7% 2.9% 1.4% 1.4% 0.2% 1.9% 2.1% Nivel Socio-económico ago 09 nov 09 mar 10 jul 10 nov 10 feb 11 jun 11 jul 11 oct 11 dic 11 ene 12 feb 12 mar 12 abr 12 may 12 4/06/12 18/06/12 A/B 2.8% 3.1% 2.9% 4.0% 1.1% 2.3% 2.6% 1.9% 1.5% 2.1% 3.3% 2.0% 2.7% 1.6% 2.9% 3.4% 3.0% C+ 8.0% 8.9% 7.9% 10.5% 8.1% 9.1% 9.7% 7.4% 8.9% 9.4% 8.8% 7.8% 12.0% 9.9% 10.7% 9.8% 11.0% C 11.8% 12.9% 11.2% 18.7% 14.5% 17.9% 16.0% 13.9% 13.5% 16.9% 14.5% 16.1% 18.7% 15.0% 16.9% 14.2% 17.5% D+ 32.5% 35.1% 35.5% 34.4% 38.7% 37.6% 37.0% 38.4% 36.0% 34.2% 34.4% 37.0% 33.6% 37.3% 37.4% 36.4% 34.4% D 22.5% 25.7% 28.8% 22.8% 27.2% 23.0% 24.0% 26.1% 27.4% 24.0% 25.1% 23.0% 23.8% 23.8% 23.9% 23.6% 22.8% E 22.4% 14.3% 13.7% 9.7% 10.4% 10.2% 10.8% 12.4% 12.7% 13.3% 13.9% 14.1% 9.2% 12.5% 8.2% 12.6% 11.3% Nivel Socio-económico ago 09 nov 09 mar 10 jul 10 nov 10 feb 11 jun 11 jul 11 oct 11 dic 11 ene 12 feb 12 mar 12 abr 12 may 12 4/06/12 18/06/12 Alto 2.8% 3.1% 2.9% 4.0% 1.1% 2.3% 2.6% 1.9% 1.5% 2.1% 3.3% 2.0% 2.7% 1.6% 2.9% 3.4% 3.0% Medio 19.8% 21.8% 19.1% 29.2% 22.6% 27.0% 25.6% 21.3% 22.4% 26.3% 23.3% 24.0% 30.7% 24.9% 27.6% 24.0% 28.5% Bajo 77.4% 75.1% 78.0% 66.9% 76.3% 70.7% 71.8% 76.9% 76.1% 71.6% 73.4% 74.1% 66.6% 73.5% 69.6% 72.6% 68.5%