The International Journal of Engineering & Science is aimed at providing a platform for researchers, engineers, scientists, or educators to publish their original research results, to exchange new ideas, to disseminate information in innovative designs, engineering experiences and technological skills. It is also the Journal's objective to promote engineering and technology education. All papers submitted to the Journal will be blind peer-reviewed. Only original articles will be published.
The International Journal of Engineering and Science (The IJES)
1. The International Journal Of Engineering And Science (IJES)
||Volume||2 ||Issue|| 7 ||Pages|| 09-17||2013||
ISSN(e): 2319 – 1813 ISSN(p): 2319 – 1805
www.theijes.com The IJES Page 9
Assessment of the Quality of Water Supplied By Water Vendors to
Households in Sabon-Gari Area of Kano, Northern Nigeria
Bichi, M. H.1*
and Amatobi, D. A.2
1
Department of Civil Engineering, Faculty of Engineering, Bayero University, Kano-Nigeria.2
Yakasai Quarters,
Yankaba Kano.
-------------------------------------------------------ABSTARCT--------------------------------------------------------------
The study involved assessment of the quality of drinking water supplied by water vendors to households in Sabon-
gari area of Kano City in Northern Nigeria. The quality of the water was assessed at commercial sales points,
water vendor’s distribution Jeri-cans and household storage tanks. Ninety (90) water samples were collected at
10 locations spread across Sabon-gari and analyzed for physico-chemical and bacteriological parameters. The
results obtained were compared with standards recommended by the World Health Organization (WHO), the
Nigerian Standard for Drinking Water Quality (NSDWQ) and the European Community (EC). Total Hardness
(as CaCO3); Conductivity and Free Chlorine values were not within acceptable limits in most of the samples.
Colonies of microorganism were in excess amounts in 9 samples while coliform organism was detected in 19
samples. The percentage of colonies of microorganisms was 27%, 43% and 70% for commercial sales points,
hawkers’ Jerry-can, and household storage respectively. Also percentage of samples that tested positive to
coliform organism was 10%, 20%, and 33% for commercial sales points, hawkers’ Jerry-can, and household
storage respectively. Thus it was concluded that water quality was compromised at the private commercial
supply, during hawker’s distribution and in the household storage. It is recommended that the activities of the
water vendors need to be regulated and monitored in order to ensure the protection of the public health.
KEYWORDS: Contamination, Drinking water, Water vendors, Households, Water quality.
----------------------------------------------------------------------------------------------------------------------------------------
Date of Submission: 1 July 2013, Date Of Publication: 20.July 2013
---------------------------------------------------------------------------------------------------------------------------------------------------
I. INTRODUCTION
Water is fundamental to sustenance of life and safe drinking water is so essential that it is recognized as a
basic human right (Anan, 2001). Despite its basic importance, safe drinking water is not readily available to
many households across the world, due to various factors such as increasing population, source pollution and
poor management of water resources. When drinking water becomes scarce many families, especially the poor,
are prone to securing their drinking water in a manner and condition that could endanger their health and general
wellbeing. Studies (UNICEF/WHO, 2004; UNDP, 2006) have point out that the way people secure their drinking
water has a direct impact on their health and on the economic status of the family units. Water secured from a
remote and unprotected source can jeopardize the health of households. Drinking water, defined in the context of
this discussion, is the water which is suitable both for human consumption and for usual domestic uses, including
cooking and personal hygiene (Busari, 2006). People’s right to good life cannot be guaranteed if they do not have
a reliable and a convenient access to safe drinking water. Water is considered a renewable resource but in many
parts of the world, water resources have become so depleted or contaminated that they are unable to meet ever-
increasing demands (UNEP, 2004). The USAID (2005) estimates that over 1.2 billion people (one in every four
people in the developing world) lack access to a safe water supply. According to United Nations estimates, by the
year 2025, up to 20% of the world’s population could live in countries where water is in short supply (WWDR,
2003). Steep increase in population, rise in consumption and the desire for a better living has placed a greater
strain on the security of freshwater supply. Freshwater scarcity manifests in the form of rising demands or water
depletion and water pollution. It is estimated that water use for human purposes has increased six-fold in the past
100 years (UNEP, 2004). Not surprising, reports indicate that the water problem is worse in poor countries, more
especially in sub-Saharan Africa (Population Reports, 1998; UNICEF /WHO, 2000).
The Population Reports (1998) mentioned Nigeria among the countries likely to face water shortages by
the year 2025. The Drinking water availability ranking published in NationMaster.com, placed Nigeria at 116th
position out of 147 countries. In the same report, the Nigeria’s 62% availability was below the global weighted
average of 79% (UNICEF/WHO 2000, cited in NationMaster.com 2008). The United Nations Children's Fund
and World Health Organization also in a joint report raised an alarm over water contamination in Nigeria, noting
2. Assessment Of The Quality Of Water Supplied By Water …
www.theijes.com The IJES Page 10
that more than 70 per cent of water sources in Nigeria are contaminated and injurious to health (UNICEF/WHO,
2005). Matsuura (2003) also reported that water demand in Nigeria far exceeds sustainable supply. Ibiam (2008)
also reported that drinking water supply in Nigeria is grossly inadequate especially in the rural areas. In a survey
conducted by the Federal Ministry of Health, only 15 per cent of villages have adequate and potable drinking
water. The situation in urban areas is also not cheerful. Less than 50% of the 85 million urban dwellers have
“reasonable access to reliable water supply” (FMWR and World Bank, 2000). Both rural and urban areas of Kano
State experience water shortages. According to Kazuare, (2005), less than 20% of the sixty wards in the six
metropolitan local governments of the state have access to potable drinking water.
The providers of water supply services in the low-income areas are: the Kano State Water Board, the
Vendors, the private water supply operators and the hawkers. The Water Board functions include treatment,
distribution and sale of water together with public enlightenment on water conservation. Vendors are the people
that Water Board leases standby water taps from which they sell to individuals. The Private Water Supply
Operators produce water (usually from boreholes equipped with electric submersible pumps) and sell to
individuals and hawkers at the water source site. Water hawkers are individuals who use Jerry-cans (usually
loaded on hand push trucks) to buy water from the vendors or other sources and deliver water to households. This
study is concerned with the assessment of the quality of water supplied by hawkers to households in Sabon-gari
area of Kano in Northern Nigeria.
II. MATERIALS AND METHODS
2.1 Sample Collection
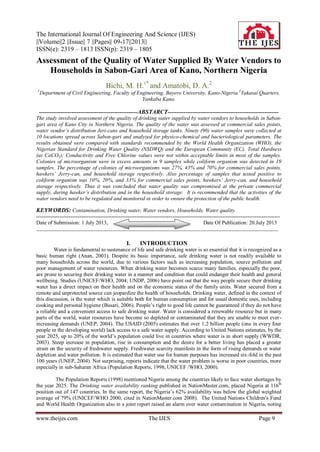
Water samples were collected from 10 drinking water supply locations out of 13 existing major water
source points and were selected to cover the spread of different districts of Sabon-Gari, Kano (Figure I). At each
location a sample (sample A) was taken from a commercial drinking water source, a second sample (sample B)
was taken from the Jerry-can of a water hawker who purchases water from the source and the third sample
(sample C) was collected from household storage where the vendor supplied. Each location was sampled thrice. -
Thus for a location identified with number 1, the samples collected are labeled 1A, 1B, 1C and a total of 90 water
samples were collected and analyzed. The samples were collected in clean sterilized bottles with stopper. Each of
the bottles was rinsed 3 times with the water samples and labeled; indicating the source, date and time of
collection. Clinical hand gloves were used to avoid hand contact. The samples were transferred to the laboratory
and analyzed within 48 hours for Bacteriological tests and 7 days for physico-chemical tests.
Figure 1: Sabon Gari Area, Kano-Nigeria. (Source-Google, 2013)
The analyses were carried out in the laboratories (Civil Engineering, Chemistry department and Central
Laboratory) of Bayero University Kano and the Kano State Water Board Laboratory in Challawa.
3. Assessment Of The Quality Of Water Supplied By Water …
www.theijes.com The IJES Page 11
2.2 Physico-Chemical Tests
2.2.1 Determination of Colour
The colour was determined using Alpha Platinum- Cobalt Standard Range: 0-500 Units and DR /3
Spectrophotometer. Fifty milligrams of demineralized water was filtered and one drop of Triton® x-100 solution
was added to the filtered water in the flask. Without swirling or shaking, 25ml was poured into a clean sample
cell. Fifty milligrams of the water sample was filtered and one drop of Triton x-100 solution was added to the
filtered sample in the flask. Without swirling or shaking, 25ml of the filtered sample was poured into another
clean sample cell. The sample containing the demineralized water was placed into the cell holder and the light
shield was closed. The colour meter scale was inserted into the meter and the wavelength dial adjusted to 455nm.
The mode switch was then set to LEFT SET and the left set adjustment was checked. The mode switch was set to
NORM and the RIGHT SET controls were adjusted for a meter reading of zero colour units. The filtered water
sample was finally placed in the cell holder and the light shield was closed and the units of true colour read.
2.2.2 Determination of Turbidity
Turbidity was determined using Nephelometric Method. The turbidimeter was prepared for operation as
described in the instrument instruction manual by verifying that the calibration has been checked recently with
the turbidimeter standard supplied with the unit and that instrument has been warmed up properly. The
appropriate range was selected and the cell riser installed in the cell holder. A clean sample cell was then filled
with the water sample to 25ml mark. The sample was placed in the instrument and it was covered with the light
shield. The turbidity was then read directly in nephelometric turbidity units (NTU).
2.2.3 Determination of pH
The activated electrode (pH) was standardized with known pH buffer solutions of 4.0, 6.86 and 9.18
respectively. The electrode was rinsed thoroughly with distilled water. The pH values of sample were determined
by dipping the probe in each of the samples and the pH readings obtained electronically.
2.2.4 Determination of Conductivity
Conductivity was determined using a conductivity meter. The meter was switched on and allowed to
warm up for about 15 minutes, and then standardized with 0.01M of KCL solution where a conductivity value of
1413 micro-seimen per centimeter was obtained. The electrode was thoroughly rinsed with distilled water and
then introduced directly into the samples and the conductivity values were obtained.
2.2.5 Determination of Total Hardness
Hardness was determined using EDTA titrometric method. Fifty milligrams of the sample was measured
into a clean beaker and 0.5ml of 0.1N HCL was added. The solution was heated to boil in order to expel CO2,
then cooled to 500
C and 2ml of the buffer solution was added. Two drops of Erischrome T indicator was added
and the solution was titrated with EDTA standard titrant until the colour changed from red to blue and the volume
of EDTA used was recorded. Three tests were carried out per sample. The hardness was then computed as
Total Hardness mg/l CaCO3 =
sample
of
ml
17.8
0.1
1000
f
titrant
EDTA
of
ml
, Where f =
multiplication factor = 1
2.2.6 Determination of Calcium Hardness
Fifty milligrams of sample was measured into clean beaker. One milligram of Sodium Hydroxide
(NaOH) solution was added to the sample. Two drops of Eriochrome T. indicator was then added. The solution
was thoroughly mixed. It was then titrated with EDTA standard titrant until colour changed from purple to violet.
Calcium Hardness as Mg/l CaCO3 =
sample
of
ml
1000
EDTA
of
ml
2.2.7 Determination of Magnesium Hardness
The difference between the total hardness and calcium hardness is the magnesium hardness. i.e. total
hardness - calcium hardness = magnesium hardness.
4. Assessment Of The Quality Of Water Supplied By Water …
www.theijes.com The IJES Page 12
2.2.8 Determination of Chloride
This was determined using Argentometric Method. One hundred milligram of the water sample was put
into a 250ml conical flask. One milligram of the potassium chromate indicator Solution was then added. The
Solution was then titrated with 0.0lM standard Silver Nitrate (AgNO3) Solution until a permanent (golden brown)
colour was obtained at a pH range of 7 to 10. The volume of Silver Nitrate used was then recorded.
Mg/l of Cl -
= ml of Ag NO3 x multiplication factor x 5 where: Multiplication factor = 9.87.
2.2.9 Determination of Nitrate (Nitrogen)
This was determined using spectrophotometric method. The absorbance or transmission was read
against distilled water and set at Zero absorbance or 100% transmission. A wavelength ()גּ of 220 nm to obtain
NO3
-
reading and a גּ of 275 nm to determine interferences due to dissolved organic matter. Subtract 2x the
absorbance (abs) reading at 275 nm from the reading at 220nm to obtain abs due to NO3
-
. Convert this abs. value
to NO3
-
-N from Standard curve by extrapolation.
2.2.10 Determination of Sulphate
This was determined using Turbidimetric method. 100 ml sample was measured into a 250 ml conical
flask and 5 ml of conditioning reagents added. While mixing and stirring, a spoonful of BaCl2 crystals was added
and timing started immediately. The contents were stirred for exactly 1 minute at constant speed. Some of the
solution ws poured into absorption cell and the absorbance read at 425 nm. The SO4
2-
concentration was
determined by extrapolation from the calibration curve.
2.2.11 Determination of Silica
Silico-molybdate Method was used for this determination. A clean sample cell was filled with water
sample to the 25ml mark. The contents of one molybdate reagents powder pillow was added and mixed
thoroughly by swirling. The contents of one acid reagents powder pillow was then added and the solution
thoroughly mixed by swirling. A yellow colour developed when silica and/or phosphate are present. The sample
was then allowed to stand for 10 minutes. Contents of one citric acids powder pillow were added to the sample
and mixed thoroughly by swirling to allow any colour due to the presence of phosphate to disappear. The sample
was allowed for at least two minutes to fully stabilize. Another sample cell was filled with distilled water to the
25ml mark and placed into the cell holder. The light shield was closed. The silica metre scale was inserted into
the meter and the wavelength dial adjusted to 410nm. The mode switch was set to the LEFT SET and the left set
adjustment checked. The mode switch was set to NORM and the RIGHT SET control adjusted for a meter
reading of zero mg/l. The prepared sample was then placed in the cell holder, the light shield closed, and mg/l
silica as (SiO2) read.
2.2.12 Determination of Residual/Free Chlorine
This was done by DPD (N,N Diethyl –p-phenylenediamine) Method. Water sample was taken by filling
a clean sample cell to the 25ml mark. Another sample cell was filled with demineralized water to the 25ml mark
and placed into the cell holder and the light shield closed. The chlorine meter scale was inserted into the meter
and the wavelength dial adjusted to 530nm. The Mode switch was set to LEFT SET and the left set adjustment
checked. The switch was set to NORM and the RIGHT SET controls adjusted for a meter reading of zero mg/L.
The content of one DPD Free Chlorine Reagent powder pillow was added to the test sample and shaken several
times to mix. A red colour developed when chlorine was present. The prepared sample was then placed in the cell
holder, the light shield closed, and the mg/l chlorine read.
2.2.13 Determination of Chemical Oxygen Demand
Dichromate Reflux Method was used. 100ml of water sample was measured into an Erlenmeyer flask,
2ml of 8% sodium hydroxide added and boiled. 10ml of KMnO4 solution was added and the boiling continued
for 10 minutes. 10ml of oxalic acid was added, mixed and the excess oxalic acid titrated with potassium
permanganate.
O2 (COD) mg/l =
sample
of
ml
1000
0.08
KMnO
0.01N
of
ml 4
, Where ml of sample = 100ml
2.3 Metals Analysis
2.3.1 Digestion of Water Samples
A measured volume of 5ml of HCL was added to each of the measured water samples in a beaker and
heated on a hot plate in a fume cupboard until the volume was reduced to about 20ml. It was then cooled, filtered
and the volume made up to 100ml mark with distilled water in a volumetric flask (ASTM, 2004).
5. Assessment Of The Quality Of Water Supplied By Water …
www.theijes.com The IJES Page 13
2.3.2 Determination of Mg, Fe, Mn, Ni, Zn, Pb, Cr and Cu
AAS Method was used. For each sample, 100ml was digested. A hollow cathode lamp of the desired
metal was installed into the AAS machine and the wavelength characteristics of that metal set. The slit width and
the amount of current applied to the hollow cathode lamp were all set according to manufacturer’s instruction.
The instrument was then switched on and allowed to warm up until the energy source stabilized. The oxidant and
fuel gases (air and acetylene) were then allowed to flow and then ignited while the flow rates were adjusted as
specified by the manufacturer. Acidified distilled water (1.5ml HNO3 /l and specific gravity 1.42) was then
aspirated and the aspiration rate adjusted after which the instrument was set at zero. The blank and the digested
sample solution were all aspirated one after the other and the absorbances obtained recorded. Concentration of
the analytes in mg/l of the digested samples were obtained by extrapolation from the calibration curve prepared
(APHA,1990).
2.3.3 Determination of Na, K and Ca.
Flame Photometric Method. 100ml each of water sample was digested. Blank sample was also digested
by the same method. Calibration standard of 2, 4, 6, 8, and 10 mg/l for Sodium and Potassium were prepared,
while 5, 10, 15, 20, 25 and 30 mg/l for Calcium were also prepared for each metal. The absorbance of the
samples, calibration standards and the blank were then measured and recorded. The concentration of the metals
was calculated from calibration curves by extrapolation (APHA, 1990).
2.4 Bacteriological Examination of Water Samples
The colonies of micro-organism present in the water samples were examined using the nutrient agar
plate count method. One hundred and twenty eight grams of nutrient agar was added to 1 litre of distilled water in
a round bottom flask and allowed to soak for 15 minutes. The media was sterilized for 15 minutes at a
temperature of 1300
C in an autoclave. The sterilized media was mixed well by swirling and cooled to below 200
C
in a refrigerator.
2.4.1 Determination of Total Bacterial Colonies
Each original water sample was diluted with distilled water. One milligram of each diluted sample was
placed in a separate Petri-dish. The sterile prepared nutrient agar was raised to the temperature of about 420
C.
Ten milligrams of the sterile agar was added to each Petri-dish, under flame. The contents were mixed thoroughly
by tilting and rotating and allowed to solidify. Each Petri-dish was placed in an incubator set at 370
C for 48
hours. The white spots in the dishes indicate the presence of colonies and was counted using colony counter.
2.4.2 Coliform Examination
The media was prepared by dissolving forty grams of Mconkey Broth in 1 litre of distilled water and
mixed thoroughly. Fifty milligrams of the Mconkey Broth was put into a round bottom flask. Ten milligrams
each of the dissolved Mconkey Broth was put into five test tubes. The content of the round bottom flask and the
five test tubes were sterilized and allowed to cool to room temperature. Fifty milligrams of water sample was
added into round bottom flask containing 50ml of Mconkey Broth. Ten milligrams of water sample each was
added into 5 test tubes containing 10ml each of Mconkey Broth under flame. The contents of both the round
bottom flask and the tubes were incubated at 370
C for 48 hours. The presence of coli form was observed by
checking for any colour change from purple to yellow. The number of coliform was estimated using probability
table for Coliform organisms (Punmia et al, 1995).
2.4.3 E-coli Examination.
The media was prepared by adding 36.5g of Endo-Agar to 1 litre of distilled water and soaked for 15
minutes. The mixture was sterilized in an autoclave for 15 minutes at 1300
C. The sterilized Endo-Agar was
mixed thoroughly, distributed into Endo-Agar plates and allowed to solidify. Each subculture tube which tested
positive for coliform was placed onto Endo-Agar plates. The Endo-Agar plates were incubated for 24 hours at
370
C. The presence of E-coli was checked by observing the colour of the incubated agar. The presence of E-coli
raises the colour of the Endo-Agar to deep red, which colours the surrounding medium and possess a golden
metallic sheen. Absence of E-coli indicates no colour change of the endo-agar.
III. RESULTS AND DISCUSSIONS
Tables 1, 2 and 3 show a summary of the results for physic-chemical parameters of the water from the
supply point, water vendors, and households respectively.
7. Assessment Of The Quality Of Water Supplied By Water …
www.theijes.com The IJES Page 15
s/no Parameters Mean standard dev
WHO
(2004)limits
NSDWQ
(2007) limits
EC(1980)
limits
1 Colour (TCU) 5 0 15 15 20
2 PH 6.68 0.23 6.5-8.4 6.5-8.5 9.5
3 Cond. µS/cm 1642.67 819.16 NS 1000 NS
4 Turbidity NTU 2.67 0.79 5 5 NS
5 C.O.D (mg/l) 12.37 1 NS NS NS
6 F. Chlorine (mg/l) 0.12 0.04 NS 0.2-0.25 NS
7 Total Hardness (mg/l) 625.27 260.48 500 150 NS
8 Calcium Hardness (mg/l) 506.67 192.21 NS NS NS
9 Magnesium Hardness(mg//l) 118.6 106.73 NS NS NS
10 Chloride-CL(mg/l) 242.3 72.02 250 250 NS
11 silica (mg/l) 0.89 0.1 NS NS NS
12 Nitrate (mg/l) 3.3 1.68 50 50 50
13 Sulphate (mg/l) 6.92 5.84 250 100 250
14 Zn(mg/l) 1.6 0.6 3 3 5
15 Cu(mg/l) 0.56 0.2 2 1 3
16 Mg(mg/l) 53.8 22.75 150 0.2 50
17 Fe(mg/l) 0.27 0.07 0.3 0.3 0.2
18 Cr(mg/l) 0.04 0.02 0.05 0.05 0.05
19 Mn(mg/l) 0.08 0.02 0.1 0.2 0.5
20 Ni(mg/l) 0.01 0.01 0.02 0.02 0.05
21 Pb(mg/l) 0.01 0 0.01 0.01 0.1
22 Na(mg/l) 9.7 3.44 200 200 150
23 K(mg/l) 3.93 2.77 NS NS 12
24 Ca(mg/l) 7.5 6.2 NS NS NS
Note: NS- Not specified
The results were compared with the acceptable limits for drinking water recommended by Word Health
Organization (WHO, 2004), the Nigerian Standard for Drinking Water Quality (NSDWQ, 2007) and European
Community (EC, 1980). All the physico-chemical parameters fall within the acceptable limits of the World
Health Organization (WHO), Nigerian Standard for Drinking Water Quality (NSDWQ) and the European
Community (EC), except Total Hardness, Conductivity and free or residual Chlorine. Water samples in the study
area were found to be generally very hard with conductivity above 1000 µS/cm. The high hardness content
could be due to the nature of the geology of the area. This will impact on the taste of water and its ability to
encourage foaming of soap. Residual Chlorine values which were found to be less than the recommended
0.2mg/l will make the water more vulnerable to contamination.-Tables 4, 5 and 6 show the results of the
bacteriological examination for the water samples collected from supply points, water vendors, and households
respectively.
Table 4: Summary of Bacteriological parameters for sampled drinking water from private (commercial) supply in
Sabon-Gari Kano with WHO, NSDWQ and EC limits
S/no SampleNo Mean standardDev WHO(2004) NSDWQ(2007) EC(1980)limits
1
Colonies Per CC Growing
on Nutrient Agar at 370c
for 48 Hours (cfu/ml) 1.6 3.3 10 10 10
2
MPN ofColiform
Organism Per 100mls of
water Sample (cfu/100ml) 0.13 0.43 0 0 0
3
MPN E-Coli Organisms
Per 100mls water Sample
(cfu/100ml) 0 0 0 0 0
Table 5: Summary of Bacteriological parameters for sampled drinking water from hawkers in Sabon-gari Kano
with WHO, NSDWQ and EC limits
8. Assessment Of The Quality Of Water Supplied By Water …
www.theijes.com The IJES Page 16
s/no Parameters Mean Standard dev WHO(2004) NSDWQ(2007) EC(1980) limits
1
Colonies Per CC Growing
on Nutrient Agar at 370c
for 48 Hours (cfu/mL) 2.63 3.78 10 10 10
2
MPN of ColiformOrganism
Per 100mls of water Sample
(cfu/100mL) 0.37 0.75 0 0 0
3
MPN E-Coli Organisms Per
100mls water Sample
(cfu/100mL) 0 0 0 0 0
Table 6: Summary of Bacteriological parameters for sampled drinking water from household storage in Sabon-
Gari Kano with WHO, NSDWQ and EC limits
s/no Parameters Mean standard dev
WHO(2004)
limits
NSDWQ
(2007) limits EC(1980) limits
1
Colonies Per CC Growing
on Nutrient Agar at 370c
for 48 Hours (cfu/mL) 4.3 4.37 10 10 10
2
MPN of Coliform
Organism Per 100mls of
water Sample
(cfu/100mL) 0.57 0.84 0 0 0
3
MPN E-Coli Organisms
Per 100mls water Sample
(cfu/100mL) 0 0 0 0 0
Traces of colonies of microorganisms and coliform were found in some of the samples with increasing
magnitude as the water moved from commercial source through the hawker to household storage. The percentage
of colonies of microorganisms was 27%, 43% and 70% for commercial sales points, hawkers’ Jerry-can, and
household storage respectively. Also the percentage of samples that tested positive to coliform organism was
10%, 20%, and 33% for commercial sales points, hawkers’ Jerry-can, and household storage respectively. Thus
it was found that water quality was compromised at the private commercial supply, during hawker’s distribution
and in the household storage.-The hygienic conditions of most boreholes/sales points where the hawkers obtain
drinking water were also found to be very poor. There were cases where the borehole areas were littered with
debris and waste; the borehole head were open and filled with dirty stagnant water. Some boreholes were too
close to septic tank in residential house or to power house with fuming generator exhaust. None of the water
supply sources was adequately fenced or protected to prevent fecal contamination by man or animals.-Most of the
drinking water hawkers in the area exhibit lack of proper knowledge on good hygiene and water safety. This was
evident in the manner they handled the water and their appearance.
IV. CONCLUSION AND RECOMMENDATIONS
4.1 Conclusion
The sources of drinking water in Sabon-gari are primarily boreholes and Water Board standby tanks, and
the households depend mostly on water hawkers for their drinking water supply. This is because pipe borne
water through functional public water mains is virtually non-existent in the area. The hawkers procure water
largely from private commercial boreholes and a few water board standby tank operators. The hawkers then
supply the water to the households from Jerry-cans loaded on hand push trucks.
9. Assessment Of The Quality Of Water Supplied By Water …
www.theijes.com The IJES Page 17
Traces of colonies of microorganisms and coliform were found in some of the samples with increasing
magnitude as water moved from commercial source through the hawker to household storage. Thus it was found
that water quality was compromised at the private commercial supply, during hawker’s distribution and in the
household storage.
4.2 Recommendations
The importance of safe drinking water to the wellbeing of every individual cannot be over-emphasized.
Unclean or unprotected water can be a veritable source of infection and propagation of diseases.
In view of the overall findings in the study area the following recommendations are deemed appropriate.
[1] The health and water regulatory agencies should ensure that all commercial drinking water suppliers are
not only licensed but are also trained regularly on water safety and personal hygiene.
[2] The agencies should carry out regular inspection to ensure that water supply areas are tidy and are
adequately protected to prevent contamination of drinking water by human or animal fecal wastes.
[3] Water sales operators should be discouraged from citing boreholes/water sales points near septic tanks or
close to generator exhaust. They should be required to dose Chlorine to a level of 0.2mg/l in drinking
water sold to the public.
[4] There is a need for public enlightenment for water hawkers and households in the study area on personal
hygiene, handling and storage of drinking water. Households should boil their water before drinking
especially water from outside public mains.
[5] The water supply agency should endeavour to restore or build adequate and functional public water
infrastructure such that portable water could be supplied to all households in the area through water pipes.
[6] Further research on water quality in the area could look into drinking water quality under household
storage conditions.
REFERENCES
[1] Anan, K. (2001): Message of UN Secretary-General Kofi Anan on World Water Day.
[2] UNICEF/WHO (2004): Meeting the MDG drinking water and sanitation target: a mid-term assessment of progress. United Nations
Children's Fund/World Health Organization, New York.
[3] UNDP (2006): Human development report: beyond scarcity: power, poverty and the global water crisis. United Nations
Development Programme. New York: Palgrave Macmillan
[4] Busari, O. (2006): Rural water quality guidelines and rationale: case study from Swaziland. Available
at:http://www.dbsa.org/Research/Documents/RURAL%20Water%20Quality%20Guidelines%20and%20Rationale.doc [Assessed 5
April 2008].
[5] UNEP (2004): Challenges of water scarcity. United Nations Environmental Programme. Washington.
[6] USAID (2005): Investments in drinking water supply projects and related activities in 2005. The United States Agency for
International Development Washington D, C.
[7] WWDR (2003): Mitigating risks and coping with uncertainty. United Nations World Water Development Report, Paris:
[8] Population Report (1998): Solutions for a water-short world. Population Information Program, Center for Communication
Programs, USA. The Johns Hopkins School of Public Health, Vol. 26, Number 1.
[9] UNICEF/WHO (2000): Global water supply and sanitation assessment 2000 report. United Nations Children Fund and World
Health Organization.
[10] NationMaster.com (2008): Drinking water availability ( % most recent) by country. Available at:
http://www.who.int/ipcs/publications/newsletters/en/04.pdf [Assessed 10 July 2008].
[11] UNICEF/WHO (2005): Joint report on drinking water quality in Nigeria. United Nations Children Fund and World Health
Organization.
[12] Matsuura, K. (2003): while demand is growing dramatically at an unsustainable rate, water supplies are falling…. An address
delivered at the opening session of the intergovernmental ministerial conference at the Third World Water Forum, Kyoto, Japan.
[13] Ibiam, A. (2008): Watch what water you’re drinking. Thisday Newspapers Lagos. May 20.
[14] FMWR (2000);“National Water Supply and Sanitation Policy”, Department of Water Supply and Quality Control, FMWR, Abuja.
[15] Kazuare, U. (2005) : Kano State Water Board present situation problems and the way out. Seminar paper; Technical Session,
Nigerian Society of Engineers, Kano Branch.
[16] APHA (1990); Standard Method for the Examination of Water and Waste Water, 18th ed., American Public Health Association.
[17] Punmia, B., Ashok, J., and Arun, J., (1995): Water supply engineering. New Delhi: Laxmi Publications ltd.
[18] WHO (2004): Guidelines for drinking-water quality. World Health Organization Geneva Vol.1: 3 ed. ISBN 92 4 154638 7
[19] NSDWQ (2007): Nigerian standard for drinking water quality. Standard Organization of Nigeria. Wuse, Abuja.