
Recomendados
Recomendados
Más contenido relacionado
Similar a Educational Psychology 565 Practice Quiz(use α = .05 unl.docx
Similar a Educational Psychology 565 Practice Quiz(use α = .05 unl.docx (20)
Más de toltonkendal
Más de toltonkendal (20)
Último
Último (20)
Educational Psychology 565 Practice Quiz(use α = .05 unl.docx
- 1. Educational Psychology 565 Practice Quiz (use α = .05 unless otherwise stated). 1. A small school district wants to know what type of teaching/learning is most effective at helping students learn to read. Three methods are proposed (top-down, bottom-up, and interactive). It is believed that the gender of the teacher may also be important in student learning, so the study also aims to determine if gender of the teacher is important. There are 12 schools in the district, and each school has 1 second grade class (each class has 10 students). Two female teachers and two male teachers’ classrooms are randomly assigned to each of the three methods (all 12 teachers have just been hired in the district). At the end of the year, the students all took a 100 item standardized multiple-choice reading test called the “EZreading” test (note: the analysis was performed at the student level). Coding: teachgender = gender of teacher: 1= men, 2 = women Teachmeth = teaching method (1=top-down, 2=bottom-up, 3=interactive) EZread = scores on the Ezread reading test Use SPSS output “SPSS printout for question 1”to help answer the parts below. a. What is/are the independent variable(s) in this experiment (Be specific)? What level of measurement is/are the IV(s)? Explain why?
- 2. b. What is/are the dependent variable(s) in this experiment (Be specific)? What level of measurement is/are the DV(s)? Explain why? c. State the null hypotheses and alternative hypotheses for the factors and the interaction in symbols and words. d. Do you think the assumption of homogeneity of variance has been met? Support your answer. e. Do you think the assumption of independence has been met? Support your answer. f. Calculate Cohen’s d for the difference between the top-down
- 3. and interactive methods. Explain what Cohen’s d means for this comparison. g. Is the interaction of the two factors statistically significant? Explain your answer. h. Report the results of the study along with an interpretation for the results. You do not need to write up the results like a results section; you can just report the findings with statements about each factor and the interaction of the two factors. Be sure to cite evidence from your analysis. i. Based on the results of the study what would you recommend about teaching method and gender of teachers? 2. Answer the following questions.
- 4. Source SS df MS F Between 100 20 Within 2 50 Total 200 7 a. Complete the ANOVA source table (fill in all blank spaces) b. How many people are in this study. (hint: use degrees of freedom) c. What is the critical F at α = .01? Would you reject the null
- 5. hypothesis? Explain your answer. d. What are the critical F at α = .05? Would you reject the null hypothesis? Explain your answer. e. Why do the conclusions from items c and d differ? Explain your answer in terms of Type I and II errors. 3. A researcher wants to know whether there are differences between two teaching techniques and baseline in improving
- 6. math skills. Due to economic considerations he could not use a between-subjects design. Therefore, he measured participants’ math skills at baseline, gave them teaching method A for two weeks and measured their math skills, and then gave them teaching method B for two weeks and measured their math skills. On the measure low scores indicated low math skills. Using the provided SPPS output to answer the following questions: a. Was the assumption of sphericity met? Explain your answer. b. According to the omnibus test was there a difference between baseline and/or the methods. Explain your answer. c. Using the output from the pairwise comparisons. Explain which levels of the within-subjects factor differ. d. What is the primary weakness of this design? SPSS printout for question 1.
- 7. 1. Teachmeth 2. Teachgender 3. Teachmeth * Teachgender SPSS printout for question 3.
- 8. 5 Estimates Dependent Variable: Ezread 74.025 1.612 70.831 77.219 70.225 1.612 67.031 73.419 64.750 1.612 61.556 67.944 Teachmeth 1 2 3 Mean Std. Error Lower Bound Upper Bound 95% Confidence Interval Pairwise Comparisons Dependent Variable: Ezread 3.800 2.280 .098 -.717 8.317
- 10. (I) Teachmeth 1 2 3 Mean Difference (I-J) Std. Error Sig. a Lower Bound Upper Bound 95% Confidence Interval for Difference a Based on estimated marginal means The mean difference is significant at the .05 level. *. Adjustment for multiple comparisons: Least Significant Difference (equivalent to no adjustments). a. Estimates Dependent Variable: Ezread 70.083 1.316 67.475 72.691 69.250 1.316 66.642 71.858 Teachgender 1 2 Mean Std. Error
- 11. Lower Bound Upper Bound 95% Confidence Interval Pairwise Comparisons Dependent Variable: Ezread .833 1.862 .655 -2.855 4.522 -.833 1.862 .655 -4.522 2.855 (J) Teachgender 2 1 (I) Teachgender 1 2 Mean Difference (I-J) Std. Error Sig. a Lower Bound Upper Bound 95% Confidence Interval for Difference a Based on estimated marginal means Adjustment for multiple comparisons: Least Significant Difference (equivalent to no adjustments). a.
- 13. 3 Mean Std. Error Lower Bound Upper Bound 95% Confidence Interval Pairwise Comparisons Dependent Variable: Ezread .250 3.225 .938 -6.138 6.638 -.250 3.225 .938 -6.638 6.138 .750 3.225 .817 -5.638 7.138 -.750 3.225 .817 -7.138 5.638 1.500 3.225 .643 -4.888 7.888 -1.500 3.225 .643
- 14. -7.888 4.888 (J) Teachgender 2 1 2 1 2 1 (I) Teachgender 1 2 1 2 1 2 Teachmeth 1 2 3 Mean Difference (I-J) Std. Error Sig. a Lower Bound Upper Bound 95% Confidence Interval for Difference a Based on estimated marginal means Adjustment for multiple comparisons: Least Significant Difference (equivalent to no adjustments). a. Teachgender
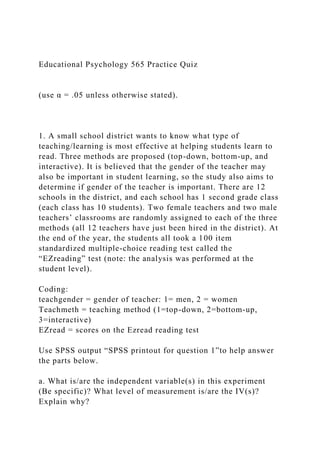
- 15. FemaleMale Estimated Marginal Means 75 72.5 70 67.5 65 3 2 1 Teachmeth Estimated Marginal Means of Ezread Mauchly's Test of Sphericity b Measure: MEASURE_1 .980 .062 2 .970 .980 1.000 .500 Within Subjects Effect factor1 Mauchly's W Approx. Chi-Square df Sig. Greenhous e-Geisser Huynh-Feldt Lower-bound Epsilon a Tests the null hypothesis that the error covariance matrix of the
- 16. orthonormalized transformed dependent variables is proportional to an identity matrix. May be used to adjust the degrees of freedom for the averaged tests of significance. Corrected tests are displayed in the Tests of Within-Subjects Effects table. a. Design: Intercept Within Subjects Design: factor1 b. Tests of Within-Subjects Effects Measure: MEASURE_1 11.200 2 5.600 5.508 .031 11.200 1.960 5.714 5.508 .032 11.200 2.000 5.600 5.508 .031 11.200 1.000 11.200 5.508 .079 8.133 8 1.017 8.133 7.840
- 17. 1.037 8.133 8.000 1.017 8.133 4.000 2.033 Sphericity Assumed Greenhouse-Geisser Huynh-Feldt Lower-bound Sphericity Assumed Greenhouse-Geisser Huynh-Feldt Lower-bound Source factor1 Error(factor1) Type III Sum of Squares df Mean Square F Sig. Estimates Measure: MEASURE_1 4.400 .600 2.734 6.066 4.000 .548 2.479 5.521 6.000 .316
- 18. 5.122 6.878 factor1 Baseline Method A Method B Mean Std. Error Lower Bound Upper Bound 95% Confidence Interval Pairwise Comparisons Measure: MEASURE_1 .400 .600 .541 -1.266 2.066 -1.600 .678 .078 -3.483 .283 -.400 .600 .541 -2.066 1.266 -2.000 * .632 .034 -3.756 -.244 1.600 .678
- 19. .078 -.283 3.483 2.000 * .632 .034 .244 3.756 (J) factor1 2 3 1 3 1 2 (I) factor1 1 2 3 Mean Difference (I-J) Std. Error Sig. a Lower Bound Upper Bound 95% Confidence Interval for Difference a Based on estimated marginal means The mean difference is significant at the .05 level. *. Adjustment for multiple comparisons: Least Significant Difference (equivalent to no
- 20. adjustments). a. Between-Subjects Factors 40 40 40 60 60 1 2 3 Teachmeth 1 2 Teachgender N Tests of Between-Subjects Effects Dependent Variable: Ezread 1767.967 a 5 353.593 3.400 .007 582413.333 1 582413.333 5600.742 .000 1739.217 2 869.608 8.363 .000 20.833 1
- 21. 20.833 .200 .655 7.917 2 3.958 .038 .963 11854.700 114 103.989 596036.000 120 13622.667 119 Source Corrected Model Intercept Teachmeth Teachgender Teachmeth * Teachgender Error Total Corrected Total Type III Sum of Squares df Mean Square F Sig. R Squared = .130 (Adjusted R Squared = .092) a. Levene's Test of Equality of Error Variances a Dependent Variable: Ezread
- 22. .010 5 114 1.000 F df1 df2 Sig. Tests the null hypothesis that the error variance of the dependent variable is equal across groups. Design: Intercept+Teachmeth+Teachgender+ Teachmeth * Teachgender a. MAT 312 Test 2 Chapters 8, 9 & 12 (180 Total Points) Show All Work! Name:_______________ 1. Construct a 95% confidence interval for the mean of a normal population if a random sample of size 60 from the population yields a sample mean of 90 and the population has a standard deviation of 10. What is the confidence interval and margin of error (10 points)? 2. Forty panels were exposed to various corrosive conditions to measure the protective ability of paint. The mean life for the samples was 112 hours. The life of the paint samples is assumed to be normally distributed with a population standard deviation of 25 hours. Find the 85% confidence interval and margin of error for the mean life of the paint (10 points). 3. Construct a 98% confidence interval for the mean of a normal population assuming that the values listed below comprise a
- 23. random sample taken from the population. The population standard deviation is unknown. Also, what are the mean and sample standard deviation (15 points). 22 30 15 9 2 4 27 16 29 4. Suppose you sample 19 baseball pitchers and find that they have an average pitching speed of 87 mph with a standard deviation of 0.98 mph. Find a 95% confidence interval for the average pitching speed of all pitchers (10 points). 5. A tire manufacturer is testing the tire pressure in its new tires. A random sample of 10 tire pressure readings, yield a variance of 31.8. Construct and interpret a 95% confidence interval for the variance (10 points). 6. Find the t – value such that .025 area of the area under the curve is to the left of the t – value. Assume the degree of freedom is 100 (5 points). 7. Find tα/2,n-1 for area two tails the following combinations of α and n (5 points each): a. α=.05, n=25 b. α=.20, n=3 8. Find zα/2 for the following confidence levels (5 points each):
- 24. a. 80% b. 70% 9. Find zα/2 for the following levels of α (5 points each): a. α=.66 b. α=.30 10. A state politician is interested in knowing how voters in rural areas and cities differ in their opinions about gun control. For his study, 80 rural voters were surveyed, and 47 were found to support gun control. Also, 80 voters from the cities were surveyed, and 59 of these voters were found to support gun control. Construct and interpret a 90% confidence interval and margin of error for the true difference between the proportion of rural and city voters who favor gun control (10 points). 11. John believes that his wife’s cell phone battery does not last as long as his cell phone battery. On eight different occasions, he measured the length of time his cell phone battery lasted, and calculated that the mean was 26.9 hours with a standard deviation of 6.5 hours. He measured the length of time his wife’s cell phone battery lasted on nine different occasions and calculated a mean of 24.1 with a standard deviation of 8.9. Construct and interpret a 95% confidence interval for the true difference in battery life between John’s cell phone and his wife’s cell phone. (10 points each) a. Assume the population variances are the same b. Assume the population variances are different 12. Students from two different schools took the same standardized test. From school A, a random sample of 53 students had a mean score of 80. From school B, a random sample of 44 students had
- 25. mean score of 84. Assume the population standard deviations are 9 for school A and 5 for school B. Construct and interpret a 90% confidence interval for the true difference between the mean test scores of the two schools. Also, what is the point estimate? (15 points) 13. A dietician wants to see how much weight a certain diet can help her 9 patients lose. She weighs each patient before and 45 days later. Her results are in the table. Construct and interpret a 98% confidence interval and calculate the paired differences for the true mean difference between the weights to determine the mean amount of weight lost by going on this diet (15 points). Patients’ Weights (in Pounds) Starting Weights 164 189 205 155 139 224 268 186 151 Ending Weights 157 178 191 152 137 207 249 173 146 d
- 26. 14. A teacher wants to have his students in two different classes evaluate his teaching on a scale of 1-10 with 10 being excellent. The results of the first class with 18 students was a mean of 5.8 with a standard deviation of 1.2, and the second class with 15 students was a mean of 7.2 with a standard deviation of 1.5. Construct and interpret a 95% confidence interval to estimate a true difference between the two classes. Assume that the population variances are different (10 points). 15. For the data below, complete the following (20 points): Age 34 43 49 51 65 Bone Density 946
- 27. 875 804 723 691 a. Draw a scatter plot b. Estimate the correlation in words (positive, negative, or none) c. Explain your estimation d. Calculate the correlation coefficient (r-value) e. Explain what the correlation coefficient (r) tells about the data f. Calculate the coefficient of determination (r2) g. Explain what the coefficient of determination tells about the data h. Calculate the least-squares regression line (line of best fit) i. Predict the bone density at age 56