F500 Social Media Growth
•
1 recomendación•265 vistas

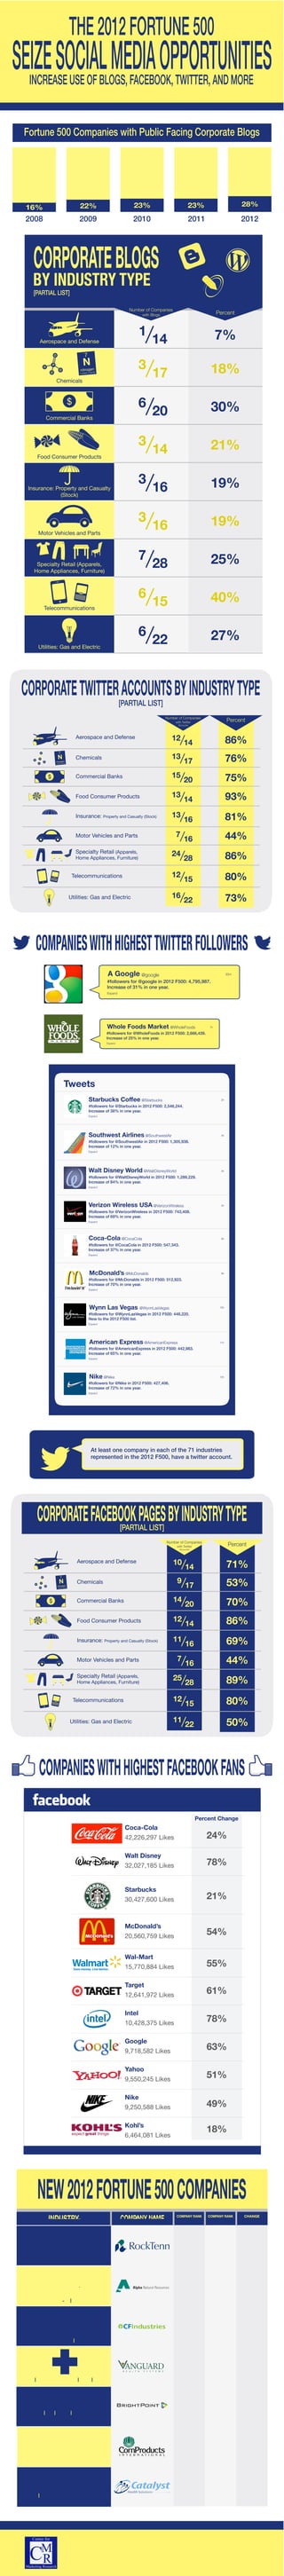
The document shows statistics on social media followers for companies in the 2012 Fortune 500. It provides the number of followers for each company's Twitter account, as well as the percentage increase from the previous year. At least one company from each of the 71 industries in the 2012 F500 has a Twitter account. It also shows the number of Facebook likes for several major companies and the percentage increase from the previous year.
Recomendados

Recomendados
Más contenido relacionado
Similar a F500 Social Media Growth
Similar a F500 Social Media Growth (20)
F500 Social Media Growth
- 1. 1 7% 14 3 18% Chemicals 17 6 30% Commercial Banks 20 3 21% Food Consumer Products 14 3 19% 16 3 19% Motor Vehicles and Parts 16 7 25% 28 6 40% Telecommunications 15 6 27% Utilities: Gas and Electric 22 12 86% 14 Chemicals 13 76% 17 Commercial Banks 15 75% 20 Food Consumer Products 13 93% 14 Insurance: 13 81% 16 Motor Vehicles and Parts 7 16 44% 24 86% 28 Telecommunications 12 80% 15 Utilities: Gas and Electric 16 73% 22 A Google @google 30m #followers for @google in 2012 F500: 4,795,987. Increase of 31% in one year. Expand Whole Foods Market @WholeFoods 1h #followers for @WholeFoods in 2012 F500: 2,666,439. Increase of 25% in one year. Expand Tweets Starbucks Coffee @Starbucks 2h #followers for @Starbucks in 2012 F500: 2,546,244. Increase of 38% in one year. Expand Southwest Airlines @SouthwestAir 4h #followers for @SouthwestAir in 2012 F500: 1,305,938. Increase of 12% in one year. Expand Walt Disney World @WaltDisneyWorld 4h #followers for @WaltDisneyWorld in 2012 F500: 1,289,229. Increase of 84% in one year. Expand Verizon Wireless USA @VerizonWireless 5h #followers for @VerizonWireless in 2012 F500: 743,408. Increase of 69% in one year. Expand Coca-Cola @CocaCola 9h #followers for @CocaCola in 2012 F500: 547,343. Increase of 37% in one year. Expand McDonald’s @McDonalds 9h #followers for @McDonalds in 2012 F500: 512,923. Increase of 70% in one year. Expand Wynn Las Vegas @WynnLasVegas 10h #followers for @WynnLasVegas in 2012 F500: 448,220. New to the 2012 F500 list. Expand American Express @AmericanExpress 11h #followers for @AmericanExpress in 2012 F500: 442,983. Increase of 65% in one year. Expand Nike @Nike 12h #followers for @Nike in 2012 F500: 427,406. Increase of 72% in one year. Expand At least one company in each of the 71 industries represented in the 2012 F500, have a twitter account. 10 71% 14 Chemicals 9 53% 17 Commercial Banks 14 70% 20 Food Consumer Products 12 86% 14 Insurance: 11 69% 16 Motor Vehicles and Parts 7 16 44% 25 89% 28 Telecommunications 12 80% 15 Utilities: Gas and Electric 11 50% 22 Percent Change Coca-Cola 42,226,297 Likes 24% Walt Disney 32,027,185 Likes 78% Starbucks 30,427,600 Likes 21% McDonald’s 20,560,759 Likes 54% Wal-Mart 15,770,884 Likes 55% Target 12,641,972 Likes 61% Intel 10,428,375 Likes 78% Google 9,718,582 Likes 63% Yahoo 9,550,245 Likes 51% Nike 9,250,588 Likes 49% Kohl’s 18% 6,464,081 Likes 449 669 +220 Packaging, Containers 356 545 +189 Mining, Crude-Oil Production 402 539 +137 Chemicals 484 611 +127 Health Care: Medical Facilities Wholesalers: Electronics 463 582 +119 390 502 +112 Food Production 455 562 +107 Health Care: Pharmacy and Other Services