SlideShare una empresa de Scribd logo
1 de 30
Descargar para leer sin conexión
January 7, 2010                                                                              Theodore Kundtz • tkundtz@needhamco.com • 212-705-0380
                                                                                                     Edwin Mok • emok@needhamco.com • 415-262-4896
                                                                                               Vernon P. Essi, Jr. • vessi@needhamco.com • 212-705-0948
                                                                                                Sean Hannan • shannan@needhamco.com • 212-705-0106
                                                                                              James Ricchiuti • jricchiuti@needhamco.com • 212-705-0381
                                                                                                   Conor Irvine • cirvine@needhamco.com • 415-262-4868


                                                                                                                     Clean Technology Monthly

 Needham & Co. Clean Technology Monthly
 Highlights for the Month of December
This month, we highlight our recent Clean Tech research, including Edwin Mok’s Solar PV Industry Update and
initiation of AEIS as well as Sean Hannan’s initiation of Itron. Our “DOE Watch” tracks recent DOE spending and
our “Green Gossip” section analyzes recent developments in regulation and legislation. We also review recent
and upcoming Clean Tech deal activity. The Needham & Co. Clean Technology Indices: Energy Creation, Energy
Efficiency and Environmental Sciences & Services increased 5.73%, 8.35% and 3.55%, respectively, in December.

 •   Sean Hannan initiated coverage on Itron, Inc. with a Hold rating. Itron is a leading technology provider of
     meters and related solutions for electric, gas and water utility applications. Edwin Mok initiated coverage on
     Advanced Energy Industries, Inc. with a Buy rating and a $16 12-month price target and upgraded Sunpower
     to Buy with a price target of $32.

 •   The DOE announced a series of awards in December, highlighted by $979 million for carbon capture and
     sequestration (CCS), $564 million to fund 19 biorefineries and $60 million for the interconnection of the
     national smart grid. Approximately $9.2 billion remains available in DOE funding through ARRA for clean
     technologies.

 •   Despite the majority of popular media’s belief that all was lost at the Copenhagen Climate Change
     Conference last month, we see the Conference as an important and successful event for the clean
     technology industry due to its focus on mobilizing approximately $830 billion over the next ten years in
     clean technology and deforestation support for developing countries. While the conference failed to
     produce legally-binding GHG reduction targets, we are encouraged by the EPA’s apparent readiness to
     monitor GHG, which it now deems a danger to public health - an announcement that was well received by
     clean tech investors.

 •   Deal activity leveled off in December with 44 M&A announcements; down four from November and nine less
     then were announced in December 2008. There were three clean tech IPOs in December, up from 2 in
     November and zero during the same month last year. We are optimistic for the clean tech IPO market as
     investor interest for the upcoming Solyndra IPO appears to be high.

 •   The Needham & Co. Energy Efficiency Index rose 8.35% in December, outperforming the S&P 500, which
     rose by 1.78%. The Needham & Co. Energy Creation and Environmental Sciences & Services Indices also
     outperformed the S&P 500, both increasing by 5.73% and 3.55%, respectively.

Figure 1: Needham & Co. Clean Tech Vertical Indices – 11/30/09 – 12/31/09
                                                                                        110
               Energy Creation Index                        Energy Ef f iciency Index
               Environmental Sciences & Services Index      S&P 500                                    Energy
                                                                                        108                                                    8.35%
                                                                                                      Effic iency


                                                                                        106
                                                                                                E nergy Creation                     5.73%
                                                                                        104
                                                                                                  Environmental
                                                                                        102        Sc ienc es &              3.55%
                                                                                                    Servic es
                                                                                        100
                                                                                                       S&P 500       1.78%
                                                                                        98
       11/30            12/7           12/14             12/21           12/28


Source: FactSet, Needham & Company, LLC.
Table of Contents
              Needham & Co. Clean Tech Research Recap..........................................................................................                                                 3

              DOE Watch: From Regulator to Rainmaker ..........................................................................................                                                 7

              Green Gossip: Legislation, Policy and Developments in the New Energy Era .....................................                                                                    9

              Investment & Market Activity .................................................................................................................                                    10

                                   Venture Capital & Private Equity......................................................................................................                       10

                                   Mergers & Acquisitions ....................................................................................................................                  10

                                   IPO Activity ......................................................................................................................................          12

              Market Performance .................................................................................................................................                              14

                                   Energy Generation ............................................................................................................................               15

                                   Energy Efficiency..............................................................................................................................              19

                                   Environmental Sciences & Services..................................................................................................                          21

              Tables .........................................................................................................................................................                  22


                  Needham & Company, LLC’s Clean Technology Universe/Verticals & Sub-Segments                                                                                   Figure 2


                                                                                                Clean Technology
                    Verticals


                                                                                                                                              Environmental Sciences and
                                                 Energy Creation                                   Energy Efficiency
                                                                                                                                                      Services


                                        !   Solar Value Chain                      !   Power Management/Smart Grid/                         !   Haz/Non-Haz Waste Treatment
                                             "   Silicon producers, wafer              Metering                                                  "   Remediation of contaminated land,
                                                 ingots, silicon cells and              " Efficient
                                                                                                  grid-level networks and systems that               soil, water and buildings.
                                                 modules, thin-film modules,              measure and control energy consumption,
                                                 vertically integrated, systems           various metering technologies.                    !   Pollution Abatement
                                                 and integrators, equipment                                                                      "   Air purification and pollution controls,
                                                                                   ! Energy Storage                                                  indoor air quality, emissions sensors
                                        !   Wind Infrastructure                         " Rechargeable  batteries, fuel cells, flywheels,            and analyzers
                    Sub-Segments


                                             "   Components, gearboxes,                   super capacitors, utility-grade storage
                                                 structures, turbines, bearings,          solutions                                         !   Filtration
                                                 subsystems                                                                                      "   Purification products/services,
                                                                                   !   Lighting Efficiency/Advanced Lighting                         filtration products/services
                                        ! Alternative Fuels                             " Energy efficient   lighting and systems, LEDs
                                             "   Ethanol, biofuels, hydrogen                                                                !   Green Materials
                                                 generation, biodigestors, fuel    !   Alt. Propulsion/Alt. Energy Vehicles                      "   Construction, biogenerated,
                                                 additives                              " Hybrid vehicles, hybrid drivetrain, electric               biodegradable, and green building
                                                                                          vehicles                                                   materials

                                                                                   ! Power Management Semiconductors


                Source: Needham & Company, LLC.

2 An Investment Analysis by Needham & Company, LLC
Needham & Co. Clean Tech Research Recap
Solar PV Industry Update: Our 2010 Outlook
Strong Recovery to Extend into 2010 as the Industry
Broadens Beyond Germany (1/04/10)
Y. Edwin Mok – ymok@needhamco.com
Conor Irvine – cirvine@needhamco.com

Despite overcapacity throughout the solar supply chain, we believe demand
for solar products will continue to grow in 2010. We believe growth will be
driven by the desire to capitalize on good IRRs in several key regions, the rush to
complete installations in anticipation for a sharper FIT cut in Germany, an
improved credit market providing project financing, and favorable subsidies in
countries such as the U.S, Italy, Japan and China, and the province of Ontario,
Canada. Additionally, with prices stabilizing, we believe many solar markets have
become more elastic, which has kicked off a new growth cycle in the industry.
While a subsidy cut in Germany in the back half of 2010 creates potential risk, we
believe a slowdown in Germany could be mitigated by strong growth in other
regions. Overall, we believe companies with good cost structure will generate solid
profits, and companies with strong project pipelines will deliver outperforming
revenue growth. Based on our positive view, we continue to like JASO and
SPWRA within our coverage universe.

Growth in the worldwide solar market has broadened from Germany into
multiple markets. Following the fall of solar instillations in Spain, Germany rose
to the occasion and generated half of the worldwide solar instillations in 2009,
driven by favorable subsidies that generate favorable IRRs. While Germany is
likely to remain one of the most important solar markets, we believe the worldwide
solar industry will become less concentrated in 2010, and we expect newly
forming solar markets to experience meaningful growth in the next few years.

We see upside to consensus revenue estimates in 1H10. As a result of
strengthening near term demand and improved order visibility, we believe
shipments generally tracked higher for 4Q09 and see un-seasonal sequential
growth in various markets in 1Q10. We note that the Street is modeling 1H10
aggregate solar revenue to grow only 3% over 2H09, and 2H10 revenue to grow
19% over 1H10. We believe the Street's estimates are too conservative, as the
demand picture continues to improve into the New Year and prices remain stable.

Price stabilization driving demand growth in various regions.
When prices were falling early in 2009, demand across various end markets
became inelastic. However, demand has seen a dramatic uptick in the back half of
2009, as buyers moved off the sideline, which has allowed prices to stabilize. With
stable prices, we expect solar markets in various regions to become more elastic,
and expect solar installations to grow in 2010 as a result. Polysilicon remains the
most oversupplied market in the solar food chain, and we expect prices for
polysilicon to continue to fall; however, we believe prices of downstream products
are more stable due to the pickup in demand, and we expect margins to expand
as a result.

We continue to like cost leaders and companies that are leveraged to the
U.S. In our opinion, JA Solar Holdings (JASO, Buy) will remain the cost leader in
solar cell manufacturing, which should enable the company to gain further market
share in European markets and Japan. Among the low cost producers, we believe
JASO can deliver above average growth due to continued share gain and its
expansion into the OEM module business. We believe SunPower (SPWRA, Buy)
is well positioned in the U.S. market, from small scale residential, commercial to
large-scale utilities and government projects. Besides being the leading
manufacturer of high-efficiency solar products, we believe SPWRA has developed

                                                                       An Investment Analysis by Needham & Company, LLC 3
a comprehensive approach in providing a solar power solution that will be a
        sustainable advantage over the long term.


        SunPower Corp. – Upgraded to Buy from Under
        Review (SPWRA) – (12/17/09)
        Y. Edwin Mok – ymok@needhamco.com
        Conor Irvine – cirvine@needhamco.com

        SPWRA: Robust Near-term Demand to Drive Upside, Likely to Overshadow
        Accounting Issues; Revising SPWRA from Under Review to Buy

        On 12/17/09, we revised our SPWRA rating to Buy (from Under Review) and
        set a price target of $32. We believe the recent update on the ongoing internal
        investigation into accounting issues has improved investor confidence that these
        issues will be behind the company shortly. Based on strengthening demand in
        several key markets, including Germany and Italy, and share gains driven by the
        expansion of SunPower's dealer network, we see upside to estimates in the near
        term. Heading into 2010, we believe SunPower is best positioned in the growing
        U.S. market. With the shares trading below levels before the accounting issues,
        we recommend investors use the weakness as a buying opportunity.

        Accounting issues still outstanding, but more confident that the impact will
        be minimal.
        Although SunPower has not completed the investigation into accounting
        irregularities, we believe the press release gave investors some reassurance that
        the accounting issues will have minimal impact to prior financials. We continue to
        believe these accounting issues have no impact to reported and future revenues.

        Robust near term demand suggests upside to 4Q09 revenue estimates.
        Heading into 2010, we are seeing strong demand in several key regions including
        Germany, Italy and the U.S. Industry participants have confirmed that the near
        term strength should extend into at least 1H10. We believe SunPower's 2009
        revenue guidance looks conservative, and based on strengthened demand, we
        see upside to consensus estimates for 4Q09 and 2010.

        SPWRA best positioned to benefit from the growth in the U.S. solar market.
        In 2010, we continue to believe the U.S. solar market will see substantial growth
        driven by increased availability of federal stimulus spending and a number of
        state/local subsidies. We believe SunPower is well positioned in all market
        segments, from small scale residential, commercial to large-scale utilities and
        government projects.


        Advanced Energy Industries, Inc. (AEIS): Inverter
        Business and Diversification Powering Growth;
        Initiated Coverage with Buy - (12/15/09)
        Y. Edwin Mok – ymok@needhamco.com
        Conor Irvine – corvine@needhamco.com

        On 12/15/09, we initiated coverage of Advanced Energy Industries, Inc. with
        a Buy rating and a 12-month price target of $16. As a leader in power
        conversion technology for advanced thin-film processes, we believe AEIS is well
        positioned to benefit from a recovery in key end markets, which include semi
        equipment, flat panel display, data storage and solar manufacturing. With a more
        diversified business, we believe Advanced Energy's revenues will return to prior
        peak levels and earnings will surpass prior peak levels even with a potentially
4 An Investment Analysis by Needham & Company, LLC
muted semi equipment cycle. We believe its solar inverter business is in the early
stage of a multiple year expansion and the company is rapidly gaining market
share in the U.S. commercial solar market, which we project will see substantial
growth in the coming years. We believe AEIS offers better growth potential than
semi equipment companies, and the shares will outperform in 2010.

Well positioned to leverage a recovery in several key end markets. We see
strong capital spending growth in several end markets in 2010, particularly in semi
equipment (largest end market), hard-disk storage and flat panel display. In semi
equipment, we project average inventory of key customers will return to normal
range of 130 days by 4Q09.

Diversification offsets a potentially muted semi equipment cycle, enabling
revenue to return to and EPS to surpass prior peak levels. AEIS has
increased non-semi revenue from 29% of revenue in 2002 (last semi cycle trough)
to 40% in 2009 (recent trough). With a higher mix of non-semi business (better
GM), revenues should return to prior peak levels of $350-400MM in 2011, with
earnings power over $1/sh.

Emerging solar inverter will drive substantial growth. We believe AEIS's inverter
business is in the early stages of a multi-year ramp. With its differentiating
transformer-less technology, we believe AEIS is rapidly gaining share in the U.S. large-
scale solar market, which we estimate will grow at a 40% CAGR from 2009-11. We
expect its recent entry into the European market drive incremental growth in 2010.


Initiated Coverage of Itron, Inc. (ITRI) – Hold
(12/17/09)
Sean K.F. Hannan – shannan@needhamco.com

Initiating Coverage at Hold
On 12/17/09, we initiated coverage of ITRI, a leading technology provider of
meters and related solutions for electric, gas and water utility applications, at Hold
on valuation and pending improved visibility on timing of opportunities.

Through multiple acquisitions and investments, Itron stands at the top of the global
meter market that is gaining renewed interest as a core component to the smart
grid. Leveraging its established history and deep customer relationships, we
believe the company is well positioned to benefit from technology shifts toward
advanced meter infrastructure (AMI) and a regulatory environment that is now
(slowly) becoming more supportive. It is our view that the space will see healthy
double-digit growth over the next few years, and we believe a leader such as Itron
has the ability to take share and improve its global position. However, with its
international (2/3 of revs.) outlook experiencing some lingering softness and
utilities still moving slowly (with decisions or deployments), we view the current
valuation as appropriate. Consequently, we are launching coverage at Hold and
would be more constructive on pull-backs or through improved visibility that would
allow us to increase estimates.

Utilities Markets Provide Strong Secular Growth Opportunities
Automation and Smart Grid efforts have finally moved to the forefront of utilities’
agendas while the decision processes at state regulators are (slowly) improving.
This creates a fertile environment for all AMI players where adoption is showing
better economics and acceptance.

Operating Margins Poised To Expand
With a leaner model, revenue momentum through a strong backlog, and higher
tech mix, we expect to see notable Op. margin expansion in next 12-18 months.

Strong Global Share & Presence
                                                                           An Investment Analysis by Needham & Company, LLC 5
Itron is the leading global provider of meter solutions, with either #1 or #2 share
        positions in each application and a presence at customers in 130 different
        countries.
        Comprehensive & Holistic Product Approach
        Itron's portfolio approach can help to simplify the process for the risk-averse
        utilities in a couple of ways: (1) vendor/supplier management and (2) utilizing a
        solution with components explicitly designed to work together.


        Clean Technology: Environmental Sciences and
        Services (01/05/10)
        While we are now into the second quarter of the recovery and we remain
        optimistic for 2010 expecting GDP growth in the range of 3.5-4.0%. As has been
        well publicized, most companies will benefit from a significant degree of operating
        leverage once the revenue line begins to expand.           In our sector we have
        highlighted Clean Harbors (CLH) as one of our best ideas for 2010 as we think it
        will be major beneficiary of an economic rebound in the upcoming year.

        Clean Harbors (CLH, Buy)
        We continue to recommend purchase of CLH believing that 2010 will be a strong
        recovery year benefitting from the economic recovery especially in the chemical
        and refining industries both of which have impacted results significantly over the
        past year. We continue to highlight that due to its strong industry position and
        solid cash flow characteristics, CLH has performed reasonably well in a weak
        economic environment. Also with the acquisition of Eveready completed, CLH has
        expanded its revenue base by over 50% further strengthening its product offerings
        and geographic reach. Pricing appears to be hold up well in landfill and
        incineration and the incineration utilization rates are close to 90%. Also CLH has
        been active in reducing its overheard expenses targeting a $20mm of cost
        synergies from the integration of Eveready in 2009 and another $20-$25mm in
        additional expense reduction in 2010. Following the acquisition, the company has
        $220mm of cash and debt of $299mm with capital expenditures expected to
        remain below depreciation levels. Following a disappointing 2009, we expect
        revenue to expand 34% (due in large part to the Eveready acquisition in for the full
        year) and EPS to increase from $1.83 in 2009 to $2.61 in 2010.

        Clean Harbors is a leading provider of environmental services and operator of
        non-nuclear hazardous waste treatment facilities in North America and Canada,
        offering technical, site and industrial services. The company’s technical services
        include collection, transport, treatment and disposal of hazardous and non-
        hazardous wastes and physical treatment, resource recovery, fuels blending,
        incineration, landfill disposal, wastewater treatment, lab chemical disposal and
        explosives management services. We value CLH on an EBITDA basis; and the
        stock is currently at a 7.0X multiple of 2010 EV/EBITDA. We view this at the low
        end of the range for the company and have a $70 price target on the company.
        CLH is entering 2010 with good visibility, a solid long-term market position, and
        underlying fundamentals that are very solid. With the economy slated for healthy
        growth in 2010, we believe the outlook remains very positive for CLH.


6 An Investment Analysis by Needham & Company, LLC
DOE Watch – From Regulator to Rainmaker
With approximately $40 billion at its disposal for clean technology funding, the
DOE has become the most powerful and important clean technology investor,
expanding its regulatory role to include that of rainmaker, through a steady shower
of government funds.

Out of the $32.7 billion available to the DOE through the American Reinvestment
and Recovery Act (ARRA), the DOE has awarded $21.8 billion and spent $1.7
billion, according to the DOE.

Figure 3: DOE Funds Awarded & Currently Available Under ARRA as of 12/25/09

   (Billions)                                                                                                      Spent
                             Scientific
                             Research                Advanced                                                      $1.7
                               $1.6                  Research
                 Carbon Capture/                  Projects Agency
                     Storage                            $0.4
                                                                                               Still
                      $3.4
          Loan Guarantee                                                                     Available
             Program                                             Energy                        $9.2                  $32.7 Billion
               $4.0                                            Efficiency &
                                                               Renewable
                                                                                                                     Excludes $4                     Awarded
             Smart Grid &
                                                                 Energy                                              Billion Loan                     $21.8
                                                                   $16.8                                              Guarantee
               Efficient
               Electrical                                                                                              Program
             Transmission
                 $4.5               Cold War
                                  Nuclear Clean           Total: $36.7 Billion
                                        Up
                                       $6.0

Source: DOE, Needham & Company, LLC.

The DOE announced a series of awards in December, highlighted by $979 million
for carbon capture and sequestration (CCS), $564 million to fund 19 biorefineries
and $60 million for the interconnection of the national smart grid.

Figure 4: Significant DOE Investments, Grants and Loans Announced in December
                                                                                                    Amount
   Date                     Program                                   Recipient(s)                   (MM)                        Description
                                                           - American Electric Power Company                    Accelerate the development of advanced coal
                                                                  - Southern Company                           technologies with carbon capture and storage at
  4-Dec      Clean Coal Power Initiative Round III            - Summit Texas Clean Energy            $979                     commercial-scale
                                                                                                             Accelerate the construction and operation of 19 pilot,
                                                                                                              demonstration, and commercial scale biorefinery
  4-Dec           Advanced Biorefinery Projects                       19 biorefineries               $564                          facilities
                                                                       - Electrofuels
                                                         - Innovative Materials & Processes for
                                                        Advanced Carbon Capture Technologies
                                                        - Batteries for Electrical Energy Storage              The DOE Annouced a second funding round for
  7-Dec                     ARPA-E                                   in Transportation               $100         ARPA-E for three funding opportunities
                                                                                                             Build an activated carbon manufacturing facility near
  9-Dec             Loan Guarantee Program               Red River Environmental Products, LLC       $245           Coushatta, Red River Parish, Louisiana
                                                                                                                  Promote collaborative long-term analysis and
                                                                                                                  planning for the Eastern, Western and Texas
                           Smart Grid -                                                                       electricity interconnections, which will help states,
                      Resource Assesment &                  - Eastern Interconnection: $30MM                 utilities, grid operators, and others prepare for future
                Interconnection-Level Transmission        - Western Interconnection: $26.5MM                       growth in energy demand, renewable energy
  18-Dec                Analysis & Planning                  - Texas Interconnection: $3.5MM         $60               sources, and smart grid technologies.
                                                                                                                              - Fuel from Sunlight Hub
                                                                                                                  - Modeling & Simulation for Nuclear Reactors
  22-Dec             Enegry Innovation Hubs                     Three DOE research Hubs              $366           - Energy Efficient Building Systems Design
Source: DOE, Needham & Company, LLC.


                                                                                                    An Investment Analysis by Needham & Company, LLC 7
Carbon Capture & Sequestration Award – 12/04/09
        The $979 million in funding for CCS will be in addition to $2.2 billion of capital from
        the three projects’ stakeholders, including American Electric Power (AEP),
        Southern Company, Summit Texas Clean Energy and partners. The project aims
        to develop CCS as a deployable technology in eight to ten years, able to achieve
        an efficiency capture target of 90%.

        The AEP project team includes APCo, Schlumberger Carbon Services, Battelle
        Memorial Institute, CONSOL Energy and Alstom. The project is expected to last 10
        years and has a DOE contribution of $334MM.

        The Southern Company project team includes Mitsubishi Heavy Industries,
        Schlumberger Carbon Services, Advanced Resources International, Geological Survey
        of Alabama, EPRI; Stanford University, University of Alabama, AJW Group, and
        University of Alabama at Birmingham. It is projected to last 11 years and has a DOE
        contribution of $295MM.

        Figure 5: Participant Breakdown of $979 million in DOE Funding for CCS

                                             Mitsubishi Heavy Industries,              University of Texas,
                                           Schlumberger Carbon Services,               Siemens technology
                                                Advanced Resources
                                                 International, EPRI
                APCo, Schlumberger
               Carbon Services, Battelle
                  Memorial Institute,
               CONSOL Energy, Alstom                                                          $350

                                                         $334


                        $295


                  Southern Company                        AEP                       Texas Clean Energy Project


        Source: DOE, Company Reports, Needham & Company, LLC.

        Red River Awarded DOE Loan Guarantee – 12/09/09
        Red River Environmental Products was awarded $245MM under the DOE Loan
        Guarantee Program for the construction of an activated carbon manufacturing facility in
        Louisiana. This is the fourth loan given out under the program and the second largest,
        as shown in figure 6. Approximately $3.2 billion remains available under the program.

        We note that Red River is the first non Energy Creation company to receive a loan
        under the program. We expect the DOE to continue to focus on carbon mitigation
        technologies as legislators take a more dovish stance towards fossil-fuels in the
        aftermath of international stalemate in Copenhagen and a stalled federal cap-and-trade
        program in the US.

        Figure 6: DOE Loan Guarantee Program Recipients (MM)

                          Beacon       Nordic                         Date Offered                   Recipient         Amount (MM)              Use of Funds
                          Power      Windpower                                                                                       Construction of activated carbon
                           $43          $16                                                  Red River Environmental                     manufacturing facility near
                                              Solyndra
                                               $535                      9-Dec                   Products, LLC            $245        Coushatta, Red River Parish, LA
                                                                                                                                      Support expansion of wind turbine
                                                                                                                                     assembly plant to 1MW in Pocatello,
            Available                              Red River
             $3,161                                                         2-Jul               Nordic Windpower           $16                        ID
                                                     $245
                                                                                                                                        Support construction of 20MW
                                                                                                                                       flywheel energy storage plant in
                                                                            2-Jul                 Beacon Power             $43                Stephentown, NY
                                                                                                                                      Construction of commercial-scale
                                                                                                                                     manufacturing plant of its proprietary
                                                                        20-Mar                    Solyndra, Inc.          $535                 solar modules

        Source: DOE, Needham & Company, LLC.

8 An Investment Analysis by Needham & Company, LLC
Green Gossip – Legislation, Policy                                               and
Developments in the New Energy Era
Expectations were high leading up to the Copenhagen Climate Change
Conference as President Obama announced early in the month that he would
attend the closing in efforts to secure an agreement and as the triad of potential
spoilers (the US, China and India) had already announced their intent to
participate through voluntary carbon cuts. Domestically, things appeared to be
progressing with or without the wishes of Congress as the EPA declared
greenhouse gases a danger to public health, potentially leading to new emissions
regulation and causing the Needham Energy Creation index to rally, led by the
Solar index.

As the Copenhagen Conference drew to a close, greens and the usual myriad of
climate concerned countries, such as Greenland and Denmark, deemed it a
failure. We disagree and see the framework, in the form of the 3-page
“Copenhagen Accord”, as a foundation and as a building block for progress. While
we acknowledge the outcry over the conference’s inability to produce legally
binding GHG reduction targets, we also note that very serious money in the tune
of $30 billion for the period 2010 to 2012 and $100 billion annually by 2020 for a
clean technology fund to assist developing countries is being mobilized and could
act as a follow up catalyst to the various government stimulus packages that are
currently buoying the sector.

Furthermore, a successful conference in our opinion was not necessarily one that
succeeded in efforts to legally bind nations to targets and goals for the purpose of
mitigating the possibility of catastrophic climate change, as many investors and
scientists are not convinced that climate change is man-made, but one that’s
results produced the generation of some sort of clean technology fund to further
support the energy infrastructure transformation currently taking place. We believe
the conference was successful in doing so and will be tracking the development
related to these funds.

Developed countries’ insistence on conditionality attached to these funds should
make sure the funds aren’t seen as retribution or aid for developing countries, but
instead are used for clean technology development and to fight deforestation.
While we do not see these funds as a near-term catalyst, we believe it could act
as an important long-term growth driver for the overall sector.

Progress on establishing a price on carbon was nascent and hopes for
implementing a global cap-and-trade program or anything legally binding was
shot; however, a framework for establishing both was put into place if and when
the US and other countries choose to implement it at home first. This is a prospect
we doubt will take hold prior to next year’s Climate Change Conference in Mexico
City. Senior Democrats in carbon-intensive and agriculture-focused states such as
Indiana, North Dakota, Louisiana and Nebraska are concerned about the effects it
could have on jobs and other Democratic Senators are hesitant to support what is
essentially a tax ahead of midterm elections in the wake of economic uncertainty
and stubbornly high unemployment. While we are still optimistic for an energy
reform bill in 2010, we believe that if cap-and-trade is to be a part of that bill it is
likely to be held off until at least 2011. But then of course if there is a Democratic
mid-term drubbing, cap-and-trade might not be so easy to push through in its
aftermath.


                                                                           An Investment Analysis by Needham & Company, LLC 9
Investment & Market Activity
        Venture Capital & Private Equity

        Investor appetite for clean tech investment remains robust, highlighted by the
        continued influx of venture capital and private equity investment. In 2009, world
        wide PE & VC investment was $11.655 billion, down 18% from the highs of 2008
        but up 72% from 2007. Energy Creation continues to attract the lion’s share of
        private investment; however, investment opportunities arising from stimulus
        spending directed at the smart grid is spurring interest in Energy Efficiency while
        expectations for emission-related legislation is buoying investment in
        Environmental Sciences & Services, as shown in figure 7.

        Figure 7: World Wide PE & VC Investment in Clean Tech – 1999 to 2009
          $ 16,000
                           (MM's)

          $ 14,000

          $ 12,000          Environmental Science & Services

          $ 10,000          Energy Efficiency

           $ 8,000          Energy Creation

           $ 6,000

           $ 4,000

           $ 2,000

              $ -
                             00
                      99


                                      01


                                             02


                                                    03


                                                                         06
                                                           04


                                                                  05


                                                                                07


                                                                                       08


                                                                                              09
                    19


                           20


                                    20


                                           20


                                                  20


                                                         20


                                                                20


                                                                       20


                                                                              20


                                                                                     20


                                                                                            20


        Source: Cleantech Group, Needham & Company, LLC.


        Clean tech financing activity in December was highlighted by Hudson Clean
        Energy Partners closing its first fund, which is over $1 billion. The fund will invest
        in late stage energy creation and energy efficiency technologies in the range of
        $50 million to $150 million on average per transaction. The firm was founded in
        2007 and is led by John Cavalier and Neil Auerbach.

        Mergers & Acquisitions

        The clean tech industry has seen a steady rise of M&A activity over the past few
        years reflective of the industry’s growth and as shown in figure 8 below. Activity
        has increased as a growing number of players, previously unrelated to clean
        technology, have made acquisitions to gain exposure to the space.

        December saw a number of companies enter the clean technology space via
        acquisition including Panasonic and Taiwan Semiconductor Manufacturing Co.
        (TSMC) through Sanyo and Motech, respectively.

        We expect this trend to continue and expect an influx of new players to continue to
        enter the space via acquisitions, such as defense and telecom companies, based
        largely on opportunities presented by the smart grid.


10 An Investment Analysis by Needham & Company, LLC
Figure 8: World Wide Clean Tech M&A Activity - 2005 to 2009


    Environmental Sciences &                                                            455 total
    Services
                                                                                           94
    Energy Efficiency                                            361 total

                           313 total
                                                                       87                  94
    Energy Creation                             257 total
                             100
                                                    70                 86

                              66
                                                    43
     111 total                                                                            267
        35                                                            188
                 20          147                   144
        56

       2005                 2006                   2007               2008               2009

Source: Cleantech Group, Needham & Company, LLC.

December 2009 saw 44 M&A announcements; a decrease of four deals from
November, and nine less than December 2008.

Energy Creation saw the bulk of deal activity in December 2009, in-line
historically, with 25 transactions. Of those transactions, seven were biofuel, eight
were solar and five were wind.

Figure 9: World Wide Clean Tech M&A Activity – December 2009, Y/Y & M/M

        36

                           Dec-08           Nov 09          Dec 09

                 27
                      25


                                                     11                      11
                                       10     10
                                                                                  8
                                                                  7


        Energy Creation                Energy Efficiency     Environmental Sciences &
                                                                     Services


Source: Cleantech Group, Needham & Company, LLC.

Selected Clean Tech M&A in December
A few noteworthy transactions in our opinion are listed below.

Clipper Windpower announced it sold a 49.5% stake to United Technologies on
December 19th. The proceeds are to strengthen the company’s balance sheet,
pursue strategic initiatives and facilitate project financing.

Also, noteworthy in the wind industry was PG&E’s undisclosed acquisition of
Iberdrola’s Manzana Wind Farm, a 246 MW project under development in
California that would be PG&E’s first wind farm. The project will cost

                                                                                        An Investment Analysis by Needham & Company, LLC 11
approximately $900 million to develop, which includes payment to Iberdrola.
        Iberdrola is developing and building the wind farm while PG&E will own and
        operate it. PG&E, along with the other California utilities, are trying to achieve a
        33% renewable portfolio standard (RPS) by 2020.

        The upstream solar market saw some activity this month with the undisclosed
        acquisition of Eversol by MEMC and with TSMC taking a 20% stake in Motech
        Industries. The investment marks TSMC’s entrance into the solar market, which
        was expected; however, the size of the investment surprised on the upside in light
        of TSMC’s board reportedly approving only a $50 million investment in August.

        On 12/09/09 EnerNOC acquired the 30-person monitoring-based commissioning
        outfit, Cogent, for an undisclosed amount.

        Figure 10: Selected Clean Tech M&A – December 2009
                          Target                               Buyer                 Deal Size   Date Annouced        Subsector
         Clipper Windpower                      United Technologies Corporation     $270,000,000    12/9/2009           Wind
         Cogent Energy, Inc.                    EnerNOC                             Undisclosed    12/9/2009          Smart Grid
                                                Taiwan Semiconductor
         Motech Industries                      Manufacturing Co.                   $193,000,000   12/10/2009           Solar
         246 MW Manzana wind farm -:-
         assett of Iberdrola Renewables, Inc.   PG&E                                 Undisclosed   12/11/2009            Wind
         California Micro Devices               ON Semiconductor Corp               $108,000,000   12/14/2009          Lighting
         Eversol                                MEMC Electronic Materials, Inc.      Undisclosed   12/21/2009            Solar
         CO2 Solution, Inc.                     Codexis, Inc.                        Undisclosed   12/21/2009         Clean Coal
         Total Agroindustria Canavieira S/A     Petrobras                           $84,000,000    12/22/2009          Biofuels
        Source: Cleantech Group, Needham & Company, LLC.

        IPO Activity

        Clean tech IPOs in December rose to 3 from 2 in November. There were no IPOs
        during the same month last year.

        China Longyuan Power Group, China’s largest wind power producer, raised
        approximately $2.26 billion via an initial public offering. The IPO is the third largest
        clean tech IPO to date, behind Iberdola’s $6.6 billion IPO in December 2007 and
        EDP Renovaveis’s $2.4 billion in June 2008. On 12/31/09 shares of Longyuan
        were up 12.4% since it began trading on 12/10/09.

        Figure 11: Select Clean Tech M&A Transactions – December 2009

            Date                     Company                              Ticker           Exchange            Offer        Shares
          12/3/2009 China Forestry Holdings Co., Ltd                      00930    Hong Kong Futures Exchange  $0.27      750,000,000
         12/10/2009 China Longyuan Electric Power Group Corp               0916    Hong Kong Futures Exchange  $1.06     2,142,860,000
         12/16/2009 Pure Klimaschutz                                       4CT      Frankfurt Stock Exchange Undisclosed Undisclosed
        Source: Cleantech Group, Needham & Company, LLC.


12 An Investment Analysis by Needham & Company, LLC
In 2009, there were 13 clean tech IPOs, according to Cleantech Group. On
average the shares of clean tech companies that went public last year returned
25.8%, driven by the outperformance of China Singyes Solar and Duoyuan Global
Water, Inc.

Figure 12: IPO Performance Year to Date, as of 12/31/09 & IPOs by Needham & Co. Clean Tech Vertical – 2001 to 2009
                                                                                                                                                221%

                                                                                                                                                       70
                             Shares of Cleantech Companies to
                                                                                                                                                                     Environmental Science &
                              IPO in 2009 are up an average of                                                                                                       Services
                                                                                                                                                       60
                                     26%, as of 12/31/09                                                                                                             Energy Efficiency
                                                                                                                                                       50
                                                                                                                                       64%
                                                                                                                            34%                                      Energy Generation
                                                                                            12%        20%        22%                                  40
                                                             5%          5%       11%

                                      -7%        -6%                                                                                                   30
                            -11%
                 -35%
                                                                                                                                                       20
                                             gy
                          YS


                                                                                         an
                                                          z
                                    gs


                                                                                                                                                r
                                                                                                                           in g


                                                                                                                                       c
                                                                                                      c


                                                                                                                  .
                                                                     s
                 d


                                                                                  c
                                                        ut


                                                                                                                                                la
                                                                                                                 rp


                                                                                                                                       In
                                                                                                     In
                                                                    ng
                                             er


                                                                               In
             Lt


                                                                                         yu
                                   in
                        M


                                                        ch


                                                                                                                                             So
                                                                                                                          cl
                                                                                                              Co
                                                                                                  gs
                                         En


                                                                                                                                    er
                                 ld


                                                                    di


                                                                              s,
            on


                                                                                       ng


                                                                                                                       cy
                     en


                                                   as


                                                                                                                                  at
                                                                  ol
                               Ho


                                                                          em


                                                                                                                                            s
                                                                                                in


                                                                                                          gy
         isi


                                                                                                                                                       10
                                                                                    Lo


                                                                                                                      Re
                                        an


                                                                                                                                         ye
                  zh


                                                   im


                                                             yH


                                                                                                                               W
                                                                                              o ld
      ti v


                                                                                                         er
                                                                         st
                            ns


                                      di


                                                                                                                                      ng
                 en


                                                 Kl


                                                                                   a


                                                                                                                              al
                                                                                                                  al
                                                                    Sy
                                                         s tr


                                                                                            H


                                                                                                      En
      ul


                                                                                  in
                                    In
                        ee


                                                                                                                                    Si
             Sh


                                                                                                                              b
                                                                                                                  et
                                             re
     M


                                                                              Ch


                                                                                         R


                                                                                                                           lo
                                                        re
                        Gr


                                                                   23


                                                                                                              M
                                                                                                     a
                                            Pu


                                                                                                                                   a
                                                                                       ST


                                                                                                                          G
 ro


                                                       Fo


                                                                                                  m


                                                                                                                                  in
                                                              A1


                                                                                                             a
Eu


                                                                                                ag


                                                                                                                       an

                                                                                                                               Ch
                                                                                                          hi n


                                                                                                                                                        0
                                                   a
                                                  in


                                                                                                                     yu
                                                                                              M


                                                                                                         C
                                              Ch


                                                                                                                  uo


                                                                                                                                                              2001    2002     2003      2004   2005        2006   2007   2008   2009
                                                                                                                 D


Source: Cleantech Group, FactSet Needham & Company, LLC.

Figure 13: IPOs by Needham & Co. Clean Tech Vertical – 2001 to 2009
                                                                         2001                             2002                         2003            2004           2005            2006        2007             2008          2009

         Energy Generation                                                    0                               3                          1              1              14             35               26           13             6

    Energy Efficiency                                                         0                               0                          0              2               6                8             15            1             2
 Environmental Science &
        Services                                                              2                               3                          0              2              12             15               11            3             5
                      Total                                                   2                               6                          1              5              32             58               52           17            13

Source: Cleantech Group, Needham & Company, LLC.

Cancelled or Delayed Clean Tech IPOs
While Longyuan enjoyed a successful IPO in December, Trony Solar, a Chinese
solar module maker, postponed plans for its IPO which was scheduled for
December as well. The delayed Trony IPO comes on the heels of the lackluster
STR Holdings IPO last month. STR Holdings opened trading at $10/share, below
its offering range of $11 to $13, which had already been reduced from $13 to $15.

Upcoming Clean Tech IPOs
We are optimistic for the clean tech IPO market as investor interest for the
upcoming Solyndra IPO appears to be high.

Solyndra, a California based commercial-scale cylindrical thin-film solar company,
filed a registration statement for a $300 million IPO on the Nasdaq. Solyndra
(which would trade under the symbol SOLY) would use the proceeds for the
construction of the company’s manufacturing facility in Fremont. Solyndra could
buck the recent dismal solar IPO trend due to technological differentiation in its
use of mirrors and due to solid financing thus-far that includes $535 million from
the DOE Loan Guarantee Program.

Codexis Inc., a California based cellulosic ethanol company that uses a biocatalyst
process to produce fuel, filed for a $100 million IPO on the Nasdaq. Shell, the
largest advocate of biofuels of the oil majors, owns approximately 20% the
company. Codexis (which would trade under the symbol CDXS), intends to use
the proceeds for working capital and other general purposes as well as to possibly
acquire technologies or companies. The company backed out of previous plans to
go public in September 2008, citing unfavorable market conditions.

                                                                                                                                                                     An Investment Analysis by Needham & Company, LLC 13
Market Performance
        The Needham & Co. Energy Efficiency Index rose 8.35% in December,
        outperforming the S&P 500, which rose by 1.78%. The Needham & Co. Energy
        Creation and Environmental Sciences & Services also outperformed the S&P 500,
        both increasing by 5.73% and 3.55%, respectively.

        Figure 14: Needham & Co. Clean Tech Vertical Indices – 11/30/09 to 12/31/09


                         Energy
                                                                                                                  8.35%
                        Effic ienc y


            Energy Creation                                                                  5.73%


                Environmental
                 Sc ienc es &                                              3.55%
                  Servic es


                         S&P 500                                1.78%


        Source: FactSet, Needham & Company, LLC.

        Leading the Needham & Co. subsectors in December were LED, Non-Toxic
        Materials and Smart Grid, while Hazardous Waste and Wind lagged, as shown
        below in figure 3. A complete listing of the companies comprising each of these
        subsectors is detailed at the back of this report.

        Figure 15: Needham & Co. Clean Tech Subsector Indices – 11/30/09 to 12/31/09

                                LED                                                                                      17.18%


                Non-Toxic Materials                                                                             14.98%


                        Smart Grid                                                                     13.66%


                    Energy Storage                                                            11.27%


                               Solar                                                        10.84%


                   Material Science                                                 9.27%


             Power Semiconductor                                            7.50%


                      Infrastructure                                     6.72%


                    W ater Filtration                            4.87%

                  W ave,
                                                            4.00%
            Biomass & Geothermal

                            Biofuels                    3.10%


                Air Pollution Control           1.86%


                           S&P 500              1.78%


                 Alternative Vehicle        1.12%


                               W ind       0.93%


         Hazardous W aste Services      0.08%


        Source: FactSet, Needham & Company, LLC.


14 An Investment Analysis by Needham & Company, LLC
Energy Creation
The Needham & Co. Energy Creation Index rose 5.73% in November versus the
S&P 500 which increased 1.78%.

Figure 16: Needham & Co. Energy Creation Subsector Indices – 11/30/09 to 12/31/09


           Solar                                                         10.84%


      W ave,
    Biomass &                          4.00%
    Geothermal


        Biofuels                  3.10%


           W ind        0.93%


Source: FactSet, Needham & Company, LLC.

The Needham & Co. Solar Index which is comprised of 46 companies, led the
Energy Creation Index advancing 10.84%. The index returned an average 14% in
December, led by Amtech Systems and JA Solar, which increased 85.1% and
46.5%, respectively.

BTU International (Buy rated) rose 39% as the company, which supplies
advanced thermal processing equipment to the alternative energy and electronics
markets, is well positioned for improvement in solar equipment orders. The
company has introduced several new products and we would expect increased
traction in the thin film area by the 2H of 2010. The company's stock price is well
supported by a book value of $4.30 per share and net cash of $1.71 per share.

Akeena Solar (Hold rated) was up 30% in December due to its mid-month
announcement of selling its Andalay AC panels through 21 Lowe's home-
improvement centers in California. This represents a new distribution channel for
Akeena. The AC panels have built-in inverters that produce AC power, so there is
no DC wiring required for installation. Built-in inverters offer the advantage of
generating more energy output especially in partially shaded conditions.


                                                                       An Investment Analysis by Needham & Company, LLC 15
Figure 17: Needham & Co. Solar Index – 11/30/09 to 12/31/09

                                 A mtech Systems Inc.                                                                         85.1%

                     JA Solar Holdings Co. Ltd. (A DS)                                                         46.5%

                                            Spire Corp.                                                     40.3%

                                 BTU International Inc.                                                    38.9%

                               Solartech Energy Corp.                                                33.0%

                              Topco Scientif ic Co. Ltd.                                             32.3%

                                   Canadian Solar Inc.                                              30.9%

                                     A keena Solar Inc.                                            30.2%

                               Neo Solar Pow er Corp.                                            25.9%

                                   Hoku Scientif ic Inc.                                     23.6%

                                         Sunw ays A G                                       22.5%

                       A scent Solar Technologies Inc.                                    19.1%

                                        EMCORE Corp.                                      18.9%

                                  ReneSola Ltd (A DS)                                     18.7%

                                     STR Holdings Inc.                                    18.1%

                            GT Solar International Inc.                                  17.1%

                        China Sunergy Co. Ltd. (A DS)                                    16.7%

                                Trina Solar Ltd. (A DS)                                  15.9%

             Solarf un Pow er Holdings Co. Ltd. (A DS)                               15.8%

                               SunPow er Corp. (Cl A )                               14.6%

                                        First Solar Inc.                            13.7%

                                 A pplied Materials Inc.                            13.2%

                        MEMC Electronic Materials Inc.                              13.1%

                                       Roth & Rau A G                              12.1%

                                   Wacker Chemie A G                               11.4%

           Y ingli Green Energy Holding Co. Ltd. (A DS)                            11.3%

              Suntech Pow er Holdings Co. Ltd. (A DS)                              11.2%

                            DayStar Technologies Inc.                              10.9%

                                           Q-Cells S.E.                           9.1%
                                                                                                                 T he 46
                                  Evergreen Solar Inc.                        7.9%
                                                                                                             companies in
                      Energy Conversion Devices Inc.                         6.6%
                                                                                                            the Needham &
                                Real Goods Solar Inc.                        5.6%

                                                                            3.6%
                                                                                                            Co. Solar Index
                        centrotherm photovoltaics A G

                                 Gintech Energy Corp.                      3.1%
                                                                                                              Returned an
                                      Solar-Fabrik A G                     2.1%
                                                                                                            average of 14%
                                              Solon SE                     2.0%
                                                                                                              in December
                                        SolarWorld A G                     1.7%

                                         aleo solar A G            -0.5%

                            E-Ton Solar Tech. Co. Ltd.             -0.6%

                               PV Crystalox Solar PLC           -2.9%

                        Green Energy Technology Inc.            -3.4%

                         Websol Energy Systems Ltd.          -5.4%

               Premier Pow er Renew able Energy Inc.       -8.3%

                                          Conergy A G      -9.6%

                             LDK Solar Co. Ltd. (A DS) -10.1%

                                      Solar Pow er Inc.-12.1%


        Source: FactSet, Needham & Company, LLC.


16 An Investment Analysis by Needham & Company, LLC
The Needham & Co. Wind Index, which is comprised of 20 companies, lagged
the Energy Creation Index advancing 0.93%%. The index returned an average
3.0% in December, led by American Superconductor and Clipper Windpower,
which increased 23.2% and 21.1%, respectively.

Figure 18: Needham & Co. Wind Index – 11/30/09 to 12/31/09


                  American Superconductor Corp.                                                          23.2%

                          Clipper Windpow er PLC                                                       21.1%

                               Catch the Wind Inc.                                               16.4%

                               Suzlon Energy Ltd.                                                15.2%

                                   NEPC India Ltd.                                             13.4%

                           REpow er Systems AG                                                 13.3%

                           Broadw ind Energy Inc.                                              13.1%

                                    MagneTek Inc.                                           11.6%

                                         A BB Ltd.                                        8.4%

        A-Pow er Energy Generation Systems Ltd.                                         6.6%

                                     A cciona S.A.                                      6.5%

                                    Kaydon Corp.                                 0.6%

                         Energy Composites Corp.                                 0.2%

                                       Nordex A G                      -1.0%

  Xinjiang Goldw ind Science & Technology Co. Ltd.                    -2.7%

            Gamesa Corporacion Tecnologica S.A .               -7.2%

                        V estas Wind Systems A /S             -8.9%

                                        A AER Inc.   -19.2%

                           GC China Turbine Corp.                                -24.4%

                      Composite Technology Corp.                                 -26.4%


Source: FactSet, Needham & Company, LLC.


                                                                              An Investment Analysis by Needham & Company, LLC 17
Shares of American Superconductor have been driven higher by favorable
        developments in both its wind and superconducting wire businesses. In addition,
        in early December, management reiterated revenue and earnings guidance for the
        current year ending March and for the out-year. In its fast-growing wind power
        business, which represents over three-quarters of its revenues, AMSC continues
        to benefit from strong near-term growth drivers, notably the continued strong
        investment by Chinese wind turbine manufacturers, and longer term by potential
        new growth opportunities in the fast-growing off-share wind power market. We
        expect business to remain strong with AMSC's largest customer, Sinovel, the
        number one wind turbine manufacturer in China, continues to ramp production at
        the same time that the company's other wind turbine manufacturers in China,
        notably Dongfang and CSR Zelri, scale up production.

        AMSC has an active new product pipeline, including the next-generation
        PMW4000W for its new wind turbine designs and a new solar farm grid
        interconnection product. The company is also working on a 10MW offshore high-
        temperature superconductor (HTS)-based wind turbine called SeaTitan. While it's
        still a few years out, SeaTitan will follow a similar model that AMSC executed with
        its core electrical components in its current portfolio of wind turbines, namely
        license the HTS wind turbine design, then sell the HTS wire and electrical
        components, but with the potential for $1M of total content versus $60,000-
        $80,000 for its current wind turbine designs. AMSC believes the addressable
        market for SeaTitan could be as large as $1B by 2016.

        AMSC's shares have also gotten some lift from developments around the
        proposed Tres Amigas power hub in New Mexico, which will link three power grids
        in the U.S. and Canada and will incorporate the company's superconducting wire.
        Tres Amigas in December submitted filings with the Federal Energy Regulatory
        Commission (FERC) to move forward with the project, in which AMSC has a
        minority equity interest. As this project moves forward, we believe it will represent
        another important validation of the company's superconductor technology.

        Elsewhere in the wind sector, A-Power Energy Generation Systems, Ltd., which
        provides distributed power generation systems in China and manufactures wind
        turbines, last month announced that Shenyang Power Group (SPG), together
        with affiliates of U.S. Renewable Energy Group (US-REG) and Cielo Wind
        Power, LP ("Cielo Wind"), have entered into a definitive agreement for their
        ownership of a project company to develop a 600 MW wind farm in Texas. A-
        Power has been designated to supply wind turbines to this project.

        General Electric Co. in early December announced a $1.4 billion contract from
        Caithness Energy to supply its 2.5xl wind turbines and related services for the
        massive 845 MW Shepherds Flat wind farm project in Oregon, which is expected
        to be the largest ever. Construction is scheduled to start next year and is expected
        to be finished in 2012. GE will also supply 10 years of operational and
        maintenance services. The Shepherds Flat wind farm will supply renewable
        energy to Southern California Edison.

        Also in December, Danish blade manufacturer LM Glasfiber announced a five-
        year supply contract for a minimum of 1,500 MW with Samsung, a new entrant to
        the wind power market which plans to launch a new line of 2.5MW wind turbines.

        The government of Brazil announced it would contract 1.8GW of wind capacity,
        coming from 71 wind farms over a 20-year period.


18 An Investment Analysis by Needham & Company, LLC
Energy Efficiency
The Needham & Co. Energy Efficiency Index rose 8.35% in December versus
the S&P 500 which increased 1.78%. The Needham & Co. LED index, which is
comprised of 7 companies, led the Energy Efficiency Index, advancing 17.2%
followed by the Smart Grid Index, which is comprised of 12 companies and rose
by 13.7%.

Figure 19: Needham & Co. Energy Efficiency Subsector Indices – 11/30/09 to 12/31/09


                  LED                                                       17.2%


        Smart Grid                                              13.7%


   Energy Storage                                       11.3%


      Power
                                            7.5%
   Semiconductor


      Infrastructure                       6.7%


         Alternative
                             1.1%
          Vehicle


Source: FactSet, Needham & Company, LLC.

The companies comprising the LED index (market cap weighted) returned an
average 17.2% in December, propelled by above average gains from Supertex
and Cree, which increased 24.6% and 17.9%, respectively.

Figure 20: Needham & Co. LED Index – 11/30/09 to 12/31/09

          Supertex Inc.                                                         24.6%


               Cree Inc.                                                17.9%


             Diodes Inc.                                            16.4%


 Universal Display Corp.                                            15.7%


  Orion Energy Systems
                                                             9.2%
           Inc.


      LSI Industries Inc.                                   8.8%


    Nexxus Lighting Inc.    -20.9%


Source: FactSet, Needham & Company, LLC.

The companies comprising the Smart Grid index returned an average 3.6% in
December, led by Telvent, MYR Group and EnerNOC, which increased 22.0%,
15.7% and 14.9%, respectively. We note that both Telvent and MYR Group are
service companies, while EnerNOC is a software/ service company. We believe
                                                                          An Investment Analysis by Needham & Company, LLC 19
shares of the service companies are demonstrated stronger momentum during the
        month versus the metering companies, which realized sizable gains during mid
        2009 (as a result of the federal stimulus announcement followed by rounds of
        utility award announcements).

        Figure 21: Needham & Co. Smart Grid Index – 11/30/09 to 12/31/09

                         Telvent GIT S.A .                                                                                     22.0%

                         M Y R Gro up Inc.                                                                             15.7%

                             EnerNOC Inc.                                                                          14.9%

                                   It ro n Inc.                                                                11.2%

                     Quant a Services Inc.                                                                     11.1%

                            Co mverg e Inc.                                                                 9.3%

                ESCO Techno lo g ies Inc.                                                               7.3%

                            Echelo n Co rp .                                                         4.5%

                           A mb ient Co rp .                                         -0.7%

          Po werSecure Int ernat io nal Inc.                     -12.6%

                     Zenerg y Po wer PLC               -18.3%

                    B eaco n Po wer Co rp .                                                    -21.5%


        Source: FactSet, Needham & Company, LLC.

        The Needham & Co. Power Semis Index, which is comprised of 18 companies,
        advanced 7.5%%, in December. The companies comprising the index returned an
        un weighted average of 16.3%, led by California Micro Devices (which was
        acquired by On Semiconductor for $4.70 per share) and Cirrus Logic, which
        increased 57.0% and 25.6%, respectively. Texas Instruments, the largest in
        market cap by approximately 3.5 fold, weighed on the index with a monthly return
        of only 3.0%.

        Figure 22: Needham & Co. Power Semis Index – 11/30/09 to 12/31/09

                      C alifo rnia M icro D evices C o rp.                                                                     57.0%
                                        C irrus Lo gic Inc.                                  25.6%
           F airchild Sem ico nducto r Internatio nal Inc.                                 23.3%
               A dvanced A nalo gic T echno lo gies Inc.                                   23.1%
                                   Intersil C o rp. (C l A )                         18.7%
                          Internatio nal R ectifier C o rp.                        18.2%
                       Vo lterra Sem ico nducto r C o rp.                       15.9%
                      M axim Integrated P ro ducts Inc.                        15.5%
                                              IXYS C o rp.                    15.1%
                                                  M icrel Inc.                14.7%
                            ON Sem ico nducto r C o rp.                      13.7%
                              Linear T echno lo gy C o rp.                   13.3%
                      M o no lithic P o wer System s Inc.                  11.5%
                               P o wer Integratio ns Inc.             8.2%
                                         Sem tech C o rp.           6.2%
                                   A nalo g D evices Inc.          5.3%
                       N atio nal Sem ico nducto r C o rp.          5.2%
                                T exas Instrum ents Inc.         3.0%

        Source: FactSet, Needham & Company, LLC.


20 An Investment Analysis by Needham & Company, LLC
Environmental Sciences & Services
The Needham & Co. Environmental Sciences & Services Index rose 3.55% in
December versus the S&P 500 which increased 1.78%. The Needham & Co. Non-
Toxic Materials Index, which is comprised of 8 companies, led the Environmental
Sciences & Services Index, advancing 14.98%.

Figure 23: Needham & Co. Environmental Sciences & Services Subsector Indices –
11/30/09 to 12/31/09


          Non-Toxic
                                                                          14.98%
          Materials


   Material Science                                       9.27%


    Water Filtration                      4.87%


        Air Pollution
                                  1.86%
           Control


     Hazardous
                          0.08%
    Was te Services


Source: FactSet, Needham & Company, LLC.

Headwaters and Hexcel led the Index increasing, increasing 38.4% and 23.0%,
respectively.

Figure 24: Needham & Co. Non-Toxic Materials Index – 11/30/09 to 12/31/09


       Headw aters Inc.                                                      38.4%

           Hexcel Corp.                                           23.0%

  KHD Humboldt Wedag                                      17.5%

            Kadant Inc.                           10.7%

            Zoltek Cos.                    5.8%

          Landec Corp.        -0.6%

            Tennant Co.    -3.8%


Source: FactSet, Needham & Company, LLC.


                                                                          An Investment Analysis by Needham & Company, LLC 21
Figure 25: Needham & Company, LLC’s Clean Technology Universe
                                                                                                      Closing                      Shares    Market
                                                                                       12 Mo.          Price        52-Week          Out.     Cap.
COMPANY (Disclosures)                              Subsector                    Symbol Rating         01/06/10   High      Low      (mil.)    (mil.)   Analyst
Energy Creation
Advanced Energy Industries, Inc. (B, D, E, G, J)   Solar Industry                AEIS      Buy         $16.66    $16.82   $5.36       43       700     Mok
Akeena Solar Inc. (B, G)                           Solar Industry                AKNS      Hold         1.41      2.61     0.58       28        49     Kundtz
American Superconductor Corp. (B, G, J1)           Wind Power & Grid Products    AMSC      Buy          42.87     43.50   11.66       43      1,891    Ricchiuti
Applied Materials, Inc. (B, G)                     Solar Mfg. Equipment          AMAT      Hold        14.16     14.57    8.19      1,333    18,987    Mok
BTU International, Inc. (B, G, J1)                 Solar Mfg. Equipment          BTUI      Buy          6.26      8.30     2.66        9        58     Kundtz
JA Solar Holdings Co. Ltd. (B, G)                  Solar PV Technology           JASO      Buy          6.80      6.95     1.77      169      1,142    Mok
LDK Solar Co. Ltd. (B)                             Solar PV Technology            LDK      Hold         7.95     16.47     3.75      109       900     Mok
MEMC Electronic Materials, Inc. (B)                Solar PV Technology           WFR       Hold        14.61     21.36    11.32      229      3,121    Mok
Solar Power Inc. (B, E)                            Solar Industry               SOPW       Buy          1.24      1.90    0.42       38        62      Kundtz
SunPower Corp. (B, E, G)                           Solar PV Technology          SPWRA      Buy         25.77     44.46    19.70       84      2,497    Mok

Energy Efficiency
Echelon Corporation (B, G)                         Smart Grid                   ELON       Buy         $11.97    $15.38   $5.13      41        491     Hannan
ESCO Technologies, Inc. (B)                        Smart Grid                    ESE       Buy         35.16     46.87    29.04      27        929     Hannan
Fuel Systems Solutions, Inc. (B, D, G, J)          Alternative Energy           FSYS       Buy         48.01     52.53     9.83      16        844     Kundtz
Itron, Inc. (B, G)                                 Smart Grid                     ITRI     Hold         71.92     72.20   40.10      35       2,886    Hannan
IXYS Corporation (B, G)                            Analog/Mixed Signal           IXYS      Buy          6.95      11.00    5.61      31        216     Essi, Jr.
LSI Industries (B, E, G)                           LED Lighting                 LYTS       Buy           8.11      8.48    2.75      22        195     Ricchiuti
Maxwell Technologies Inc. (B, E, G)                Alternative Energy           MXWL       Buy         18.13     21.81     4.50      21        472     Kundtz
Monolithic Power Systems, Inc. (B, G)              Analog/Mixed Signal          MPWR       Buy          23.10    25.26    10.67      36        805     Essi, Jr.
ON Semiconductor Corporation (B, D, E, G, J)       Analog/Mixed Signal          ONNN     Restricted      8.90      9.12    3.17      379      3,783    Essi, Jr.
Power Integrations Inc. (B, G, J1)                 Analog/Mixed Signal          POWI       Hold         36.02     37.15   16.75      32        971     Essi, Jr.
Supertex, Inc. (B, G)                              Analog/Mixed Signal          SUPX       Hold        28.19     32.98    18.43      13        364     Essi, Jr.
Ultralife Corporation (B, G, J1)                   Alternative Energy            ULBI      Buy          4.28      14.15    3.42      18         73     Kundtz
Universal Display Corporation (B, G, J1)           OLED Lighting                PANL       Hold        14.17      14.26    5.04      36        520     Ricchiuti
Volterra Semiconductor Corp. (B, G)                Analog/Mixed Signal          VLTR       Hold        18.45     20.17    6.16       25        429     Essi, Jr.

Environmental Sciences & Services
American Ecology Corp. (B, G)                      Hazardous Waste               ECOL      Hold        $17.25    $21.21   $13.56     18        313     Kundtz
Ceco Environmental Corp. (B, G)                    Air Pollution Control         CECE      Buy          3.96      4.51     1.80      15         57     Kundtz
Ceradyne, Inc. (B, G, J1)                          Diversified Technology        CRDN      Hold        19.35     25.07    14.27      27        497     Ricchiuti
Clean Harbors Inc. (B)                             Hazardous Waste                CLH      Buy         61.05     65.18    40.90      23       1,600    Kundtz
Fuel Tech Inc. (B, G)                              Air Pollution Control         FTEK      Hold         8.10     14.15     7.01      25        196     Kundtz
Heritage-Crystal Clean Inc. (B, G)                 Hazardous Waste               HCCI      Hold        11.01     13.80     6.50      11        118     Kundtz
PMFG, Inc. (B, D, G, J)                            Air Pollution Control         PMFG      Hold        16.60     18.50     3.96      13        220     Kundtz
Tennant Company (B)                                Industrial Cleaning            TNC      Hold        26.56     33.37     7.61      19        497     Kundtz
Source: FactSet, Needham & Company, LLC.


22 An Investment Analysis by Needham & Company, LLC
Needham Clean Tech Monthly   December

Más contenido relacionado

Destacado

Breaking Down BP's New BOP Standards
Breaking Down BP's New BOP StandardsBreaking Down BP's New BOP Standards
Breaking Down BP's New BOP Standardszacsadow
 
учебно-ознакомительный очет по практике. ГрандОтельЕвропа
учебно-ознакомительный очет по практике. ГрандОтельЕвропаучебно-ознакомительный очет по практике. ГрандОтельЕвропа
учебно-ознакомительный очет по практике. ГрандОтельЕвропаolya
 
ασφάλεια στο διαδίκτυo
ασφάλεια στο διαδίκτυoασφάλεια στο διαδίκτυo
ασφάλεια στο διαδίκτυoGuernikaki
 
λυπη προγραμμα συναισθηματα
λυπη προγραμμα συναισθηματαλυπη προγραμμα συναισθηματα
λυπη προγραμμα συναισθηματαGuernikaki
 
χαρα συναισθηματικη αγωγη
χαρα   συναισθηματικη αγωγηχαρα   συναισθηματικη αγωγη
χαρα συναισθηματικη αγωγηGuernikaki
 
Baromètre TIC 2013 de la Wallonie. Citoyens. Entreprises. Education
Baromètre TIC 2013 de la Wallonie. Citoyens. Entreprises. EducationBaromètre TIC 2013 de la Wallonie. Citoyens. Entreprises. Education
Baromètre TIC 2013 de la Wallonie. Citoyens. Entreprises. EducationAgence du Numérique (AdN)
 
Apronet - Présentation d'IntraParis (dec 2005)
Apronet - Présentation d'IntraParis (dec 2005) Apronet - Présentation d'IntraParis (dec 2005)
Apronet - Présentation d'IntraParis (dec 2005) Mairie de Paris
 
Brochure de presentation Eurosearch&Associes
Brochure de presentation Eurosearch&AssociesBrochure de presentation Eurosearch&Associes
Brochure de presentation Eurosearch&Associesthierryraickman
 
Thèse professionnelle "Quel avenir pour les jeux vidéos en 2016?"
Thèse professionnelle "Quel avenir pour les jeux vidéos en 2016?"Thèse professionnelle "Quel avenir pour les jeux vidéos en 2016?"
Thèse professionnelle "Quel avenir pour les jeux vidéos en 2016?"Clémence Rigaud
 
Spotme Training Solutions for the Automotive Manufacturer Industry
Spotme Training Solutions for the Automotive Manufacturer IndustrySpotme Training Solutions for the Automotive Manufacturer Industry
Spotme Training Solutions for the Automotive Manufacturer IndustryAndy Frezza
 
Comment publier dans ieee - Atelier de formation CNUDST 2015
Comment publier dans ieee - Atelier de formation CNUDST 2015Comment publier dans ieee - Atelier de formation CNUDST 2015
Comment publier dans ieee - Atelier de formation CNUDST 2015Bessem Aamira
 
Brand content et evenementiel : pari gagnant
Brand content et evenementiel : pari gagnantBrand content et evenementiel : pari gagnant
Brand content et evenementiel : pari gagnantLabCom
 
Internet, réseaux sociaux, mobilité: de nouvelles stratégies en oeuvre dans l...
Internet, réseaux sociaux, mobilité: de nouvelles stratégies en oeuvre dans l...Internet, réseaux sociaux, mobilité: de nouvelles stratégies en oeuvre dans l...
Internet, réseaux sociaux, mobilité: de nouvelles stratégies en oeuvre dans l...Audrey Defretin
 
Comment tirer meilleur partie de Twitter
Comment tirer meilleur partie de TwitterComment tirer meilleur partie de Twitter
Comment tirer meilleur partie de TwitterAkimELSIKAMEYA
 

Destacado (20)

Breaking Down BP's New BOP Standards
Breaking Down BP's New BOP StandardsBreaking Down BP's New BOP Standards
Breaking Down BP's New BOP Standards
 
Info Gps
Info   GpsInfo   Gps
Info Gps
 
учебно-ознакомительный очет по практике. ГрандОтельЕвропа
учебно-ознакомительный очет по практике. ГрандОтельЕвропаучебно-ознакомительный очет по практике. ГрандОтельЕвропа
учебно-ознакомительный очет по практике. ГрандОтельЕвропа
 
ασφάλεια στο διαδίκτυo
ασφάλεια στο διαδίκτυoασφάλεια στο διαδίκτυo
ασφάλεια στο διαδίκτυo
 
λυπη προγραμμα συναισθηματα
λυπη προγραμμα συναισθηματαλυπη προγραμμα συναισθηματα
λυπη προγραμμα συναισθηματα
 
χαρα συναισθηματικη αγωγη
χαρα   συναισθηματικη αγωγηχαρα   συναισθηματικη αγωγη
χαρα συναισθηματικη αγωγη
 
Introduction to microeconomics ch 1
Introduction to microeconomics ch 1Introduction to microeconomics ch 1
Introduction to microeconomics ch 1
 
Introduction to microeconomics ch 1
Introduction to microeconomics ch 1Introduction to microeconomics ch 1
Introduction to microeconomics ch 1
 
Ch 1 intro to ob
Ch 1 intro to obCh 1 intro to ob
Ch 1 intro to ob
 
Utility ch 2 1
Utility ch 2 1Utility ch 2 1
Utility ch 2 1
 
Law Of Equi Marginal Utility
Law Of Equi Marginal UtilityLaw Of Equi Marginal Utility
Law Of Equi Marginal Utility
 
Baromètre TIC 2013 de la Wallonie. Citoyens. Entreprises. Education
Baromètre TIC 2013 de la Wallonie. Citoyens. Entreprises. EducationBaromètre TIC 2013 de la Wallonie. Citoyens. Entreprises. Education
Baromètre TIC 2013 de la Wallonie. Citoyens. Entreprises. Education
 
Apronet - Présentation d'IntraParis (dec 2005)
Apronet - Présentation d'IntraParis (dec 2005) Apronet - Présentation d'IntraParis (dec 2005)
Apronet - Présentation d'IntraParis (dec 2005)
 
Brochure de presentation Eurosearch&Associes
Brochure de presentation Eurosearch&AssociesBrochure de presentation Eurosearch&Associes
Brochure de presentation Eurosearch&Associes
 
Thèse professionnelle "Quel avenir pour les jeux vidéos en 2016?"
Thèse professionnelle "Quel avenir pour les jeux vidéos en 2016?"Thèse professionnelle "Quel avenir pour les jeux vidéos en 2016?"
Thèse professionnelle "Quel avenir pour les jeux vidéos en 2016?"
 
Spotme Training Solutions for the Automotive Manufacturer Industry
Spotme Training Solutions for the Automotive Manufacturer IndustrySpotme Training Solutions for the Automotive Manufacturer Industry
Spotme Training Solutions for the Automotive Manufacturer Industry
 
Comment publier dans ieee - Atelier de formation CNUDST 2015
Comment publier dans ieee - Atelier de formation CNUDST 2015Comment publier dans ieee - Atelier de formation CNUDST 2015
Comment publier dans ieee - Atelier de formation CNUDST 2015
 
Brand content et evenementiel : pari gagnant
Brand content et evenementiel : pari gagnantBrand content et evenementiel : pari gagnant
Brand content et evenementiel : pari gagnant
 
Internet, réseaux sociaux, mobilité: de nouvelles stratégies en oeuvre dans l...
Internet, réseaux sociaux, mobilité: de nouvelles stratégies en oeuvre dans l...Internet, réseaux sociaux, mobilité: de nouvelles stratégies en oeuvre dans l...
Internet, réseaux sociaux, mobilité: de nouvelles stratégies en oeuvre dans l...
 
Comment tirer meilleur partie de Twitter
Comment tirer meilleur partie de TwitterComment tirer meilleur partie de Twitter
Comment tirer meilleur partie de Twitter
 

Similar a Needham Clean Tech Monthly December

Operations and-maintenance-best-practices
Operations and-maintenance-best-practicesOperations and-maintenance-best-practices
Operations and-maintenance-best-practicesNikhil Nangia
 
Solar powering your community, a guide for local governments
Solar powering your community, a guide for local governmentsSolar powering your community, a guide for local governments
Solar powering your community, a guide for local governmentsJustin Bean
 
IREC Annual Trends Report Final 10 11 11 December Web R
IREC Annual Trends Report Final 10 11 11 December Web RIREC Annual Trends Report Final 10 11 11 December Web R
IREC Annual Trends Report Final 10 11 11 December Web RCalifornia Free Solar
 
Ems ppt chapters
Ems ppt chaptersEms ppt chapters
Ems ppt chaptersAnoopM36
 
Role of Alternative Energy Sources: Natural Gas Technology Assessment
Role of Alternative Energy Sources: Natural Gas Technology AssessmentRole of Alternative Energy Sources: Natural Gas Technology Assessment
Role of Alternative Energy Sources: Natural Gas Technology AssessmentMarcellus Drilling News
 
The Management of Critical Spares in the Electric & Gas Utility Industry
The Management of Critical Spares in the Electric & Gas Utility IndustryThe Management of Critical Spares in the Electric & Gas Utility Industry
The Management of Critical Spares in the Electric & Gas Utility IndustryScottMadden, Inc.
 
Nlyte Software Green It White Paper
Nlyte Software Green It White PaperNlyte Software Green It White Paper
Nlyte Software Green It White Paperdariano
 
Ogilvy Sydney- GreenIT
Ogilvy Sydney- GreenITOgilvy Sydney- GreenIT
Ogilvy Sydney- GreenITtheknees
 
IS 642 final submit (Ali Alsalman)
IS 642 final submit (Ali Alsalman)IS 642 final submit (Ali Alsalman)
IS 642 final submit (Ali Alsalman)Ali Alsalman
 
The Case For Thermoelectrics In The DC
The Case For Thermoelectrics In The DCThe Case For Thermoelectrics In The DC
The Case For Thermoelectrics In The DCJeffrey Sicuranza
 
RethinkingEnergy2020-2030-LRR.pdf
RethinkingEnergy2020-2030-LRR.pdfRethinkingEnergy2020-2030-LRR.pdf
RethinkingEnergy2020-2030-LRR.pdfDiegoHerrera33508
 
E–Waste Recycling Plant - Manufacturing Plant, Detailed Project Report, Profi...
E–Waste Recycling Plant - Manufacturing Plant, Detailed Project Report, Profi...E–Waste Recycling Plant - Manufacturing Plant, Detailed Project Report, Profi...
E–Waste Recycling Plant - Manufacturing Plant, Detailed Project Report, Profi...Ajjay Kumar Gupta
 
Investment and business potentials in energy efficiency industry
Investment and business potentials in energy efficiency industry Investment and business potentials in energy efficiency industry
Investment and business potentials in energy efficiency industry ZAINI ABDUL WAHAB
 
Energy Effiiciency Loan Fund
Energy Effiiciency Loan FundEnergy Effiiciency Loan Fund
Energy Effiiciency Loan FundTNenergy
 

Similar a Needham Clean Tech Monthly December (20)

Operations and-maintenance-best-practices
Operations and-maintenance-best-practicesOperations and-maintenance-best-practices
Operations and-maintenance-best-practices
 
Solar powering your community, a guide for local governments
Solar powering your community, a guide for local governmentsSolar powering your community, a guide for local governments
Solar powering your community, a guide for local governments
 
IREC Annual Trends Report Final 10 11 11 December Web R
IREC Annual Trends Report Final 10 11 11 December Web RIREC Annual Trends Report Final 10 11 11 December Web R
IREC Annual Trends Report Final 10 11 11 December Web R
 
Ems ppt chapters
Ems ppt chaptersEms ppt chapters
Ems ppt chapters
 
Role of Alternative Energy Sources: Natural Gas Technology Assessment
Role of Alternative Energy Sources: Natural Gas Technology AssessmentRole of Alternative Energy Sources: Natural Gas Technology Assessment
Role of Alternative Energy Sources: Natural Gas Technology Assessment
 
The Management of Critical Spares in the Electric & Gas Utility Industry
The Management of Critical Spares in the Electric & Gas Utility IndustryThe Management of Critical Spares in the Electric & Gas Utility Industry
The Management of Critical Spares in the Electric & Gas Utility Industry
 
Nlyte Software Green It White Paper
Nlyte Software Green It White PaperNlyte Software Green It White Paper
Nlyte Software Green It White Paper
 
Work Portfolio_2015
Work Portfolio_2015Work Portfolio_2015
Work Portfolio_2015
 
Work portfolio 2015
Work portfolio 2015Work portfolio 2015
Work portfolio 2015
 
Ogilvy Sydney- GreenIT
Ogilvy Sydney- GreenITOgilvy Sydney- GreenIT
Ogilvy Sydney- GreenIT
 
IS 642 final submit (Ali Alsalman)
IS 642 final submit (Ali Alsalman)IS 642 final submit (Ali Alsalman)
IS 642 final submit (Ali Alsalman)
 
The Case For Thermoelectrics In The DC
The Case For Thermoelectrics In The DCThe Case For Thermoelectrics In The DC
The Case For Thermoelectrics In The DC
 
RethinkingEnergy2020-2030-LRR.pdf
RethinkingEnergy2020-2030-LRR.pdfRethinkingEnergy2020-2030-LRR.pdf
RethinkingEnergy2020-2030-LRR.pdf
 
WIPAC Monthly - April 2018
WIPAC Monthly - April 2018WIPAC Monthly - April 2018
WIPAC Monthly - April 2018
 
Lean energy-toolkit
Lean energy-toolkitLean energy-toolkit
Lean energy-toolkit
 
E–Waste Recycling Plant - Manufacturing Plant, Detailed Project Report, Profi...
E–Waste Recycling Plant - Manufacturing Plant, Detailed Project Report, Profi...E–Waste Recycling Plant - Manufacturing Plant, Detailed Project Report, Profi...
E–Waste Recycling Plant - Manufacturing Plant, Detailed Project Report, Profi...
 
Investment and business potentials in energy efficiency industry
Investment and business potentials in energy efficiency industry Investment and business potentials in energy efficiency industry
Investment and business potentials in energy efficiency industry
 
Crcif - Irrigation futures
Crcif  - Irrigation futuresCrcif  - Irrigation futures
Crcif - Irrigation futures
 
Cleantech - Global Trends and Indian Scenario
Cleantech - Global Trends and Indian ScenarioCleantech - Global Trends and Indian Scenario
Cleantech - Global Trends and Indian Scenario
 
Energy Effiiciency Loan Fund
Energy Effiiciency Loan FundEnergy Effiiciency Loan Fund
Energy Effiiciency Loan Fund
 

Último

Salesforce Community Group Quito, Salesforce 101
Salesforce Community Group Quito, Salesforce 101Salesforce Community Group Quito, Salesforce 101
Salesforce Community Group Quito, Salesforce 101Paola De la Torre
 
Transforming Data Streams with Kafka Connect: An Introduction to Single Messa...
Transforming Data Streams with Kafka Connect: An Introduction to Single Messa...Transforming Data Streams with Kafka Connect: An Introduction to Single Messa...
Transforming Data Streams with Kafka Connect: An Introduction to Single Messa...HostedbyConfluent
 
Kalyanpur ) Call Girls in Lucknow Finest Escorts Service 🍸 8923113531 🎰 Avail...
Kalyanpur ) Call Girls in Lucknow Finest Escorts Service 🍸 8923113531 🎰 Avail...Kalyanpur ) Call Girls in Lucknow Finest Escorts Service 🍸 8923113531 🎰 Avail...
Kalyanpur ) Call Girls in Lucknow Finest Escorts Service 🍸 8923113531 🎰 Avail...gurkirankumar98700
 
Transcript: #StandardsGoals for 2024: What’s new for BISAC - Tech Forum 2024
Transcript: #StandardsGoals for 2024: What’s new for BISAC - Tech Forum 2024Transcript: #StandardsGoals for 2024: What’s new for BISAC - Tech Forum 2024
Transcript: #StandardsGoals for 2024: What’s new for BISAC - Tech Forum 2024BookNet Canada
 
Histor y of HAM Radio presentation slide
Histor y of HAM Radio presentation slideHistor y of HAM Radio presentation slide
Histor y of HAM Radio presentation slidevu2urc
 
Enhancing Worker Digital Experience: A Hands-on Workshop for Partners
Enhancing Worker Digital Experience: A Hands-on Workshop for PartnersEnhancing Worker Digital Experience: A Hands-on Workshop for Partners
Enhancing Worker Digital Experience: A Hands-on Workshop for PartnersThousandEyes
 
The Role of Taxonomy and Ontology in Semantic Layers - Heather Hedden.pdf
The Role of Taxonomy and Ontology in Semantic Layers - Heather Hedden.pdfThe Role of Taxonomy and Ontology in Semantic Layers - Heather Hedden.pdf
The Role of Taxonomy and Ontology in Semantic Layers - Heather Hedden.pdfEnterprise Knowledge
 
[2024]Digital Global Overview Report 2024 Meltwater.pdf
[2024]Digital Global Overview Report 2024 Meltwater.pdf[2024]Digital Global Overview Report 2024 Meltwater.pdf
[2024]Digital Global Overview Report 2024 Meltwater.pdfhans926745
 
08448380779 Call Girls In Diplomatic Enclave Women Seeking Men
08448380779 Call Girls In Diplomatic Enclave Women Seeking Men08448380779 Call Girls In Diplomatic Enclave Women Seeking Men
08448380779 Call Girls In Diplomatic Enclave Women Seeking MenDelhi Call girls
 
A Domino Admins Adventures (Engage 2024)
A Domino Admins Adventures (Engage 2024)A Domino Admins Adventures (Engage 2024)
A Domino Admins Adventures (Engage 2024)Gabriella Davis
 
Automating Business Process via MuleSoft Composer | Bangalore MuleSoft Meetup...
Automating Business Process via MuleSoft Composer | Bangalore MuleSoft Meetup...Automating Business Process via MuleSoft Composer | Bangalore MuleSoft Meetup...
Automating Business Process via MuleSoft Composer | Bangalore MuleSoft Meetup...shyamraj55
 
Neo4j - How KGs are shaping the future of Generative AI at AWS Summit London ...
Neo4j - How KGs are shaping the future of Generative AI at AWS Summit London ...Neo4j - How KGs are shaping the future of Generative AI at AWS Summit London ...
Neo4j - How KGs are shaping the future of Generative AI at AWS Summit London ...Neo4j
 
From Event to Action: Accelerate Your Decision Making with Real-Time Automation
From Event to Action: Accelerate Your Decision Making with Real-Time AutomationFrom Event to Action: Accelerate Your Decision Making with Real-Time Automation
From Event to Action: Accelerate Your Decision Making with Real-Time AutomationSafe Software
 
WhatsApp 9892124323 ✓Call Girls In Kalyan ( Mumbai ) secure service
WhatsApp 9892124323 ✓Call Girls In Kalyan ( Mumbai ) secure serviceWhatsApp 9892124323 ✓Call Girls In Kalyan ( Mumbai ) secure service
WhatsApp 9892124323 ✓Call Girls In Kalyan ( Mumbai ) secure servicePooja Nehwal
 
Tech-Forward - Achieving Business Readiness For Copilot in Microsoft 365
Tech-Forward - Achieving Business Readiness For Copilot in Microsoft 365Tech-Forward - Achieving Business Readiness For Copilot in Microsoft 365
Tech-Forward - Achieving Business Readiness For Copilot in Microsoft 3652toLead Limited
 
Google AI Hackathon: LLM based Evaluator for RAG
Google AI Hackathon: LLM based Evaluator for RAGGoogle AI Hackathon: LLM based Evaluator for RAG
Google AI Hackathon: LLM based Evaluator for RAGSujit Pal
 
GenCyber Cyber Security Day Presentation
GenCyber Cyber Security Day PresentationGenCyber Cyber Security Day Presentation
GenCyber Cyber Security Day PresentationMichael W. Hawkins
 
Scaling API-first – The story of a global engineering organization
Scaling API-first – The story of a global engineering organizationScaling API-first – The story of a global engineering organization
Scaling API-first – The story of a global engineering organizationRadu Cotescu
 
Strategies for Unlocking Knowledge Management in Microsoft 365 in the Copilot...
Strategies for Unlocking Knowledge Management in Microsoft 365 in the Copilot...Strategies for Unlocking Knowledge Management in Microsoft 365 in the Copilot...
Strategies for Unlocking Knowledge Management in Microsoft 365 in the Copilot...Drew Madelung
 
Breaking the Kubernetes Kill Chain: Host Path Mount
Breaking the Kubernetes Kill Chain: Host Path MountBreaking the Kubernetes Kill Chain: Host Path Mount
Breaking the Kubernetes Kill Chain: Host Path MountPuma Security, LLC
 

Último (20)

Salesforce Community Group Quito, Salesforce 101
Salesforce Community Group Quito, Salesforce 101Salesforce Community Group Quito, Salesforce 101
Salesforce Community Group Quito, Salesforce 101
 
Transforming Data Streams with Kafka Connect: An Introduction to Single Messa...
Transforming Data Streams with Kafka Connect: An Introduction to Single Messa...Transforming Data Streams with Kafka Connect: An Introduction to Single Messa...
Transforming Data Streams with Kafka Connect: An Introduction to Single Messa...
 
Kalyanpur ) Call Girls in Lucknow Finest Escorts Service 🍸 8923113531 🎰 Avail...
Kalyanpur ) Call Girls in Lucknow Finest Escorts Service 🍸 8923113531 🎰 Avail...Kalyanpur ) Call Girls in Lucknow Finest Escorts Service 🍸 8923113531 🎰 Avail...
Kalyanpur ) Call Girls in Lucknow Finest Escorts Service 🍸 8923113531 🎰 Avail...
 
Transcript: #StandardsGoals for 2024: What’s new for BISAC - Tech Forum 2024
Transcript: #StandardsGoals for 2024: What’s new for BISAC - Tech Forum 2024Transcript: #StandardsGoals for 2024: What’s new for BISAC - Tech Forum 2024
Transcript: #StandardsGoals for 2024: What’s new for BISAC - Tech Forum 2024
 
Histor y of HAM Radio presentation slide
Histor y of HAM Radio presentation slideHistor y of HAM Radio presentation slide
Histor y of HAM Radio presentation slide
 
Enhancing Worker Digital Experience: A Hands-on Workshop for Partners
Enhancing Worker Digital Experience: A Hands-on Workshop for PartnersEnhancing Worker Digital Experience: A Hands-on Workshop for Partners
Enhancing Worker Digital Experience: A Hands-on Workshop for Partners
 
The Role of Taxonomy and Ontology in Semantic Layers - Heather Hedden.pdf
The Role of Taxonomy and Ontology in Semantic Layers - Heather Hedden.pdfThe Role of Taxonomy and Ontology in Semantic Layers - Heather Hedden.pdf
The Role of Taxonomy and Ontology in Semantic Layers - Heather Hedden.pdf
 
[2024]Digital Global Overview Report 2024 Meltwater.pdf
[2024]Digital Global Overview Report 2024 Meltwater.pdf[2024]Digital Global Overview Report 2024 Meltwater.pdf
[2024]Digital Global Overview Report 2024 Meltwater.pdf
 
08448380779 Call Girls In Diplomatic Enclave Women Seeking Men
08448380779 Call Girls In Diplomatic Enclave Women Seeking Men08448380779 Call Girls In Diplomatic Enclave Women Seeking Men
08448380779 Call Girls In Diplomatic Enclave Women Seeking Men
 
A Domino Admins Adventures (Engage 2024)
A Domino Admins Adventures (Engage 2024)A Domino Admins Adventures (Engage 2024)
A Domino Admins Adventures (Engage 2024)
 
Automating Business Process via MuleSoft Composer | Bangalore MuleSoft Meetup...
Automating Business Process via MuleSoft Composer | Bangalore MuleSoft Meetup...Automating Business Process via MuleSoft Composer | Bangalore MuleSoft Meetup...
Automating Business Process via MuleSoft Composer | Bangalore MuleSoft Meetup...
 
Neo4j - How KGs are shaping the future of Generative AI at AWS Summit London ...
Neo4j - How KGs are shaping the future of Generative AI at AWS Summit London ...Neo4j - How KGs are shaping the future of Generative AI at AWS Summit London ...
Neo4j - How KGs are shaping the future of Generative AI at AWS Summit London ...
 
From Event to Action: Accelerate Your Decision Making with Real-Time Automation
From Event to Action: Accelerate Your Decision Making with Real-Time AutomationFrom Event to Action: Accelerate Your Decision Making with Real-Time Automation
From Event to Action: Accelerate Your Decision Making with Real-Time Automation
 
WhatsApp 9892124323 ✓Call Girls In Kalyan ( Mumbai ) secure service
WhatsApp 9892124323 ✓Call Girls In Kalyan ( Mumbai ) secure serviceWhatsApp 9892124323 ✓Call Girls In Kalyan ( Mumbai ) secure service
WhatsApp 9892124323 ✓Call Girls In Kalyan ( Mumbai ) secure service
 
Tech-Forward - Achieving Business Readiness For Copilot in Microsoft 365
Tech-Forward - Achieving Business Readiness For Copilot in Microsoft 365Tech-Forward - Achieving Business Readiness For Copilot in Microsoft 365
Tech-Forward - Achieving Business Readiness For Copilot in Microsoft 365
 
Google AI Hackathon: LLM based Evaluator for RAG
Google AI Hackathon: LLM based Evaluator for RAGGoogle AI Hackathon: LLM based Evaluator for RAG
Google AI Hackathon: LLM based Evaluator for RAG
 
GenCyber Cyber Security Day Presentation
GenCyber Cyber Security Day PresentationGenCyber Cyber Security Day Presentation
GenCyber Cyber Security Day Presentation
 
Scaling API-first – The story of a global engineering organization
Scaling API-first – The story of a global engineering organizationScaling API-first – The story of a global engineering organization
Scaling API-first – The story of a global engineering organization
 
Strategies for Unlocking Knowledge Management in Microsoft 365 in the Copilot...
Strategies for Unlocking Knowledge Management in Microsoft 365 in the Copilot...Strategies for Unlocking Knowledge Management in Microsoft 365 in the Copilot...
Strategies for Unlocking Knowledge Management in Microsoft 365 in the Copilot...
 
Breaking the Kubernetes Kill Chain: Host Path Mount
Breaking the Kubernetes Kill Chain: Host Path MountBreaking the Kubernetes Kill Chain: Host Path Mount
Breaking the Kubernetes Kill Chain: Host Path Mount
 

Needham Clean Tech Monthly December

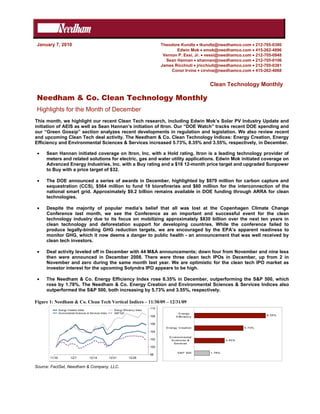
  • 1. January 7, 2010 Theodore Kundtz • tkundtz@needhamco.com • 212-705-0380 Edwin Mok • emok@needhamco.com • 415-262-4896 Vernon P. Essi, Jr. • vessi@needhamco.com • 212-705-0948 Sean Hannan • shannan@needhamco.com • 212-705-0106 James Ricchiuti • jricchiuti@needhamco.com • 212-705-0381 Conor Irvine • cirvine@needhamco.com • 415-262-4868 Clean Technology Monthly Needham & Co. Clean Technology Monthly Highlights for the Month of December This month, we highlight our recent Clean Tech research, including Edwin Mok’s Solar PV Industry Update and initiation of AEIS as well as Sean Hannan’s initiation of Itron. Our “DOE Watch” tracks recent DOE spending and our “Green Gossip” section analyzes recent developments in regulation and legislation. We also review recent and upcoming Clean Tech deal activity. The Needham & Co. Clean Technology Indices: Energy Creation, Energy Efficiency and Environmental Sciences & Services increased 5.73%, 8.35% and 3.55%, respectively, in December. • Sean Hannan initiated coverage on Itron, Inc. with a Hold rating. Itron is a leading technology provider of meters and related solutions for electric, gas and water utility applications. Edwin Mok initiated coverage on Advanced Energy Industries, Inc. with a Buy rating and a $16 12-month price target and upgraded Sunpower to Buy with a price target of $32. • The DOE announced a series of awards in December, highlighted by $979 million for carbon capture and sequestration (CCS), $564 million to fund 19 biorefineries and $60 million for the interconnection of the national smart grid. Approximately $9.2 billion remains available in DOE funding through ARRA for clean technologies. • Despite the majority of popular media’s belief that all was lost at the Copenhagen Climate Change Conference last month, we see the Conference as an important and successful event for the clean technology industry due to its focus on mobilizing approximately $830 billion over the next ten years in clean technology and deforestation support for developing countries. While the conference failed to produce legally-binding GHG reduction targets, we are encouraged by the EPA’s apparent readiness to monitor GHG, which it now deems a danger to public health - an announcement that was well received by clean tech investors. • Deal activity leveled off in December with 44 M&A announcements; down four from November and nine less then were announced in December 2008. There were three clean tech IPOs in December, up from 2 in November and zero during the same month last year. We are optimistic for the clean tech IPO market as investor interest for the upcoming Solyndra IPO appears to be high. • The Needham & Co. Energy Efficiency Index rose 8.35% in December, outperforming the S&P 500, which rose by 1.78%. The Needham & Co. Energy Creation and Environmental Sciences & Services Indices also outperformed the S&P 500, both increasing by 5.73% and 3.55%, respectively. Figure 1: Needham & Co. Clean Tech Vertical Indices – 11/30/09 – 12/31/09 110 Energy Creation Index Energy Ef f iciency Index Environmental Sciences & Services Index S&P 500 Energy 108 8.35% Effic iency 106 E nergy Creation 5.73% 104 Environmental 102 Sc ienc es & 3.55% Servic es 100 S&P 500 1.78% 98 11/30 12/7 12/14 12/21 12/28 Source: FactSet, Needham & Company, LLC.
  • 2. Table of Contents Needham & Co. Clean Tech Research Recap.......................................................................................... 3 DOE Watch: From Regulator to Rainmaker .......................................................................................... 7 Green Gossip: Legislation, Policy and Developments in the New Energy Era ..................................... 9 Investment & Market Activity ................................................................................................................. 10 Venture Capital & Private Equity...................................................................................................... 10 Mergers & Acquisitions .................................................................................................................... 10 IPO Activity ...................................................................................................................................... 12 Market Performance ................................................................................................................................. 14 Energy Generation ............................................................................................................................ 15 Energy Efficiency.............................................................................................................................. 19 Environmental Sciences & Services.................................................................................................. 21 Tables ......................................................................................................................................................... 22 Needham & Company, LLC’s Clean Technology Universe/Verticals & Sub-Segments Figure 2 Clean Technology Verticals Environmental Sciences and Energy Creation Energy Efficiency Services ! Solar Value Chain ! Power Management/Smart Grid/ ! Haz/Non-Haz Waste Treatment " Silicon producers, wafer Metering " Remediation of contaminated land, ingots, silicon cells and " Efficient grid-level networks and systems that soil, water and buildings. modules, thin-film modules, measure and control energy consumption, vertically integrated, systems various metering technologies. ! Pollution Abatement and integrators, equipment " Air purification and pollution controls, ! Energy Storage indoor air quality, emissions sensors ! Wind Infrastructure " Rechargeable batteries, fuel cells, flywheels, and analyzers Sub-Segments " Components, gearboxes, super capacitors, utility-grade storage structures, turbines, bearings, solutions ! Filtration subsystems " Purification products/services, ! Lighting Efficiency/Advanced Lighting filtration products/services ! Alternative Fuels " Energy efficient lighting and systems, LEDs " Ethanol, biofuels, hydrogen ! Green Materials generation, biodigestors, fuel ! Alt. Propulsion/Alt. Energy Vehicles " Construction, biogenerated, additives " Hybrid vehicles, hybrid drivetrain, electric biodegradable, and green building vehicles materials ! Power Management Semiconductors Source: Needham & Company, LLC. 2 An Investment Analysis by Needham & Company, LLC
  • 3. Needham & Co. Clean Tech Research Recap Solar PV Industry Update: Our 2010 Outlook Strong Recovery to Extend into 2010 as the Industry Broadens Beyond Germany (1/04/10) Y. Edwin Mok – ymok@needhamco.com Conor Irvine – cirvine@needhamco.com Despite overcapacity throughout the solar supply chain, we believe demand for solar products will continue to grow in 2010. We believe growth will be driven by the desire to capitalize on good IRRs in several key regions, the rush to complete installations in anticipation for a sharper FIT cut in Germany, an improved credit market providing project financing, and favorable subsidies in countries such as the U.S, Italy, Japan and China, and the province of Ontario, Canada. Additionally, with prices stabilizing, we believe many solar markets have become more elastic, which has kicked off a new growth cycle in the industry. While a subsidy cut in Germany in the back half of 2010 creates potential risk, we believe a slowdown in Germany could be mitigated by strong growth in other regions. Overall, we believe companies with good cost structure will generate solid profits, and companies with strong project pipelines will deliver outperforming revenue growth. Based on our positive view, we continue to like JASO and SPWRA within our coverage universe. Growth in the worldwide solar market has broadened from Germany into multiple markets. Following the fall of solar instillations in Spain, Germany rose to the occasion and generated half of the worldwide solar instillations in 2009, driven by favorable subsidies that generate favorable IRRs. While Germany is likely to remain one of the most important solar markets, we believe the worldwide solar industry will become less concentrated in 2010, and we expect newly forming solar markets to experience meaningful growth in the next few years. We see upside to consensus revenue estimates in 1H10. As a result of strengthening near term demand and improved order visibility, we believe shipments generally tracked higher for 4Q09 and see un-seasonal sequential growth in various markets in 1Q10. We note that the Street is modeling 1H10 aggregate solar revenue to grow only 3% over 2H09, and 2H10 revenue to grow 19% over 1H10. We believe the Street's estimates are too conservative, as the demand picture continues to improve into the New Year and prices remain stable. Price stabilization driving demand growth in various regions. When prices were falling early in 2009, demand across various end markets became inelastic. However, demand has seen a dramatic uptick in the back half of 2009, as buyers moved off the sideline, which has allowed prices to stabilize. With stable prices, we expect solar markets in various regions to become more elastic, and expect solar installations to grow in 2010 as a result. Polysilicon remains the most oversupplied market in the solar food chain, and we expect prices for polysilicon to continue to fall; however, we believe prices of downstream products are more stable due to the pickup in demand, and we expect margins to expand as a result. We continue to like cost leaders and companies that are leveraged to the U.S. In our opinion, JA Solar Holdings (JASO, Buy) will remain the cost leader in solar cell manufacturing, which should enable the company to gain further market share in European markets and Japan. Among the low cost producers, we believe JASO can deliver above average growth due to continued share gain and its expansion into the OEM module business. We believe SunPower (SPWRA, Buy) is well positioned in the U.S. market, from small scale residential, commercial to large-scale utilities and government projects. Besides being the leading manufacturer of high-efficiency solar products, we believe SPWRA has developed An Investment Analysis by Needham & Company, LLC 3
  • 4. a comprehensive approach in providing a solar power solution that will be a sustainable advantage over the long term. SunPower Corp. – Upgraded to Buy from Under Review (SPWRA) – (12/17/09) Y. Edwin Mok – ymok@needhamco.com Conor Irvine – cirvine@needhamco.com SPWRA: Robust Near-term Demand to Drive Upside, Likely to Overshadow Accounting Issues; Revising SPWRA from Under Review to Buy On 12/17/09, we revised our SPWRA rating to Buy (from Under Review) and set a price target of $32. We believe the recent update on the ongoing internal investigation into accounting issues has improved investor confidence that these issues will be behind the company shortly. Based on strengthening demand in several key markets, including Germany and Italy, and share gains driven by the expansion of SunPower's dealer network, we see upside to estimates in the near term. Heading into 2010, we believe SunPower is best positioned in the growing U.S. market. With the shares trading below levels before the accounting issues, we recommend investors use the weakness as a buying opportunity. Accounting issues still outstanding, but more confident that the impact will be minimal. Although SunPower has not completed the investigation into accounting irregularities, we believe the press release gave investors some reassurance that the accounting issues will have minimal impact to prior financials. We continue to believe these accounting issues have no impact to reported and future revenues. Robust near term demand suggests upside to 4Q09 revenue estimates. Heading into 2010, we are seeing strong demand in several key regions including Germany, Italy and the U.S. Industry participants have confirmed that the near term strength should extend into at least 1H10. We believe SunPower's 2009 revenue guidance looks conservative, and based on strengthened demand, we see upside to consensus estimates for 4Q09 and 2010. SPWRA best positioned to benefit from the growth in the U.S. solar market. In 2010, we continue to believe the U.S. solar market will see substantial growth driven by increased availability of federal stimulus spending and a number of state/local subsidies. We believe SunPower is well positioned in all market segments, from small scale residential, commercial to large-scale utilities and government projects. Advanced Energy Industries, Inc. (AEIS): Inverter Business and Diversification Powering Growth; Initiated Coverage with Buy - (12/15/09) Y. Edwin Mok – ymok@needhamco.com Conor Irvine – corvine@needhamco.com On 12/15/09, we initiated coverage of Advanced Energy Industries, Inc. with a Buy rating and a 12-month price target of $16. As a leader in power conversion technology for advanced thin-film processes, we believe AEIS is well positioned to benefit from a recovery in key end markets, which include semi equipment, flat panel display, data storage and solar manufacturing. With a more diversified business, we believe Advanced Energy's revenues will return to prior peak levels and earnings will surpass prior peak levels even with a potentially 4 An Investment Analysis by Needham & Company, LLC
  • 5. muted semi equipment cycle. We believe its solar inverter business is in the early stage of a multiple year expansion and the company is rapidly gaining market share in the U.S. commercial solar market, which we project will see substantial growth in the coming years. We believe AEIS offers better growth potential than semi equipment companies, and the shares will outperform in 2010. Well positioned to leverage a recovery in several key end markets. We see strong capital spending growth in several end markets in 2010, particularly in semi equipment (largest end market), hard-disk storage and flat panel display. In semi equipment, we project average inventory of key customers will return to normal range of 130 days by 4Q09. Diversification offsets a potentially muted semi equipment cycle, enabling revenue to return to and EPS to surpass prior peak levels. AEIS has increased non-semi revenue from 29% of revenue in 2002 (last semi cycle trough) to 40% in 2009 (recent trough). With a higher mix of non-semi business (better GM), revenues should return to prior peak levels of $350-400MM in 2011, with earnings power over $1/sh. Emerging solar inverter will drive substantial growth. We believe AEIS's inverter business is in the early stages of a multi-year ramp. With its differentiating transformer-less technology, we believe AEIS is rapidly gaining share in the U.S. large- scale solar market, which we estimate will grow at a 40% CAGR from 2009-11. We expect its recent entry into the European market drive incremental growth in 2010. Initiated Coverage of Itron, Inc. (ITRI) – Hold (12/17/09) Sean K.F. Hannan – shannan@needhamco.com Initiating Coverage at Hold On 12/17/09, we initiated coverage of ITRI, a leading technology provider of meters and related solutions for electric, gas and water utility applications, at Hold on valuation and pending improved visibility on timing of opportunities. Through multiple acquisitions and investments, Itron stands at the top of the global meter market that is gaining renewed interest as a core component to the smart grid. Leveraging its established history and deep customer relationships, we believe the company is well positioned to benefit from technology shifts toward advanced meter infrastructure (AMI) and a regulatory environment that is now (slowly) becoming more supportive. It is our view that the space will see healthy double-digit growth over the next few years, and we believe a leader such as Itron has the ability to take share and improve its global position. However, with its international (2/3 of revs.) outlook experiencing some lingering softness and utilities still moving slowly (with decisions or deployments), we view the current valuation as appropriate. Consequently, we are launching coverage at Hold and would be more constructive on pull-backs or through improved visibility that would allow us to increase estimates. Utilities Markets Provide Strong Secular Growth Opportunities Automation and Smart Grid efforts have finally moved to the forefront of utilities’ agendas while the decision processes at state regulators are (slowly) improving. This creates a fertile environment for all AMI players where adoption is showing better economics and acceptance. Operating Margins Poised To Expand With a leaner model, revenue momentum through a strong backlog, and higher tech mix, we expect to see notable Op. margin expansion in next 12-18 months. Strong Global Share & Presence An Investment Analysis by Needham & Company, LLC 5
  • 6. Itron is the leading global provider of meter solutions, with either #1 or #2 share positions in each application and a presence at customers in 130 different countries. Comprehensive & Holistic Product Approach Itron's portfolio approach can help to simplify the process for the risk-averse utilities in a couple of ways: (1) vendor/supplier management and (2) utilizing a solution with components explicitly designed to work together. Clean Technology: Environmental Sciences and Services (01/05/10) While we are now into the second quarter of the recovery and we remain optimistic for 2010 expecting GDP growth in the range of 3.5-4.0%. As has been well publicized, most companies will benefit from a significant degree of operating leverage once the revenue line begins to expand. In our sector we have highlighted Clean Harbors (CLH) as one of our best ideas for 2010 as we think it will be major beneficiary of an economic rebound in the upcoming year. Clean Harbors (CLH, Buy) We continue to recommend purchase of CLH believing that 2010 will be a strong recovery year benefitting from the economic recovery especially in the chemical and refining industries both of which have impacted results significantly over the past year. We continue to highlight that due to its strong industry position and solid cash flow characteristics, CLH has performed reasonably well in a weak economic environment. Also with the acquisition of Eveready completed, CLH has expanded its revenue base by over 50% further strengthening its product offerings and geographic reach. Pricing appears to be hold up well in landfill and incineration and the incineration utilization rates are close to 90%. Also CLH has been active in reducing its overheard expenses targeting a $20mm of cost synergies from the integration of Eveready in 2009 and another $20-$25mm in additional expense reduction in 2010. Following the acquisition, the company has $220mm of cash and debt of $299mm with capital expenditures expected to remain below depreciation levels. Following a disappointing 2009, we expect revenue to expand 34% (due in large part to the Eveready acquisition in for the full year) and EPS to increase from $1.83 in 2009 to $2.61 in 2010. Clean Harbors is a leading provider of environmental services and operator of non-nuclear hazardous waste treatment facilities in North America and Canada, offering technical, site and industrial services. The company’s technical services include collection, transport, treatment and disposal of hazardous and non- hazardous wastes and physical treatment, resource recovery, fuels blending, incineration, landfill disposal, wastewater treatment, lab chemical disposal and explosives management services. We value CLH on an EBITDA basis; and the stock is currently at a 7.0X multiple of 2010 EV/EBITDA. We view this at the low end of the range for the company and have a $70 price target on the company. CLH is entering 2010 with good visibility, a solid long-term market position, and underlying fundamentals that are very solid. With the economy slated for healthy growth in 2010, we believe the outlook remains very positive for CLH. 6 An Investment Analysis by Needham & Company, LLC
  • 7. DOE Watch – From Regulator to Rainmaker With approximately $40 billion at its disposal for clean technology funding, the DOE has become the most powerful and important clean technology investor, expanding its regulatory role to include that of rainmaker, through a steady shower of government funds. Out of the $32.7 billion available to the DOE through the American Reinvestment and Recovery Act (ARRA), the DOE has awarded $21.8 billion and spent $1.7 billion, according to the DOE. Figure 3: DOE Funds Awarded & Currently Available Under ARRA as of 12/25/09 (Billions) Spent Scientific Research Advanced $1.7 $1.6 Research Carbon Capture/ Projects Agency Storage $0.4 Still $3.4 Loan Guarantee Available Program Energy $9.2 $32.7 Billion $4.0 Efficiency & Renewable Excludes $4 Awarded Smart Grid & Energy Billion Loan $21.8 $16.8 Guarantee Efficient Electrical Program Transmission $4.5 Cold War Nuclear Clean Total: $36.7 Billion Up $6.0 Source: DOE, Needham & Company, LLC. The DOE announced a series of awards in December, highlighted by $979 million for carbon capture and sequestration (CCS), $564 million to fund 19 biorefineries and $60 million for the interconnection of the national smart grid. Figure 4: Significant DOE Investments, Grants and Loans Announced in December Amount Date Program Recipient(s) (MM) Description - American Electric Power Company Accelerate the development of advanced coal - Southern Company technologies with carbon capture and storage at 4-Dec Clean Coal Power Initiative Round III - Summit Texas Clean Energy $979 commercial-scale Accelerate the construction and operation of 19 pilot, demonstration, and commercial scale biorefinery 4-Dec Advanced Biorefinery Projects 19 biorefineries $564 facilities - Electrofuels - Innovative Materials & Processes for Advanced Carbon Capture Technologies - Batteries for Electrical Energy Storage The DOE Annouced a second funding round for 7-Dec ARPA-E in Transportation $100 ARPA-E for three funding opportunities Build an activated carbon manufacturing facility near 9-Dec Loan Guarantee Program Red River Environmental Products, LLC $245 Coushatta, Red River Parish, Louisiana Promote collaborative long-term analysis and planning for the Eastern, Western and Texas Smart Grid - electricity interconnections, which will help states, Resource Assesment & - Eastern Interconnection: $30MM utilities, grid operators, and others prepare for future Interconnection-Level Transmission - Western Interconnection: $26.5MM growth in energy demand, renewable energy 18-Dec Analysis & Planning - Texas Interconnection: $3.5MM $60 sources, and smart grid technologies. - Fuel from Sunlight Hub - Modeling & Simulation for Nuclear Reactors 22-Dec Enegry Innovation Hubs Three DOE research Hubs $366 - Energy Efficient Building Systems Design Source: DOE, Needham & Company, LLC. An Investment Analysis by Needham & Company, LLC 7
  • 8. Carbon Capture & Sequestration Award – 12/04/09 The $979 million in funding for CCS will be in addition to $2.2 billion of capital from the three projects’ stakeholders, including American Electric Power (AEP), Southern Company, Summit Texas Clean Energy and partners. The project aims to develop CCS as a deployable technology in eight to ten years, able to achieve an efficiency capture target of 90%. The AEP project team includes APCo, Schlumberger Carbon Services, Battelle Memorial Institute, CONSOL Energy and Alstom. The project is expected to last 10 years and has a DOE contribution of $334MM. The Southern Company project team includes Mitsubishi Heavy Industries, Schlumberger Carbon Services, Advanced Resources International, Geological Survey of Alabama, EPRI; Stanford University, University of Alabama, AJW Group, and University of Alabama at Birmingham. It is projected to last 11 years and has a DOE contribution of $295MM. Figure 5: Participant Breakdown of $979 million in DOE Funding for CCS Mitsubishi Heavy Industries, University of Texas, Schlumberger Carbon Services, Siemens technology Advanced Resources International, EPRI APCo, Schlumberger Carbon Services, Battelle Memorial Institute, CONSOL Energy, Alstom $350 $334 $295 Southern Company AEP Texas Clean Energy Project Source: DOE, Company Reports, Needham & Company, LLC. Red River Awarded DOE Loan Guarantee – 12/09/09 Red River Environmental Products was awarded $245MM under the DOE Loan Guarantee Program for the construction of an activated carbon manufacturing facility in Louisiana. This is the fourth loan given out under the program and the second largest, as shown in figure 6. Approximately $3.2 billion remains available under the program. We note that Red River is the first non Energy Creation company to receive a loan under the program. We expect the DOE to continue to focus on carbon mitigation technologies as legislators take a more dovish stance towards fossil-fuels in the aftermath of international stalemate in Copenhagen and a stalled federal cap-and-trade program in the US. Figure 6: DOE Loan Guarantee Program Recipients (MM) Beacon Nordic Date Offered Recipient Amount (MM) Use of Funds Power Windpower Construction of activated carbon $43 $16 Red River Environmental manufacturing facility near Solyndra $535 9-Dec Products, LLC $245 Coushatta, Red River Parish, LA Support expansion of wind turbine assembly plant to 1MW in Pocatello, Available Red River $3,161 2-Jul Nordic Windpower $16 ID $245 Support construction of 20MW flywheel energy storage plant in 2-Jul Beacon Power $43 Stephentown, NY Construction of commercial-scale manufacturing plant of its proprietary 20-Mar Solyndra, Inc. $535 solar modules Source: DOE, Needham & Company, LLC. 8 An Investment Analysis by Needham & Company, LLC
  • 9. Green Gossip – Legislation, Policy and Developments in the New Energy Era Expectations were high leading up to the Copenhagen Climate Change Conference as President Obama announced early in the month that he would attend the closing in efforts to secure an agreement and as the triad of potential spoilers (the US, China and India) had already announced their intent to participate through voluntary carbon cuts. Domestically, things appeared to be progressing with or without the wishes of Congress as the EPA declared greenhouse gases a danger to public health, potentially leading to new emissions regulation and causing the Needham Energy Creation index to rally, led by the Solar index. As the Copenhagen Conference drew to a close, greens and the usual myriad of climate concerned countries, such as Greenland and Denmark, deemed it a failure. We disagree and see the framework, in the form of the 3-page “Copenhagen Accord”, as a foundation and as a building block for progress. While we acknowledge the outcry over the conference’s inability to produce legally binding GHG reduction targets, we also note that very serious money in the tune of $30 billion for the period 2010 to 2012 and $100 billion annually by 2020 for a clean technology fund to assist developing countries is being mobilized and could act as a follow up catalyst to the various government stimulus packages that are currently buoying the sector. Furthermore, a successful conference in our opinion was not necessarily one that succeeded in efforts to legally bind nations to targets and goals for the purpose of mitigating the possibility of catastrophic climate change, as many investors and scientists are not convinced that climate change is man-made, but one that’s results produced the generation of some sort of clean technology fund to further support the energy infrastructure transformation currently taking place. We believe the conference was successful in doing so and will be tracking the development related to these funds. Developed countries’ insistence on conditionality attached to these funds should make sure the funds aren’t seen as retribution or aid for developing countries, but instead are used for clean technology development and to fight deforestation. While we do not see these funds as a near-term catalyst, we believe it could act as an important long-term growth driver for the overall sector. Progress on establishing a price on carbon was nascent and hopes for implementing a global cap-and-trade program or anything legally binding was shot; however, a framework for establishing both was put into place if and when the US and other countries choose to implement it at home first. This is a prospect we doubt will take hold prior to next year’s Climate Change Conference in Mexico City. Senior Democrats in carbon-intensive and agriculture-focused states such as Indiana, North Dakota, Louisiana and Nebraska are concerned about the effects it could have on jobs and other Democratic Senators are hesitant to support what is essentially a tax ahead of midterm elections in the wake of economic uncertainty and stubbornly high unemployment. While we are still optimistic for an energy reform bill in 2010, we believe that if cap-and-trade is to be a part of that bill it is likely to be held off until at least 2011. But then of course if there is a Democratic mid-term drubbing, cap-and-trade might not be so easy to push through in its aftermath. An Investment Analysis by Needham & Company, LLC 9
  • 10. Investment & Market Activity Venture Capital & Private Equity Investor appetite for clean tech investment remains robust, highlighted by the continued influx of venture capital and private equity investment. In 2009, world wide PE & VC investment was $11.655 billion, down 18% from the highs of 2008 but up 72% from 2007. Energy Creation continues to attract the lion’s share of private investment; however, investment opportunities arising from stimulus spending directed at the smart grid is spurring interest in Energy Efficiency while expectations for emission-related legislation is buoying investment in Environmental Sciences & Services, as shown in figure 7. Figure 7: World Wide PE & VC Investment in Clean Tech – 1999 to 2009 $ 16,000 (MM's) $ 14,000 $ 12,000 Environmental Science & Services $ 10,000 Energy Efficiency $ 8,000 Energy Creation $ 6,000 $ 4,000 $ 2,000 $ - 00 99 01 02 03 06 04 05 07 08 09 19 20 20 20 20 20 20 20 20 20 20 Source: Cleantech Group, Needham & Company, LLC. Clean tech financing activity in December was highlighted by Hudson Clean Energy Partners closing its first fund, which is over $1 billion. The fund will invest in late stage energy creation and energy efficiency technologies in the range of $50 million to $150 million on average per transaction. The firm was founded in 2007 and is led by John Cavalier and Neil Auerbach. Mergers & Acquisitions The clean tech industry has seen a steady rise of M&A activity over the past few years reflective of the industry’s growth and as shown in figure 8 below. Activity has increased as a growing number of players, previously unrelated to clean technology, have made acquisitions to gain exposure to the space. December saw a number of companies enter the clean technology space via acquisition including Panasonic and Taiwan Semiconductor Manufacturing Co. (TSMC) through Sanyo and Motech, respectively. We expect this trend to continue and expect an influx of new players to continue to enter the space via acquisitions, such as defense and telecom companies, based largely on opportunities presented by the smart grid. 10 An Investment Analysis by Needham & Company, LLC
  • 11. Figure 8: World Wide Clean Tech M&A Activity - 2005 to 2009 Environmental Sciences & 455 total Services 94 Energy Efficiency 361 total 313 total 87 94 Energy Creation 257 total 100 70 86 66 43 111 total 267 35 188 20 147 144 56 2005 2006 2007 2008 2009 Source: Cleantech Group, Needham & Company, LLC. December 2009 saw 44 M&A announcements; a decrease of four deals from November, and nine less than December 2008. Energy Creation saw the bulk of deal activity in December 2009, in-line historically, with 25 transactions. Of those transactions, seven were biofuel, eight were solar and five were wind. Figure 9: World Wide Clean Tech M&A Activity – December 2009, Y/Y & M/M 36 Dec-08 Nov 09 Dec 09 27 25 11 11 10 10 8 7 Energy Creation Energy Efficiency Environmental Sciences & Services Source: Cleantech Group, Needham & Company, LLC. Selected Clean Tech M&A in December A few noteworthy transactions in our opinion are listed below. Clipper Windpower announced it sold a 49.5% stake to United Technologies on December 19th. The proceeds are to strengthen the company’s balance sheet, pursue strategic initiatives and facilitate project financing. Also, noteworthy in the wind industry was PG&E’s undisclosed acquisition of Iberdrola’s Manzana Wind Farm, a 246 MW project under development in California that would be PG&E’s first wind farm. The project will cost An Investment Analysis by Needham & Company, LLC 11
  • 12. approximately $900 million to develop, which includes payment to Iberdrola. Iberdrola is developing and building the wind farm while PG&E will own and operate it. PG&E, along with the other California utilities, are trying to achieve a 33% renewable portfolio standard (RPS) by 2020. The upstream solar market saw some activity this month with the undisclosed acquisition of Eversol by MEMC and with TSMC taking a 20% stake in Motech Industries. The investment marks TSMC’s entrance into the solar market, which was expected; however, the size of the investment surprised on the upside in light of TSMC’s board reportedly approving only a $50 million investment in August. On 12/09/09 EnerNOC acquired the 30-person monitoring-based commissioning outfit, Cogent, for an undisclosed amount. Figure 10: Selected Clean Tech M&A – December 2009 Target Buyer Deal Size Date Annouced Subsector Clipper Windpower United Technologies Corporation $270,000,000 12/9/2009 Wind Cogent Energy, Inc. EnerNOC Undisclosed 12/9/2009 Smart Grid Taiwan Semiconductor Motech Industries Manufacturing Co. $193,000,000 12/10/2009 Solar 246 MW Manzana wind farm -:- assett of Iberdrola Renewables, Inc. PG&E Undisclosed 12/11/2009 Wind California Micro Devices ON Semiconductor Corp $108,000,000 12/14/2009 Lighting Eversol MEMC Electronic Materials, Inc. Undisclosed 12/21/2009 Solar CO2 Solution, Inc. Codexis, Inc. Undisclosed 12/21/2009 Clean Coal Total Agroindustria Canavieira S/A Petrobras $84,000,000 12/22/2009 Biofuels Source: Cleantech Group, Needham & Company, LLC. IPO Activity Clean tech IPOs in December rose to 3 from 2 in November. There were no IPOs during the same month last year. China Longyuan Power Group, China’s largest wind power producer, raised approximately $2.26 billion via an initial public offering. The IPO is the third largest clean tech IPO to date, behind Iberdola’s $6.6 billion IPO in December 2007 and EDP Renovaveis’s $2.4 billion in June 2008. On 12/31/09 shares of Longyuan were up 12.4% since it began trading on 12/10/09. Figure 11: Select Clean Tech M&A Transactions – December 2009 Date Company Ticker Exchange Offer Shares 12/3/2009 China Forestry Holdings Co., Ltd 00930 Hong Kong Futures Exchange $0.27 750,000,000 12/10/2009 China Longyuan Electric Power Group Corp 0916 Hong Kong Futures Exchange $1.06 2,142,860,000 12/16/2009 Pure Klimaschutz 4CT Frankfurt Stock Exchange Undisclosed Undisclosed Source: Cleantech Group, Needham & Company, LLC. 12 An Investment Analysis by Needham & Company, LLC
  • 13. In 2009, there were 13 clean tech IPOs, according to Cleantech Group. On average the shares of clean tech companies that went public last year returned 25.8%, driven by the outperformance of China Singyes Solar and Duoyuan Global Water, Inc. Figure 12: IPO Performance Year to Date, as of 12/31/09 & IPOs by Needham & Co. Clean Tech Vertical – 2001 to 2009 221% 70 Shares of Cleantech Companies to Environmental Science & IPO in 2009 are up an average of Services 60 26%, as of 12/31/09 Energy Efficiency 50 64% 34% Energy Generation 12% 20% 22% 40 5% 5% 11% -7% -6% 30 -11% -35% 20 gy YS an z gs r in g c c . s d c ut la rp In In ng er In Lt yu in M ch So cl Co gs En er ld di s, on ng cy en as at ol Ho em s in gy isi 10 Lo Re an ye zh im yH W o ld ti v er st ns di ng en Kl a al al Sy s tr H En ul in In ee Si Sh b et re M Ch R lo re Gr 23 M a Pu a ST G ro Fo m in A1 a Eu ag an Ch hi n 0 a in yu M C Ch uo 2001 2002 2003 2004 2005 2006 2007 2008 2009 D Source: Cleantech Group, FactSet Needham & Company, LLC. Figure 13: IPOs by Needham & Co. Clean Tech Vertical – 2001 to 2009 2001 2002 2003 2004 2005 2006 2007 2008 2009 Energy Generation 0 3 1 1 14 35 26 13 6 Energy Efficiency 0 0 0 2 6 8 15 1 2 Environmental Science & Services 2 3 0 2 12 15 11 3 5 Total 2 6 1 5 32 58 52 17 13 Source: Cleantech Group, Needham & Company, LLC. Cancelled or Delayed Clean Tech IPOs While Longyuan enjoyed a successful IPO in December, Trony Solar, a Chinese solar module maker, postponed plans for its IPO which was scheduled for December as well. The delayed Trony IPO comes on the heels of the lackluster STR Holdings IPO last month. STR Holdings opened trading at $10/share, below its offering range of $11 to $13, which had already been reduced from $13 to $15. Upcoming Clean Tech IPOs We are optimistic for the clean tech IPO market as investor interest for the upcoming Solyndra IPO appears to be high. Solyndra, a California based commercial-scale cylindrical thin-film solar company, filed a registration statement for a $300 million IPO on the Nasdaq. Solyndra (which would trade under the symbol SOLY) would use the proceeds for the construction of the company’s manufacturing facility in Fremont. Solyndra could buck the recent dismal solar IPO trend due to technological differentiation in its use of mirrors and due to solid financing thus-far that includes $535 million from the DOE Loan Guarantee Program. Codexis Inc., a California based cellulosic ethanol company that uses a biocatalyst process to produce fuel, filed for a $100 million IPO on the Nasdaq. Shell, the largest advocate of biofuels of the oil majors, owns approximately 20% the company. Codexis (which would trade under the symbol CDXS), intends to use the proceeds for working capital and other general purposes as well as to possibly acquire technologies or companies. The company backed out of previous plans to go public in September 2008, citing unfavorable market conditions. An Investment Analysis by Needham & Company, LLC 13
  • 14. Market Performance The Needham & Co. Energy Efficiency Index rose 8.35% in December, outperforming the S&P 500, which rose by 1.78%. The Needham & Co. Energy Creation and Environmental Sciences & Services also outperformed the S&P 500, both increasing by 5.73% and 3.55%, respectively. Figure 14: Needham & Co. Clean Tech Vertical Indices – 11/30/09 to 12/31/09 Energy 8.35% Effic ienc y Energy Creation 5.73% Environmental Sc ienc es & 3.55% Servic es S&P 500 1.78% Source: FactSet, Needham & Company, LLC. Leading the Needham & Co. subsectors in December were LED, Non-Toxic Materials and Smart Grid, while Hazardous Waste and Wind lagged, as shown below in figure 3. A complete listing of the companies comprising each of these subsectors is detailed at the back of this report. Figure 15: Needham & Co. Clean Tech Subsector Indices – 11/30/09 to 12/31/09 LED 17.18% Non-Toxic Materials 14.98% Smart Grid 13.66% Energy Storage 11.27% Solar 10.84% Material Science 9.27% Power Semiconductor 7.50% Infrastructure 6.72% W ater Filtration 4.87% W ave, 4.00% Biomass & Geothermal Biofuels 3.10% Air Pollution Control 1.86% S&P 500 1.78% Alternative Vehicle 1.12% W ind 0.93% Hazardous W aste Services 0.08% Source: FactSet, Needham & Company, LLC. 14 An Investment Analysis by Needham & Company, LLC
  • 15. Energy Creation The Needham & Co. Energy Creation Index rose 5.73% in November versus the S&P 500 which increased 1.78%. Figure 16: Needham & Co. Energy Creation Subsector Indices – 11/30/09 to 12/31/09 Solar 10.84% W ave, Biomass & 4.00% Geothermal Biofuels 3.10% W ind 0.93% Source: FactSet, Needham & Company, LLC. The Needham & Co. Solar Index which is comprised of 46 companies, led the Energy Creation Index advancing 10.84%. The index returned an average 14% in December, led by Amtech Systems and JA Solar, which increased 85.1% and 46.5%, respectively. BTU International (Buy rated) rose 39% as the company, which supplies advanced thermal processing equipment to the alternative energy and electronics markets, is well positioned for improvement in solar equipment orders. The company has introduced several new products and we would expect increased traction in the thin film area by the 2H of 2010. The company's stock price is well supported by a book value of $4.30 per share and net cash of $1.71 per share. Akeena Solar (Hold rated) was up 30% in December due to its mid-month announcement of selling its Andalay AC panels through 21 Lowe's home- improvement centers in California. This represents a new distribution channel for Akeena. The AC panels have built-in inverters that produce AC power, so there is no DC wiring required for installation. Built-in inverters offer the advantage of generating more energy output especially in partially shaded conditions. An Investment Analysis by Needham & Company, LLC 15
  • 16. Figure 17: Needham & Co. Solar Index – 11/30/09 to 12/31/09 A mtech Systems Inc. 85.1% JA Solar Holdings Co. Ltd. (A DS) 46.5% Spire Corp. 40.3% BTU International Inc. 38.9% Solartech Energy Corp. 33.0% Topco Scientif ic Co. Ltd. 32.3% Canadian Solar Inc. 30.9% A keena Solar Inc. 30.2% Neo Solar Pow er Corp. 25.9% Hoku Scientif ic Inc. 23.6% Sunw ays A G 22.5% A scent Solar Technologies Inc. 19.1% EMCORE Corp. 18.9% ReneSola Ltd (A DS) 18.7% STR Holdings Inc. 18.1% GT Solar International Inc. 17.1% China Sunergy Co. Ltd. (A DS) 16.7% Trina Solar Ltd. (A DS) 15.9% Solarf un Pow er Holdings Co. Ltd. (A DS) 15.8% SunPow er Corp. (Cl A ) 14.6% First Solar Inc. 13.7% A pplied Materials Inc. 13.2% MEMC Electronic Materials Inc. 13.1% Roth & Rau A G 12.1% Wacker Chemie A G 11.4% Y ingli Green Energy Holding Co. Ltd. (A DS) 11.3% Suntech Pow er Holdings Co. Ltd. (A DS) 11.2% DayStar Technologies Inc. 10.9% Q-Cells S.E. 9.1% T he 46 Evergreen Solar Inc. 7.9% companies in Energy Conversion Devices Inc. 6.6% the Needham & Real Goods Solar Inc. 5.6% 3.6% Co. Solar Index centrotherm photovoltaics A G Gintech Energy Corp. 3.1% Returned an Solar-Fabrik A G 2.1% average of 14% Solon SE 2.0% in December SolarWorld A G 1.7% aleo solar A G -0.5% E-Ton Solar Tech. Co. Ltd. -0.6% PV Crystalox Solar PLC -2.9% Green Energy Technology Inc. -3.4% Websol Energy Systems Ltd. -5.4% Premier Pow er Renew able Energy Inc. -8.3% Conergy A G -9.6% LDK Solar Co. Ltd. (A DS) -10.1% Solar Pow er Inc.-12.1% Source: FactSet, Needham & Company, LLC. 16 An Investment Analysis by Needham & Company, LLC
  • 17. The Needham & Co. Wind Index, which is comprised of 20 companies, lagged the Energy Creation Index advancing 0.93%%. The index returned an average 3.0% in December, led by American Superconductor and Clipper Windpower, which increased 23.2% and 21.1%, respectively. Figure 18: Needham & Co. Wind Index – 11/30/09 to 12/31/09 American Superconductor Corp. 23.2% Clipper Windpow er PLC 21.1% Catch the Wind Inc. 16.4% Suzlon Energy Ltd. 15.2% NEPC India Ltd. 13.4% REpow er Systems AG 13.3% Broadw ind Energy Inc. 13.1% MagneTek Inc. 11.6% A BB Ltd. 8.4% A-Pow er Energy Generation Systems Ltd. 6.6% A cciona S.A. 6.5% Kaydon Corp. 0.6% Energy Composites Corp. 0.2% Nordex A G -1.0% Xinjiang Goldw ind Science & Technology Co. Ltd. -2.7% Gamesa Corporacion Tecnologica S.A . -7.2% V estas Wind Systems A /S -8.9% A AER Inc. -19.2% GC China Turbine Corp. -24.4% Composite Technology Corp. -26.4% Source: FactSet, Needham & Company, LLC. An Investment Analysis by Needham & Company, LLC 17
  • 18. Shares of American Superconductor have been driven higher by favorable developments in both its wind and superconducting wire businesses. In addition, in early December, management reiterated revenue and earnings guidance for the current year ending March and for the out-year. In its fast-growing wind power business, which represents over three-quarters of its revenues, AMSC continues to benefit from strong near-term growth drivers, notably the continued strong investment by Chinese wind turbine manufacturers, and longer term by potential new growth opportunities in the fast-growing off-share wind power market. We expect business to remain strong with AMSC's largest customer, Sinovel, the number one wind turbine manufacturer in China, continues to ramp production at the same time that the company's other wind turbine manufacturers in China, notably Dongfang and CSR Zelri, scale up production. AMSC has an active new product pipeline, including the next-generation PMW4000W for its new wind turbine designs and a new solar farm grid interconnection product. The company is also working on a 10MW offshore high- temperature superconductor (HTS)-based wind turbine called SeaTitan. While it's still a few years out, SeaTitan will follow a similar model that AMSC executed with its core electrical components in its current portfolio of wind turbines, namely license the HTS wind turbine design, then sell the HTS wire and electrical components, but with the potential for $1M of total content versus $60,000- $80,000 for its current wind turbine designs. AMSC believes the addressable market for SeaTitan could be as large as $1B by 2016. AMSC's shares have also gotten some lift from developments around the proposed Tres Amigas power hub in New Mexico, which will link three power grids in the U.S. and Canada and will incorporate the company's superconducting wire. Tres Amigas in December submitted filings with the Federal Energy Regulatory Commission (FERC) to move forward with the project, in which AMSC has a minority equity interest. As this project moves forward, we believe it will represent another important validation of the company's superconductor technology. Elsewhere in the wind sector, A-Power Energy Generation Systems, Ltd., which provides distributed power generation systems in China and manufactures wind turbines, last month announced that Shenyang Power Group (SPG), together with affiliates of U.S. Renewable Energy Group (US-REG) and Cielo Wind Power, LP ("Cielo Wind"), have entered into a definitive agreement for their ownership of a project company to develop a 600 MW wind farm in Texas. A- Power has been designated to supply wind turbines to this project. General Electric Co. in early December announced a $1.4 billion contract from Caithness Energy to supply its 2.5xl wind turbines and related services for the massive 845 MW Shepherds Flat wind farm project in Oregon, which is expected to be the largest ever. Construction is scheduled to start next year and is expected to be finished in 2012. GE will also supply 10 years of operational and maintenance services. The Shepherds Flat wind farm will supply renewable energy to Southern California Edison. Also in December, Danish blade manufacturer LM Glasfiber announced a five- year supply contract for a minimum of 1,500 MW with Samsung, a new entrant to the wind power market which plans to launch a new line of 2.5MW wind turbines. The government of Brazil announced it would contract 1.8GW of wind capacity, coming from 71 wind farms over a 20-year period. 18 An Investment Analysis by Needham & Company, LLC
  • 19. Energy Efficiency The Needham & Co. Energy Efficiency Index rose 8.35% in December versus the S&P 500 which increased 1.78%. The Needham & Co. LED index, which is comprised of 7 companies, led the Energy Efficiency Index, advancing 17.2% followed by the Smart Grid Index, which is comprised of 12 companies and rose by 13.7%. Figure 19: Needham & Co. Energy Efficiency Subsector Indices – 11/30/09 to 12/31/09 LED 17.2% Smart Grid 13.7% Energy Storage 11.3% Power 7.5% Semiconductor Infrastructure 6.7% Alternative 1.1% Vehicle Source: FactSet, Needham & Company, LLC. The companies comprising the LED index (market cap weighted) returned an average 17.2% in December, propelled by above average gains from Supertex and Cree, which increased 24.6% and 17.9%, respectively. Figure 20: Needham & Co. LED Index – 11/30/09 to 12/31/09 Supertex Inc. 24.6% Cree Inc. 17.9% Diodes Inc. 16.4% Universal Display Corp. 15.7% Orion Energy Systems 9.2% Inc. LSI Industries Inc. 8.8% Nexxus Lighting Inc. -20.9% Source: FactSet, Needham & Company, LLC. The companies comprising the Smart Grid index returned an average 3.6% in December, led by Telvent, MYR Group and EnerNOC, which increased 22.0%, 15.7% and 14.9%, respectively. We note that both Telvent and MYR Group are service companies, while EnerNOC is a software/ service company. We believe An Investment Analysis by Needham & Company, LLC 19
  • 20. shares of the service companies are demonstrated stronger momentum during the month versus the metering companies, which realized sizable gains during mid 2009 (as a result of the federal stimulus announcement followed by rounds of utility award announcements). Figure 21: Needham & Co. Smart Grid Index – 11/30/09 to 12/31/09 Telvent GIT S.A . 22.0% M Y R Gro up Inc. 15.7% EnerNOC Inc. 14.9% It ro n Inc. 11.2% Quant a Services Inc. 11.1% Co mverg e Inc. 9.3% ESCO Techno lo g ies Inc. 7.3% Echelo n Co rp . 4.5% A mb ient Co rp . -0.7% Po werSecure Int ernat io nal Inc. -12.6% Zenerg y Po wer PLC -18.3% B eaco n Po wer Co rp . -21.5% Source: FactSet, Needham & Company, LLC. The Needham & Co. Power Semis Index, which is comprised of 18 companies, advanced 7.5%%, in December. The companies comprising the index returned an un weighted average of 16.3%, led by California Micro Devices (which was acquired by On Semiconductor for $4.70 per share) and Cirrus Logic, which increased 57.0% and 25.6%, respectively. Texas Instruments, the largest in market cap by approximately 3.5 fold, weighed on the index with a monthly return of only 3.0%. Figure 22: Needham & Co. Power Semis Index – 11/30/09 to 12/31/09 C alifo rnia M icro D evices C o rp. 57.0% C irrus Lo gic Inc. 25.6% F airchild Sem ico nducto r Internatio nal Inc. 23.3% A dvanced A nalo gic T echno lo gies Inc. 23.1% Intersil C o rp. (C l A ) 18.7% Internatio nal R ectifier C o rp. 18.2% Vo lterra Sem ico nducto r C o rp. 15.9% M axim Integrated P ro ducts Inc. 15.5% IXYS C o rp. 15.1% M icrel Inc. 14.7% ON Sem ico nducto r C o rp. 13.7% Linear T echno lo gy C o rp. 13.3% M o no lithic P o wer System s Inc. 11.5% P o wer Integratio ns Inc. 8.2% Sem tech C o rp. 6.2% A nalo g D evices Inc. 5.3% N atio nal Sem ico nducto r C o rp. 5.2% T exas Instrum ents Inc. 3.0% Source: FactSet, Needham & Company, LLC. 20 An Investment Analysis by Needham & Company, LLC
  • 21. Environmental Sciences & Services The Needham & Co. Environmental Sciences & Services Index rose 3.55% in December versus the S&P 500 which increased 1.78%. The Needham & Co. Non- Toxic Materials Index, which is comprised of 8 companies, led the Environmental Sciences & Services Index, advancing 14.98%. Figure 23: Needham & Co. Environmental Sciences & Services Subsector Indices – 11/30/09 to 12/31/09 Non-Toxic 14.98% Materials Material Science 9.27% Water Filtration 4.87% Air Pollution 1.86% Control Hazardous 0.08% Was te Services Source: FactSet, Needham & Company, LLC. Headwaters and Hexcel led the Index increasing, increasing 38.4% and 23.0%, respectively. Figure 24: Needham & Co. Non-Toxic Materials Index – 11/30/09 to 12/31/09 Headw aters Inc. 38.4% Hexcel Corp. 23.0% KHD Humboldt Wedag 17.5% Kadant Inc. 10.7% Zoltek Cos. 5.8% Landec Corp. -0.6% Tennant Co. -3.8% Source: FactSet, Needham & Company, LLC. An Investment Analysis by Needham & Company, LLC 21
  • 22. Figure 25: Needham & Company, LLC’s Clean Technology Universe Closing Shares Market 12 Mo. Price 52-Week Out. Cap. COMPANY (Disclosures) Subsector Symbol Rating 01/06/10 High Low (mil.) (mil.) Analyst Energy Creation Advanced Energy Industries, Inc. (B, D, E, G, J) Solar Industry AEIS Buy $16.66 $16.82 $5.36 43 700 Mok Akeena Solar Inc. (B, G) Solar Industry AKNS Hold 1.41 2.61 0.58 28 49 Kundtz American Superconductor Corp. (B, G, J1) Wind Power & Grid Products AMSC Buy 42.87 43.50 11.66 43 1,891 Ricchiuti Applied Materials, Inc. (B, G) Solar Mfg. Equipment AMAT Hold 14.16 14.57 8.19 1,333 18,987 Mok BTU International, Inc. (B, G, J1) Solar Mfg. Equipment BTUI Buy 6.26 8.30 2.66 9 58 Kundtz JA Solar Holdings Co. Ltd. (B, G) Solar PV Technology JASO Buy 6.80 6.95 1.77 169 1,142 Mok LDK Solar Co. Ltd. (B) Solar PV Technology LDK Hold 7.95 16.47 3.75 109 900 Mok MEMC Electronic Materials, Inc. (B) Solar PV Technology WFR Hold 14.61 21.36 11.32 229 3,121 Mok Solar Power Inc. (B, E) Solar Industry SOPW Buy 1.24 1.90 0.42 38 62 Kundtz SunPower Corp. (B, E, G) Solar PV Technology SPWRA Buy 25.77 44.46 19.70 84 2,497 Mok Energy Efficiency Echelon Corporation (B, G) Smart Grid ELON Buy $11.97 $15.38 $5.13 41 491 Hannan ESCO Technologies, Inc. (B) Smart Grid ESE Buy 35.16 46.87 29.04 27 929 Hannan Fuel Systems Solutions, Inc. (B, D, G, J) Alternative Energy FSYS Buy 48.01 52.53 9.83 16 844 Kundtz Itron, Inc. (B, G) Smart Grid ITRI Hold 71.92 72.20 40.10 35 2,886 Hannan IXYS Corporation (B, G) Analog/Mixed Signal IXYS Buy 6.95 11.00 5.61 31 216 Essi, Jr. LSI Industries (B, E, G) LED Lighting LYTS Buy 8.11 8.48 2.75 22 195 Ricchiuti Maxwell Technologies Inc. (B, E, G) Alternative Energy MXWL Buy 18.13 21.81 4.50 21 472 Kundtz Monolithic Power Systems, Inc. (B, G) Analog/Mixed Signal MPWR Buy 23.10 25.26 10.67 36 805 Essi, Jr. ON Semiconductor Corporation (B, D, E, G, J) Analog/Mixed Signal ONNN Restricted 8.90 9.12 3.17 379 3,783 Essi, Jr. Power Integrations Inc. (B, G, J1) Analog/Mixed Signal POWI Hold 36.02 37.15 16.75 32 971 Essi, Jr. Supertex, Inc. (B, G) Analog/Mixed Signal SUPX Hold 28.19 32.98 18.43 13 364 Essi, Jr. Ultralife Corporation (B, G, J1) Alternative Energy ULBI Buy 4.28 14.15 3.42 18 73 Kundtz Universal Display Corporation (B, G, J1) OLED Lighting PANL Hold 14.17 14.26 5.04 36 520 Ricchiuti Volterra Semiconductor Corp. (B, G) Analog/Mixed Signal VLTR Hold 18.45 20.17 6.16 25 429 Essi, Jr. Environmental Sciences & Services American Ecology Corp. (B, G) Hazardous Waste ECOL Hold $17.25 $21.21 $13.56 18 313 Kundtz Ceco Environmental Corp. (B, G) Air Pollution Control CECE Buy 3.96 4.51 1.80 15 57 Kundtz Ceradyne, Inc. (B, G, J1) Diversified Technology CRDN Hold 19.35 25.07 14.27 27 497 Ricchiuti Clean Harbors Inc. (B) Hazardous Waste CLH Buy 61.05 65.18 40.90 23 1,600 Kundtz Fuel Tech Inc. (B, G) Air Pollution Control FTEK Hold 8.10 14.15 7.01 25 196 Kundtz Heritage-Crystal Clean Inc. (B, G) Hazardous Waste HCCI Hold 11.01 13.80 6.50 11 118 Kundtz PMFG, Inc. (B, D, G, J) Air Pollution Control PMFG Hold 16.60 18.50 3.96 13 220 Kundtz Tennant Company (B) Industrial Cleaning TNC Hold 26.56 33.37 7.61 19 497 Kundtz Source: FactSet, Needham & Company, LLC. 22 An Investment Analysis by Needham & Company, LLC