Recomendados

Recomendados
Más contenido relacionado
La actualidad más candente
La actualidad más candente (20)
Destacado
Destacado (17)
Similar a Research Poster 2016
Similar a Research Poster 2016 (20)
Research Poster 2016
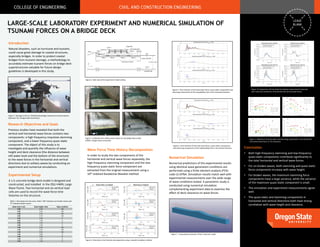
- 1. LARGE–SCALE LABORATORY EXPERIMENT AND NUMERICAL SIMULATION OF TSUNAMI FORCES ON A BRIDGE DECK Numerical Simulation Numerical predictions of the experimental results using identical wave generation conditions are performed using a finite element analysis (FEA) code LS-DYNA. Simulation results match well with experimental measurements over the wide range of wave conditions tested. A parametric study is conducted using numerical simulation complementing experiment data to examine the effect of deck clearance on wave forces. Introduction Natural disasters, such as hurricane and tsunami, could cause great damage to coastal structures, especially bridges. In order to protect coastal bridges from tsunami damage, a methodology to accurately estimate tsunami forces on bridge deck superstructures valuable for future design guidelines is developed in this study. Conclusion • Both high-frequency slamming and low-frequency quasi-static components contribute significantly to the total horizontal and vertical wave forces. • For un-broken waves, both slamming and quasi-static force components increase with wave height. • For broken waves, the maximum slamming force components have a large variance, while the variance of the maximum quasi-static component is small. • The simulation and experiment measurements agree well. • The quasi-static and slamming components in horizontal and vertical directions both have strong correlation with wave height and clearance. Research Objectives and Goals Previous studies have revealed that both the vertical and horizontal wave forces contains two components: a high frequency impulsive slamming component, and a lower frequency quasi-static component. The object of this study is to investigate and quantify the influence of wave height and deck clearance (the distance between still water level and the bottom of the structure) to the wave forces in the horizontal and vertical directions due to solitary waves by conducting an experiment and numerical simulations. Figure 1. Damage to the U.S. 90 Biloxi Bay Bridge caused by Hurricane Katrina (Solomon Yim, Oregon State University) Experimental Setup A 1:5 concrete bridge deck model is designed and constructed, and installed in the OSU HWRL Large Wave Flume. Two horizontal and six vertical load cells are used to record the wave force time histories on the structure. Table 1. Description for test cases, letters "NB" indicates non-broken waves and "B" indicates broken waves Water level, h (m) Wave Height, H(m) Wave condition 2.00 0.36 NB 2.00 0.42 NB 2.00 0.55 NB 2.00 0.70 NB 2.00 0.90 B 2.00 1.00 B 2.00 1.20 B 2.00 1.40 B 1.90 0.46 NB 1.90 0.52 NB 1.90 0.65 NB 1.90 0.80 B 1.90 1.00 B 1.90 1.10 B 1.90 1.30 B Figure 2. Side view of the experiment model setting Figure 3. Snapshots of a solitary wave impact on the bridge deck model (HWRL, Oregon State University) Wave Force Time History Decomposition In order to study the two components of the horizontal and vertical wave forces separately, the high-frequency slamming component and the low- frequency quasi-static force component are extracted from the original measurement using a 10th ordered Daubechie Wavelet method. Figure 4. Wave force time histories decomposition using a wavelet transform method Figure 7. Computational domain of the numerical model Figure 6. Time histories of the total wave forces, quasi-static components and slamming components of the repeatability test in the vertical direction. Figure 5. Time histories of the total wave forces, quasi-static components and slamming components of the repeatability test in the horizontal direction. 0 1000 2000 3000 4000 5000 0.0 0.2 0.4 0.6 0.8 HorizontalQuasi-staticForce(N/m) Clearance (m) Fx_qs, H = 0.970 m Fx_qs, H = 0.680 m Fx_qs, H = 0517 m Fx_qs, H = 0.430 m 0 2000 4000 6000 8000 0 0.2 0.4 0.6 0.8 VerticalUpliftQuasi-staticForce (N/m) Clearance (m) Fz_qs, H = 0.970 m Fz_qs, H = 0.680 m Fz_qs, H = 0.517 m Fz_qs, H = 0.430 m 0 1000 2000 3000 4000 5000 0 0.2 0.4 0.6 0.8 HorizontalSlammingForce(N/m) Clearance (m) Fx_sl, H = 0.970 m Fx_sl, H = 0.680 m Fx_sl, H = 0.517 m Fx_sl, H = 0.430 m 0 2000 4000 6000 8000 0 0.2 0.4 0.6 0.8 VerticalUpiiftSlammigForce(N/m) Clearance (m) Fz_sl, H = 0.970 m Fz_sl, H = 0.680 m Fz_sl, H = 0.517 m Fz_sl, H = 0.430 m Figure 8. Comparison of time histories between experimental measures and numerical simulations of horizontal and vertical wave forces. Figure 9. Maximum of quasi-static and slamming components in the horizontal and vertical directions vs. the clearance.