Funding of New and existing stressed assets opportunities and challenges
May 2010 Cu Trends Report
1. Credit Union Trends Report
CUNA Mutual – Economics ● May 2010 (March 2010 data)
Highlights ENVIRONMENT
A year ago, I noted we were approaching a mid-year inflection point or the trough of
• Consolidation picked up in the the recession. While economic indicators over the past few months support a mid-
first quarter with a net loss of 76 2009 bottoming of economic activity (the end of the recession), the real question is:
CUs. At the end of March, how long will we remain near the bottom of the trough?
CUNA estimates show 7,755
Anecdotal surveys I’ve taken with CU leaders across the country indicate members
CUs, reflecting a net decline of
do not perceive a solid recovery is underway, and their actual savings and borrowing
274 institutions over the past patterns confirm this uncertainty. Actions by CU leaders show they agree with
year. We expect to lose roughly member perceptions. A very fragile recovery is likely underway, but downside risks
300 CUs in 2010. remain. We must all proceed with caution given the unrest in the global capital
markets, employment uncertainty, upcoming tax increases, and rising energy costs,
• Savings and asset growth just to name a few stumbling blocks.
continue to slow. Savings are _________________________________________________________________________
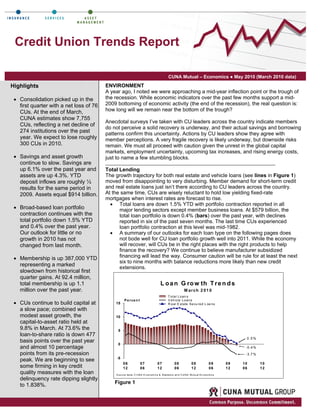
up 6.1% over the past year and Total Lending
assets are up 4.3%. YTD The growth trajectory for both real estate and vehicle loans (see lines in Figure 1)
deposit inflows are roughly ⅓ moved from disappointing to very disturbing. Member demand for short-term credit
results for the same period in and real estate loans just isn’t there according to CU leaders across the country.
2009. Assets equal $914 billion. At the same time, CUs are wisely reluctant to hold low yielding fixed-rate
mortgages when interest rates are forecast to rise.
• Total loans are down 1.5% YTD with portfolio contraction reported in all
• Broad-based loan portfolio major lending sectors except member business loans. At $579 billion, the
contraction continues with the total loan portfolio is down 0.4% (bars) over the past year, with declines
total portfolio down 1.5% YTD reported in six of the past seven months. The last time CUs experienced
and 0.4% over the past year. loan portfolio contraction at this level was mid-1982.
Our outlook for little or no • A summary of our outlooks for each loan type on the following pages does
growth in 2010 has not not bode well for CU loan portfolio growth well into 2011. While the economy
changed from last month. will recover, will CUs be in the right places with the right products to help
finance the recovery? We continue to believe manufacturer subsidized
• Membership is up 387,000 YTD financing will lead the way. Consumer caution will be rule for at least the next
six to nine months with balance reductions more likely than new credit
representing a marked
extensions.
slowdown from historical first
quarter gains. At 92.4 million,
total membership is up 1.1 L o a n G ro w th T r e n d s
million over the past year. M arch 2 01 0
T otal Loan s
P e r ce n t V e h icle L o a n s
• CUs continue to build capital at 15 R e a l E sta te Se cu re d L oa n s
a slow pace; combined with
modest asset growth, the 10
capital-to-asset ratio held at
9.8% in March. At 73.6% the 5
loan-to-share ratio is down 477
0 .5 %
basis points over the past year
0
and almost 10 percentage - 0.4 %
points from its pre-recession - 3.7 %
-5
peak. We are beginning to see
06 07 07 08 08 09 09 10 10
some firming in key credit 12 06 12 06 12 06 12 06 12
quality measures with the loan S ou rc e da ta: C U N A E c on om i c s & Statis tic s an d C U N A M utu al Ec ono m ic s
delinquency rate dipping slightly
Figure 1
to 1.838%.
2. Credit Union Consumer Installment Credit
Consumers remain cautious and continue to reduce short-term debt. The $2.4 trillion total consumer installment credit
(CIC) market is down 6.2% ($160 billion) from its December 2008 peak. Reduced consumer demand for new credit
and consumers choosing to payoff higher rate debt versus adding to low-yield savings are the primary factors driving
this trend. Higher credit standards and a sharp pullback in solicitations also factor into the decline.
• The CIC loan portfolio at CUs is down 3.4% YTD (seasonal payoffs and weak vehicle lending) and 1.8% over
the past year, as shown in Figure 2. While the contraction in CUs’ CIC portfolio is less than the rest of the
market, without the strong showing in credit cards (green line in Figure 2), CUs would have posted a 3.1%
reduction in CIC outstanding. The CU market share of CIC is 9.42%, up 15 basis points (bp) from March 2009.
• We are forecasting the CIC loan portfolio at CUs to post losses for most of 2010.
G r o w th in C o n s u m e r In s ta llm e n t C r e d it
P e r ce n t
20 M arch 2 01 0
C U G r o w th G ap = + 1 .7 p p
15
10
C r ed it C a r d s at
C U s 6.4 %
5
0
C re d it U n io n s
-1 .8 %
-5
T o ta l M a r k e t E x c l. C U s - 3 .5 %
- 10
06 07 07 08 08 09 09 10 10
12 06 12 06 12 06 12 06 12
S ou rc e da ta: C U N A E c on om i c s & Statis tic s an d C U N A M utu al Ec ono m ic s
Figure 2
Vehicle Loans
Recent results and the outlook for vehicle lending continue to deteriorate. Through the first three months of 2010,
vehicle loans held by CUs declined by 2.6%. Since the expiration of cash for clunkers, month-only declines have
averaged 0.8%. Over the past year, CU vehicle loans have declined 3.7%, as shown Figure 3 - left graphic. With
declines in each of the past seven months and annual growth negative since November 2009, this trend will not easily
be reversed. Vehicle loans now represent less than 30% of all CU loans, down from almost 38% in 2005.
• Some firming in new vehicle sales has not translated into CU loans. The right graphic in Figure 3 shows new
vehicle loans declining at an accelerating pace. The 5.6% YTD drop represents 45% of the total annual loss in
vehicle loans. The used vehicle loan portfolio continues to post positive annual growth results, but gains are
slowing as this portfolio declined in each of the past five months.
• Weak consumer demand coupled with aggressive subsidized financing by manufacturers implies poor CU
vehicle growth performance through at least 2010.
V e h ic le L e n d in g G r o w th C o m p a r is o n s
An nu a l G row th C U N e w v s . U s e d V e h ic le
P e rc e n t P e rc e n t
5 10
4 M a rc h 2 0 1 0
3 5
Us ed
2 2.9%
1 0
0
-1 -5
-2
-3 -1 0 N ew
-1 1 . 5 %
-4 -3 .7 %
-5 -1 5
06 12 07 12 08 12 09 12 10 12 06 12 07 12 08 12 09 12 10 12
S ou rc e da ta: C U N A E c on om i c s & Statis tic s an d C U N A M utu al Ec ono m ic s
Figure 3
2 ● Credit Union Trends Report
3. Real Estate-Secured Lending – 1st Mortgages and Other Real Estate
CUs from across the country report member demand for real estate secured (RE) loans has dropped sharply. It’s
more than just amortization driving portfolio growth trends as adjustable-rate 1st mortgages are down 1.3% YTD, 2nd
mortgages are off 3.5% and home equity loans down 0.5%. Despite a fractional YTD gain in fixed-rate 1st mortgages,
total RE loans outstanding are down 0.6% through the first quarter, as shown in Figure 4.
• Annual growth of 0.5% for total RE loans disguises the fact that this portfolio segment declined December
through February. The pending expiration (April 30 signed/accepted offer) of generous homebuyer tax
incentives likely propped up March results and will positively impact May and June data. This mini 1st mortgage
loan surge will be temporary as CUs will not want to hold long-term fixed-rate assets at near record low yields.
• After June, low interest rates and a post-incentive real estate sales slump could trigger outright contraction in
the RE loan portfolio.
• Real estate secured loans now represent 54.4% of all loans and 34.5% of total CU assets.
T o ta l C U R e a l E s t a te S e c u r e d L o a n s
Y e a r -t o - D a t e G r o w th C o m p a r is o n
M a rc h 2 0 1 0
P erce nt
14
12 1 1.4 %
10
8
6
4
2 1.5 %
0
-2 - 0.6 %
Jan Fe b M ar A pr M ay J un Ju l A ug S ep Oc t N ov Dec
2008 2 0 09 20 1 0
S ou rc e da ta: C U N A E c on om i c s & Statis tic s an d C U N A M utu al Ec ono m ic s
Figure 4
Surplus Funds (Cash + Investments)
With total loans down YTD and over the past year and deposit inflows positive over the same periods, surplus funds
reached a new record high at just under $303 billion. At their current level, surplus funds are up 6.5% ($18.6 billion)
YTD and 14.0% ($37.2 billion) above March 2009.
• Just over 33% of all CU assets are in surplus funds, a three percentage-point increase from this time last year.
Year-end 2009 NCUA summary data shows the yield on average investments just 127 bp above cost-of-funds.
When you consider the expenses associated with acquiring and maintaining deposits, plus assessments, this
positive spread barely adds to the bottom line.
• CUs appear to be extending maturities to pick up yield as the percent of surplus funds maturing in one year or
less fell to 51% versus 59% at this time last year. Since March 2009, estimates by CUNA show agencies
increased from 34% of surplus funds to almost 41%
• Surplus funds would be higher had CUs not reduced borrowings by 27% ($11.2 billion) over the past year.
Savings and Assets
Savings at CUs are up 2.2% YTD to $787 billion. Most would consider quarter-only growth of 2.2% as good, but when
you consider over the past four years 72% of all annual deposit growth occurred in the first quarter, we believe the
savings growth peak is behind us. The bars in Figure 5 showing annual savings growth reinforce this belief.
• Despite historically low deposit yields (share drafts=0.4%, regular shares=0.5%, and money market accounts=
0.9%) members continue to favor these highly liquid accounts. The right graphic in Figure 5 shows 129% of
savings gains since March 2009 are attributable to these accounts. CD balances are down 6.2% over the same
period.
• A fifth payroll Friday and tax refunds will temporarily boost April results, but savings and asset growth is slowing
in the CU marketplace.
• Total assets are up 1.1% YTD and 4.3% over the past year to $914 billion. Reduced borrowing is offsetting
deposit inflows.
3 ● Credit Union Trends Report
4. C r e d it U n io n S a vin g s & A s s e t G r o w th
M arc h 2 01 0
A n n u a l G r o w th (% ) Sh a re o f A n n u a l S a vin g s G ro w t h ( % )
12 80
Ass e ts
10 Sa vin g s 60
8 40
20
6
0
4
-20
2
-40
0 S hare R e gula r M MA s CDs IR A s
D rafts S ha re s
0 6 12 07 12 0 8 12 09 12 10 1 2
S ou rc e da ta: C U N A E c on om i c s & Statis tic s an d C U N A M utu al Ec ono m ic s
Figure 5
Capital and Other Key Measures
Since the accounting reversal of stabilization costs in June 2009, the CU system has added to its capital base in eight
of nine months. Currently, total CU capital stands at $89.8 billion, up 2.2% ($2.0 billion) since June and 0.3% YTD.
While these are positive signs, 2010 assessments will reduce gains.
• For the industry as a whole, the capital-to-asset (C/A) ratio finished March at 9.8%, as shown in Figure 6 - left
graphic. The current reading is well above required minimums, but individual CU results vary significantly.
• Deposits continue to flow in, but total loans are down both YTD and over the past year. These trends translated
into a 477 bp decline in the loan-to-share (L/S) ratio since March 2009. After its 83.4% peak at the beginning of
the recession, this key lending measure has fallen to 73.6%. Weak member loan demand and CUs selling low-
yield fixed-rate 1st mortgages are driving this trend. While we do not believe the L/S ratio will fall below 70.0%,
CUs need the additional spread income from lending to boost their bottom lines.
• The right graphic in Figure 6 shows the loan delinquency rate (loans two or more months delinquent as a
percent of total loans outstanding) dipped slightly in March. The current level of 1.838% is almost twice the
long-term average. Discussions with CU leaders throughout the country indicate some firming in credit quality
indicators. Barring any unforeseen economic and/or employment shocks, we believe the delinquency rate is
within 20 bp of its peak for this economic cycle.
C re d it U n io n
K e y R a t io s a n d D e lin q u e n c y T r e n d s
M arc h 20 10
K e y R a tio s L o a n D e lin q u e n cy R a t e
-1 .8 3 8%
L /S = 73 .6 % C/A = 9.8%
P erce n t Pe r cen t
90 1 2 .0
L o a n - t o - S h a re Pe r cen t
( Le ft S c a le) 2 .0%
85 1 1 .5
80 1 1 .0 1 .5% 1 0 Y ea r Av e rag e
0. 93 7%
75 1 0 .5
7 3 .6 %
1 .0%
70 1 0 .0
9 .8 %
0 .5%
65 C a p i t al -t o - A s s et 9 .5
( R ig h t S c a le)
60 9 .0 0 .0%
06 07 07 08 08 09 09 10 10 06 07 07 08 08 09 09 10 10
12 06 12 06 12 06 12 06 12 12 06 12 06 12 06 12 06 12
S ou rc e da ta: C U N A E c on om i c s & Statis tic s an d C U N A M utu al Ec ono m ic s
Figure 6
4 ● Credit Union Trends Report
5. Credit Unions and Members
Initial estimates by CUNA Economics and Statistics show a net loss of 76 CUs during the first quarter of 2010. At the
end of March, the CU count is 7,755. YTD consolidation trends are slightly elevated from recent results (four-year
average net decline for Q1 = 62 CUs), as shown by the left bars in Figure 7. NCUA reports indicate four CUs were
closed YTD versus just one for the same period in 2009. Note: three additional CUs were closed by the NCUA from
March 31 to May 1.
• When compared to full-year results for the period 2006-2009, the current year-over-year net decline is 36 CUs
below the four-year average (right bars in Figure 7).
• Despite the first quarter up-tick, we continue to forecast near-term annual consolidation below its 10-year
average. While the nation’s CU leaders haven’t stopped exploring strategic merger opportunities, their primary
focus is a stronger bottom line and rebuilding the capital ratio.
• Beyond 2011, we see merger activity accelerating but driven by retirements at smaller CUs. Our forecast
assumes no major system shocks and no significant changes to the underlying value of a CU charter. In the
current environment, both assumptions are fragile at best.
C o m p a r is o n o f D e c lin e s in N u m b e r o f C U s
Number of C Us A n n u a l D e c lin e s
4 00 M a rc h t o M a r ch
33 1 3 29
310
3 00 2 70 274
2 00
1 00 77 76
53 57 59
0
06 07 08 09 10 06 07 08 09 10
Y T D M a rc h D e c li ne s A n n u a l D e c lin e s
S ou rc e da ta: C U N A E c on om i c s & Statis tic s an d C U N A M utu al Ec ono m ic s
Figure 7
At the end of March, CUNA estimates show 92.4 million CU members. This reflects a net increase of 1.1 million
members over the past year, as shown in Figure 8. On a YTD basis, membership increased 387,000. This is 240,000
(38%) below the average of the past four years.
• Our current forecast calls for a net gain of 1.0 million members in 2010 and gains to average just under 1.0
million through 2015. This represents a modest slowdown from the 1.1 million average annual gain generated
over the past four years. Growth in CU membership as a percent of the population has slowed and is forecast to
hover around 30%. Competition and saturation are driving this assumption.
• The largest gains will continue to be concentrated in the CUs that provide the widest array of products, services,
and access channel choices for members.
A n n u a l N e t G a in in T o ta l C U M e m b e r s h ip
M a r c h 2 0 1 0 = 9 2 .4 M illio n
M illio n s o f M e m b e rs
2 .5
2.2
2 .0 1.9
1.8
1 .5
1 .5 1.4
1.3
1.2 1 .2
1.1 1.1
1.0
1 .0
0 .5
0 .0
00 01 02 03 04 05 06 07 08 09 10
Mar
S ou rc e da ta: C U N A E c on om i c s & Statis tic s an d C U N A M utu al Ec ono m ic s
Figure 8
5 ● Credit Union Trends Report