The influence of corporate governance and capital structure on risk, financial performance and firm value
•
1 recomendación•752 vistas

International peer-reviewed academic journals call for papers, http://www.iiste.org

Recomendados
Recomendados
Más contenido relacionado
La actualidad más candente
La actualidad más candente (20)
Destacado
Destacado (20)
Similar a The influence of corporate governance and capital structure on risk, financial performance and firm value
Similar a The influence of corporate governance and capital structure on risk, financial performance and firm value (20)
Más de Alexander Decker
Más de Alexander Decker (20)
Último
Último (20)
The influence of corporate governance and capital structure on risk, financial performance and firm value
- 1. European Journal of Business and Management ISSN 2222-1905 (Paper) ISSN 2222-2839 (Online) Vol.5, No.29, 2013 www.iiste.org The Influence of Corporate Governance and Capital Structure on Risk, Financial Performance and Firm Value: A Study on the Mining Company Listed in Indonesia Stock Exchange in 20092012 Tri Wahyu Adi,1* Suhadak,2 Siti Ragil Handayani,2 Sri Mangesti Rahayu2 1 2 Student of Doctoral Program of Business Administration, Faculty of Administrative Science, University of Brawijaya, Jalan M.T. Haryono No. 163 Malang, East Java – Indonesia, Postal Code 65145 Department of Business Administration, Faculty of Administrative Science, University of Brawijaya, Jalan M.T. Haryono No. 163 Malang, East Java – Indonesia, Postal Code 65145 * Email of corresponding author: triwahyuadi@yahoo.com Abstract: The unit of analysis in this study is mining companies listed in the Indonesia Stock Exchange. This unit data is represented by the audited company's financial statements and historical data of stock prices in Indonesia Stock Exchange. Financial statement data and historical data of the company's stock price used are from the year of 2009 to 2012. Companies sampled in the study only companies which meet the sampling criteria as many as 23 companies. We find corporate governance has no Influence on the risk. The better corporate governance will improve financial performance. The better corporate governance will increase the firm value. The higher risk will lower the financial performance, while capital structure has no influence on the risk. Capital structure has negative Influences to financial performance. Capital structure affect negatively to firm value. The better financial performance will improve the firm value. Keywords: corporate governance, capital structure, risk, financial performance, firm value 1. Introduction Mining is a risky business; business that requires large capital, and provides long-term returns then it requires specialized knowledge, experience and contains significant obstacles and barriers that must be overcome. (Adaro Energy, 2009). Mining effort required to move a very large cost, therefore the managers of mining companies are facing the selection of appropriate financing strategies for capital budgeting. The company in the preparation of capital budgeting will observe corporate governance, risk, capital structure, financial performance and firm value. Mining business is highly risky that the investor also requires good corporate governance in order to manage the risk to be as minimal as possible so that the investments can be safely implanted and provide maximum yield. Mining companies listed in the Indonesian Stock Exchange must be running on good corporate governance principles of transparency, accountability, responsibility, independence, fairness and equality. To support the principles of good corporate governance goes well, the mining company must formed a committee consisting of the audit committee, risk management committee, nomination committee, and remuneration committee. Besides, mining companies that already implement good corporate governance also have basic guideline for the implementation of the company's values, business ethics, and code of conduct. Previous studies related to the influence of corporate governance and capital structure of the risk, financial performance and firm value give some inconsistent results and therefore they are inconclusive. Agency theory tells us that within the company there is a conflict between the manager and the employer to the need for oversight of the company's management in order to work for the benefit of owners of the company, thus the agency costs appears to reduce the risk of loss. Asymmetry theory argues that the parties relating to the company does not have the same information to condition of the company. The company is considered having information about the company's prospects and risks much better than the company owner or investor do. In most important business decisions, there are two key financial considerations: risk and return. Each financial decision presents certain risk and return characteristics, and the combination of these characteristics can increase or decrease a firm’s share price. Analysts use different methods to quantify risk, depending on whether they are looking at a single asset or a portfolio, a collection, or group of assets (Gitman and Zutter, 2012). According to 200
- 2. European Journal of Business and Management ISSN 2222-1905 (Paper) ISSN 2222-2839 (Online) Vol.5, No.29, 2013 www.iiste.org Weisbach (1988) more outside directors to protect shareholder interests through Influence decision control, while audit committee according to Klein (2006) will reduce the likelihood of earnings management that will further increase transparency. Reddy et al. (2010) in his research found the firm level risk is negatively related to insider ownership, firm level risk is positively associated with block holding, firm risk is positively related to the level of non-executive directors and firm level risk is positively related to board size. Francis and Armstrong (2003) investigated the relationship of ethics to risk management, argues that there are compelling reasons to consider good ethical practice to be an essential part of such risk management. Mak and Kusnadi (2005) examined the impact of corporate mechanisms governance in Malaysia and Singapore, found that a small board that is positively related to firm performance is high, while Liang and Li (1999) examined the relationship between board structure with firm performance in China. The results of research found a negative correlation between board size with firm performance. John and Senbet (1998) examined the Influence of the internal mechanisms and external mechanisms of corporate governance, particularly the control of the company by the market. They argue that corporate governance will be more independent if the board has more nonexecutive directors. But some other researchers such as Hermalin and Weisbach (1991) found no significant relationship between the proportions of non-executive directors with firm performance. Klein (2006) examined whether the audit committee and board characteristic associated with earnings management and report resulted that earnings management is negatively related to audit committee independence, but Anderson, Mansi and Reeb (2004) investigated the influence of board of directors characteristics on the integrity of financial accounting report found that companies with audit committees have lower independent debt-financing costs. Demsetz and Villalonga (2001) examined the relationship between ownership structure and firm performance in the U.S. The results found no statistically significant relationship between ownership structure and firm performance. Statistically, managerial shareholding weakly correlated to firm value as measured by Tobin's Q. Coleman (2007) while Institutional shareholding increase firm value. Empirical evidence on the relationship between capital structures which affect firm performance results are diverse so that it indicates a positive relationship and others find a negative relationship of no association or even weak. According to the pecking order theory, debt negatively affects financial performance and firm value, the higher level of debt of a company has then the higher risk of the company. Companies that have the ability to generate high profits generally have low debt levels, thus it will have a lower risk. Meanwhile, according to MM theory, capital structure does not affect firm value, which to affects firm value is the level of profits and business risks. MM theory further said that value of the company with debts is higher than that of the company without debt. Lev (1974), n the firm level, it can be expected that large capital expenditures associated with an operating leverage increase will increase stock riskiness. The use of the current cost of capital as the cut-off rate would probably result in a decrease in stock prices, adversely affecting stockholders' wealth. Taub (1975), examined to ascertain the factors that influence the selection of companies in the debt to equity ratio in the United States. He found the coefficient of the variable measuring the difference between the return to the firm and the long term rate of interest was consistently positive. Thus, increases in this variable would increase the probability of debt IDX issued, implying a positive impact on the firms desired debt-equity ratio. Another study found a negative relationship between the level of leverage and firm performance is from Fama and French (2002) and Simerly and Li (2000). Demsetz and Villalonga (2001) in his research found that financial performance which is measured using the profit rate is significantly related to firm value as measured by Tobin's Q. This is consistent with the study of Chung et al. (2003) who found that Tobin's Q ratio (firm value) significantly has positive correlation with profitability (financial performance) and negatively associated with risk. Study of Demsetz and Villalonga (2001) and Chung et al. (2003) confirmed the MM Theory statement that the level of profits and business risks affects the firm value. Results of previous studies on the influence of corporate governance, capital structure of the risk, financial performance, and firm value have motivated researchers to reexamine the argument that corporate governance and capital structure affect risk, financial performance, and firm value. 2. Literature Review 2.1. Corporate Governance Agency Theory, Jansen and Meckling (1976), define an agency relationship as a contract under which one or more persons (the principal(s)) engage another person (the agent) to perform some service on their behalf which 201
- 3. European Journal of Business and Management ISSN 2222-1905 (Paper) ISSN 2222-2839 (Online) Vol.5, No.29, 2013 www.iiste.org involves delegating some decision making authority to the agent. If both parties to the relationship are of maximum utility, there is good reason to believe that the agent will not always act in the best interests of the principal. The principal can limit divergences from his interest by establishing appropriate incentives for the agent and by incurring monitoring costs design to limit the aberrant activities of the agent. In addition, in some situations it will pay the agent to expend resources (bonding costs) to guarantee that he will not take certain actions which would harm the principal or to ensure that the principal will be compensated if he does take such actions. Corporate governance principles developed by the OECD consists of the rights of shareholders, the equitable treatment of shareholders, the role of stake holders, disclosure and transparency, and the responsibilities of the boards. 2.2. Risk According to Brealey et al., 2011 “High debt, and thus high financial risk, also appear to reduce firms’ appetites for business risk”, This means that there is a relationship between capital structure and the influence risk. Further Brealey et al., (2011) stated that Market risk (systematic risk) cannot be diversified away. Hoyt and Liebenberg (2011) in his research found that the company risk management has a positive relationship with firm value. Brigham and Daves, 2007, Market risk, on the other hand, stems from factors that systematically affect most firms: war, inflation, recessions, and high interest rates. Since most stocks are negatively affected by these factors, market risk cannot be eliminated by diversification. Market risk in this study was calculated using a measured beta that has the symbol β, referring to the formula in Beaver et al. (1970). 2.3. Capital Structure Tahir and Razali, 2011, In the real business, it is believed that most companies use debt to finance operations. The sources to finance operations can be created via options, futures or other financial instruments. By borrowing, a company actually increases its leverage because the company grabs the opportunity to invest business operations without increasing its equity. As a result, it creates an opportunity for company to create value for its stakeholders if it is able to generate profits. Modigliani and Miller, 1963, using debt financing will obtain tax advantages but it does not mean that the companies should always try to use the maximum possible amount of debt in their capital structure. Furthermore, Modigliani and Miller (1958) stated that the capital structure does not affect firm value. 2.4. Pecking-order theory Brealey et al., 2011, Asymmetric information affects the choice between internal and external financing and between new issues of debt and equity securities. This leads to a pecking order, in which investment is financed first with internal funds, reinvested earnings primarily; then by new issues of debt; and finally with new issues of equity. New equity issues are the last resort when the company runs out of debt capacity, that is, when the threat of costs of financial distress brings regular insomnia to existing creditors and to the financial manager. 2.5. Modigliani and Miller theory, Gitman and Zutter, 2012, in 1958, Franco Modigliani and Merton H. Miller (commonly known as “M and M”) demonstrated algebraically that assuming perfect markets. The capital structure that a firm chooses does not affect its value. Many researchers, including M and M, have examined the Influences of less restrictive assumptions on the relationship between capital structure and the firm’s value. The result is a theoretical optimal capital structure based on balancing the benefits and costs of debt financing. The major benefit of debt financing is the tax shield, which allows interest payments to be deducted in calculating taxable income. The cost of debt financing results from (1) the increased probability of bankruptcy caused by debt obligations, (2) the agency costs of the lender’s constraining the firm’s actions, and (3) the costs associated with managers having more information about the firm’s prospects than investors do. Allowing firms to deduct interest payments on debt when calculating taxable income reduces the amount of the firm’s earnings paid in taxes, thereby making more earnings available for bondholders and stockholders. The deductibility of interest means the cost of debt to the firm is subsidized by the government. 3. Hypothesis 3.1. Influence of corporate governance on risk Francis and Armstrong (2003) investigated the relationship of ethics to risk management. They argue that there are compelling reasons to practice good ethics as an important part of risk management. Prasetyo (2011) said that there is a strong impact between corporate governance and systematic risk. This means that in the long term, 202
- 4. European Journal of Business and Management ISSN 2222-1905 (Paper) ISSN 2222-2839 (Online) Vol.5, No.29, 2013 www.iiste.org the company with the correct application of corporate governance can minimize the risk. Reddy et al. (2010) in his research found that the firm's risk level is negatively related to insider ownership, firm risk level is positively related to block holding. Firm risk is positively related to the level of non-executive directors and firm level risk is positively related to board size. H1: Corporate governance has Influence on risk. 3.2. Influence of corporate governance on financial performance and firm value It is widely recognized that corporate governance increases firm performance. Although the generally accepted notion tells that Influence corporate governance increases firm performance, other studies have reported a negative relationship between corporate governance and firm performance (Bathala and Rao, 1995; Hutchinson, 2002). Researchers predict that corporate governance will improve the financial performance and firm value. H2: Corporate governance has Influence on financial performance. H3: Corporate governance has Influence on firm value. 3.3. Influence of risk on financial performance Hoyt and Libenberg (2011) found a positive relationship between firm value and the use of ERM for various specifications of the model that influences the alternative treatments. ERM is both statistically and economically significant. Chung et al. (2003) found that Tobin's Q ratio (firm value) have significance in showing positive association with profitability (financial performance) and negatively related to risk. H4: Risk have effect on financial performance. 3.4. Influence of capital structure on risk Brigham and Houston (2010) that capital structure involves the existence of a trade-off between risk and return: 1) Using a debt in larger quantities would increase the risk borne by shareholders. 2) However, using more debt will generally increase the estimated return on equity. Divergent views presented by Fama and French (1997). High leverage, as well as increased leverage and debt, is bad news to the company's value. At high levels of leverage, agency problems between stockholder- bondholders may appear on risky debt. H5: Capital structure has Influence on risk. 3.5. Influence of capital structure on financial performance and firm value Taub (1975) variable coefficient which measures the difference between the return of the company, consistently give positive influence with long-term interest rates. This means that an increase in return the company will increase the likelihood of debt issuance. This implies a positive impact on the company's debt to equity ratio desired. Different opinions expressed by Fama and French (2002) that a profitable company that has a smaller leverage and investment company that has a lot of leverage to have a smaller market. Fama and French (1997) support the opinion of Jensen and Meckling (1976) and Myers (1977), which predicts a negative relationship between leverage with profitability. H6: Capital structure has Influence on financial performance. H7: Capital structure has Influence on firm value. 3.6. Influence of financial performance on firm value Demsetz and Villalonga (2001) in his research found that financial performance which is measured using the profit rate is significantly related to firm value. As measured by Tobin's Q, this is consistent with the study of Chung et al. (2003) who found that Tobin's Q ratio (firm value) has significant positive correlation with profitability (financial performance) and negatively associated with risk. Study of Demsetz and Villalonga 203
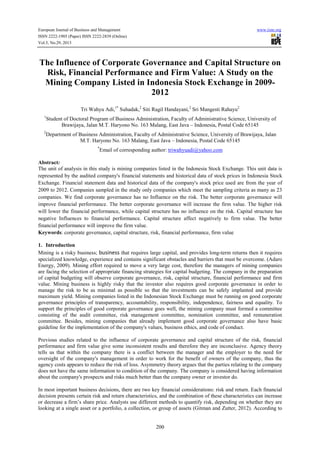
- 5. European Journal of Business and Management ISSN 2222-1905 (Paper) ISSN 2222-2839 (Online) Vol.5, No.29, 2013 www.iiste.org (2001) and Chung et al. (2003) confirm that the MM Theory which states that affect firm value is the level of profits and business risks. H8: Financial performance has influence on firm value. < Figure 1 is about here > 4. Data and Methodology 4.1. Instrument Test Research is the kind of explanatory research that describes the influence of the variable X to Y through hypothesis testing. The unit of analysis in this study is mining companies that are listed in the Indonesia Stock Exchange. The data is represented by the company's financial statements that have been audited and historical data of stock prices in Indonesia Stock Exchange. Financial statement data and historical data of the company's stock price used is from the year of 2009 to 2012. The population was companies listed mining in Indonesia Stock Exchange the period 2009 - 2012 amounted to 36 companies. The companies that are IDX sampled in this study were selected based on certain criteria (purposive sampling), as below: 1. Mining companies are already implementing good corporate governance. 2. Mining companies have issued financial statements for the period ended December 31, during the period of 2009-2012 and have been contained in the Indonesian Capital Market Directory (ICMD), Indonesia Stock Exchange website and the website of the company. 3. In accordance with Article 3 of the Articles of Association years of 2009-2012, the Company must engage in mining activity or support to mining activity. Companies sampled in the study only companies that meet the sampling criteria as above as many as 23 companies. 4.2. Exogenous variable and operational variable definition 1. Corporate Governance (X1) can be interpreted as a set of rules that govern the system and control of the company to create value for stakeholders, Corporate Governance in this study was measured using the following indicators: (1) Proportion of Non-Executive Director (X1.1) is the proportion of the number of Non-Executive Director (directors who are not affiliated) that sits on the Board of Directors. (2) Managerial Ownership (X1.2) is the proportion of shares held by members of the Board of Directors and Board of Commissioner to the total number of existing shares. (3) Proportion of Independent Commissioners (X1.3) is the proportion of Independent Commissioners who sit on the Board of Commissioners. (4) Proportion of Independent Audit Committee (X1.4) is the proportion number of Independent Commissioner in the Audit Committee. Klein (2006), to determine independence, one of three definitions are used is to define audit or board independence as the percentage of outside directors on the audit committee or on the board. (5) Institutional Ownership (X1.5) is the proportion of shares held by institutional to the total number of existing shares. These indicators are used as a proxy for corporate governance in influencing financial performance and firm value that referring to research of Coleman (2007), Reddy et al., (2010), while the indicator is used as a proxy for corporate governance in affecting market risk refers to the study of Reddy et al., (2010). 2. Capital Structure (X2), capital structure is the mix of debt, preferred stock and common stock used to finance capital of the firm to achieve maximum value. Capital structure in this study was measured using the following indicators: (1) Debt Ratio (X2.1) is the size (proportion) of the total use of debt to finance all investment firms. (2) Debt to Equity Ratio (X2.2) is the ratio of debt to equity. 204
- 6. European Journal of Business and Management ISSN 2222-1905 (Paper) ISSN 2222-2839 (Online) Vol.5, No.29, 2013 www.iiste.org These indicators are used as a proxy for Capital Structure in affecting firm performance and firm value which refers to research of Zeitun and Tian (2007) and Ebaid (2009), as well as the capital structure affects risk referring to research of Prasad (2010). 4.3. Endogenous variable and operational variable definition 1. Risk (Y1), the emphasis definition of risk in this study is more on the technical risk - capital budgeting techniques as defined by Keown et al., (2010), namely the risk as variability that may occur regarding the expected revenue stream. The risk in this research is measured using the following indicators: (1) Market Risk (Y1.1) is part of the risk of an Influence that cannot be eliminated by diversification. (Brigham and Houston, 2010). Market risk in this study was calculated using a measured beta that has the symbol β refers to Beaver, (1970). Market Risk is used as a proxy for risk estimation of measurement that refers to the study of Reddy et al. (2010). 2. Financial Performance (Y2) measured by using an indicator as follows: (1) Return on Investment (Y2.1) is earnings before financial expenses divided by the total funds (debt and equity) invested in the business. ROI as a measure of performance, used to evaluate the efficiency of an investment or to compare the efficiency of a number of different investments. ROI is used as a proxy measurement firm performance based on research from Jacobson (1987). (2) Return on Equity (Y2.2) is one of the ratio profitability to measures the firm in generate profit by using total equity existing and after expenses capital ejected from analysis. ROE used as proxy measurement firm performance of referring to the research of Coleman (2007); Zeitun and Tian (2007); Ebaid (2009). (3) Net Profit Margin (Y2.3) is percentage of net profit of income. NPM used as proxy the measurement of firm the performance of referred to research from Zeitun and Tian (2007). 3. Firm Value (Y3) measured by using an indicator as follows: (1) Tobin’s Q (Y3.1) is the market value of the assets of the company divided by the cost of substitution (Ross et al. 2008). Tobin’s Q is used as a proxy measurement of market based firm value that refers to the research of Coleman (2007); Zeitun and Tian (2007); Ebaid (2009); Reddy et al., (2010). Calculation of Tobin’s Q refers to the formulation of Chung and Pruitt (1994). (2) Price-Earnings Ratio (Y3.2) is measured appraisement equity defined as the market price of a stock divided by its earnings annual per share. It can be simplified as the ratio of the total market value of capital income referred to research from Kravchenko and Yusupova (2005) Zeitun and Tian (2007). (3) Closing Price (Y3.3) is the closing stock price on the day of a certain period or on the stock exchange. Closing Price as an indicator of firm value refers to the research of Patell (1976). 4.4. Inferential Statistical Analysis Inferential statistical analysis is an analysis that focuses on the areas of analysis and interpretation of data in order to draw conclusions. In this study there are two endogenous variables (financial performance and firm value) as well as eight exogenous variables ie Proportion of Non-Executive Director (X1.1), Managerial Ownership (X1.2), Proportion of Independent Commissioners (X1.3), Proportion of Independent Audit Committee (X1.4), Institutional Ownership (X1.5), Debt Ratio (X2.1), Debt to Equity Ratio (X2.2). Inferential statistical method is used to analyze the variance in this study-based or component-based with Partial Least Square (PLS). Analysis of Partial Least Square (PLS) is a multivariate statistical technique that performs multiple comparisons between the dependent variable and multiple independent variables. PLS is one of the SEM-based statistical method is designed to solve a variant of multiple regression when there is a specific problem in the data, such as small sample size, the missing data (missing values) and multi co-linearity (Jogiyanto, 2009). 5. Result of Research 5.1. The Description of Variable Variable description in this research study is minimum value, maximum and average for each variable. As variables described are: Corporate Governance (X1), Capital Structure (X2), Risk (Y1), Financial Performance (Y2), and Firm Value (Y3). 205
- 7. European Journal of Business and Management ISSN 2222-1905 (Paper) ISSN 2222-2839 (Online) Vol.5, No.29, 2013 www.iiste.org 5.1.1 Description of Corporate Governance (X1) variable Corporate Governance variables in this study measured based on five indicators: Proportion of Non-Executive Director (X1.1), Managerial Ownership (X1.2), Proportion of Independent Commissioners (X1.3), Proportion of Independent Audit Committee (X1.4), and Institutional Ownership (X1.5). Descriptive analyses of the results for the variables are presented in Table 1. < Table 1 is about here > Based on the table 1. Then indicators of a variable of corporate governance (X1) can be interpreted as follows, the average proportion of non-executive director existing in the board of directors is 6.1 %, the amount of the number of such proportion relatively small and describe that the company has not been a lot of employing nonexecutive director who dwells in the board of directors. The average managerial ownership (X1.2) or the proportion of the number of shares owned by the members of board of director, board of commissioner, and to the total number of shares the company is 6.16 %. The amount of the number of such proportion is relatively small. The average Proportion of Independent Commissioners (X1.3) in the Board of Commissioner is 38.33%, in accordance with the Law Number 40 Year 2007 on limited liability companies Article 120, paragraph 1 States that the articles of Association of the company can set up any one (1) or more independent Commissioner and one (1) person the Commissioner Delegates. Whereas according to the decision of the Board of Directors of PT Jakarta Stock Exchange number: Kep-305/BEJ/07-2004 Independent Commissioner of the Company must have at least 30% (thirty-per hundred) from the ranks of members of the Board of Commissioners. Thus the average Proportion of Independent Commissioners in the Board of Commissioner is fulfilling the provisions of the Law Number 40 year 2007 and the decision of the Board of Directors of PT Jakarta Stock Exchange number: Kep305/BEJ/07-2004. The average proportion of independent audit committee (X1.4) is 34.07 %, according to Anderson et al. (2004); companies that had an independent audit committee have the lower cost of financing debt. Meanwhile, according to the wild (1994) the market reacts well against profit after the formation of an audit committee. Klein (2006) found that a single negative correlation is not linear between an audit committee of independence with the earning management. Further, Klein suggesting that board composed of more independent of CEO influence more in the process of monitoring corporate finance accounting. The average institutional ownership (X1.5) or the proportion of the number of shares owned by institutional to the total number of shares of the company is 58.76%. This demonstrates that most of its stock owned by mining company in Indonesia institutions. 5.1.2 Description of Capital Structure (X2) Variable In this research, Capital Structure (X2) variable is measured by two indicators, namely: Debt Ratio (X2.1) and Debt to Equity Ratio (X2.2) as shown in Table 2. < Table 2 is about here > Referring to Table 2, obtained information that the average Debt Ratio mining company listed in the IDX was 51.09%. The percentage figures are 51.09% of investment showed that mining company financed using debt. Referring to Table 5.3., obtained information that the average Debt-to-Equity Ratio recorded by mining company in IDX 2.6017. If the numbers of the Debt to Equity Ratio was 1, this mean that venture capital and debt are the same, thus the average Debt-to-Equity Ratio of 2.6017 shows that the average debt of a mining company listed in the IDX is bigger 2.6 times compared to capital owned. 5.1.3 Description of Risk (Y1) and Financial Performance (Y2) Variables Risk (Y1) variable is only measured with a one indicator, namely Market Risk (Y1.1). In order to be efficient, this analysis of descriptive variable will be combined with Financial Performance (Y2). Financial Performance (Y2) variable is measured on 3 indicators namely: Return on Investment (Y2.1), Return on Equity (Y2.2), and Net Profit Margin (Y2.3) as can be seen in Table 3. < Table 3 is about here > 206
- 8. European Journal of Business and Management ISSN 2222-1905 (Paper) ISSN 2222-2839 (Online) Vol.5, No.29, 2013 www.iiste.org Referring to table 3. obtained information that the average of Market Risk (Y1.1) in mining company recorded by IDX is 0.8123. According to Jogiyanto (2011), if value betas of portfolio securities are equal to one, then it means that transforming return of x % market will cause return of securities or that of a changeable also portfolio of x %. If the value of betas equal to zero, that means transforming return of x % market will not cause to return or portfolio securities were changeable. The bigger numbers betas of a corporation stock, the higher are the levels of risks. Referring to table 5.3. obtained information that the average of Return on Investment (Y2.1) in mining company recorded by IDX is 0.0865. This means that the average investment in mining company recorded by IDX will give a profit of 8.65 % per year. The bigger numbers ROI will be even better. Referring to Table 3. obtained information that the average of Return on Equity (Y2.2) in mining company recorded by IDX is 0.1345. In accounting this means that the average of any rupiah in equity mining company recorded by IDX will yield a profit of 1.45 % per year. The bigger numbers ROE will be even better. Referring to Table 3. obtained information that the average Net Profit Margin (Y 2) in mining company listed in the IDX were-accounting basis. This 0.9179 means that on average, each sale by a mining company listed in the IDX will result in a loss of-91.79% per year. Figures for Net Profit Margin were negative. It's common for new mining companies or new project investment because in the income statement, the company's costs must be included as income of the company or the investment of the new project does not exist or it has not been maximized. The larger the number the Net Profit Margin will be even better. 5.1.4 Description of Firm Value (Y3) variable Firm Value (Y3) variable in this research will be measured by 3 indicators: Tobin’s Q (Y3.1), Price-Earnings Ratio (Y3.2), and Closing Price (Y3.3) as described in Table 4. < Table 4 is about here > Referring to Table 4. Obtained information that the average of Tobin’s Q (Y3.1) of mining company listed in the IDX was 1.4996, according to James Tobin (1969) in the Ang and Beck (2000), when numbers of Tobin’s Q > 1 then the investment can be made. Referring to Table 4. obtained information that the average Price-Earnings Ratio (Y3.2) of mining company listed in the IDX was 0.1647. The value of the average Price-Earnings Ratio of 0.1647 means that the average shares of mining company listed in the JSX sold for 0.1647 times to its profits .The average Price-Earnings Ratio of companies listed at the IDX mines can be caused by a decline in the stock price trend of mining company listed in the IDX. Referring to the table 4. obtained information that the value of the average of Closing Price (Y3.3) of mining company recorded by IDX is Rp. 4,814.04, while the average composite index (JKSE) a period 2009-2012 rp3,468.07. This could be meant that the average Closing Price (Y3.3) of mining company recorded by IDX having the better prospect above average listed company in IDX. The assumption in the PLS analysis is that the relationship between variables is linear, so-called assuming linearity. Test on this assumption is done with the approach of curve fit; where assuming linearity has been met if a model linear significant or whole model used as the basis of the testing insignificant. The assumption is drawn in Table 5. Table 5 shows that all the relations between variables is linear, thus the assumption of linearity has been fulfilled. < Table 5 is about here > 5.2. Outer Model Evaluation Examination of an indicator for each variable is based on the outer weight value to a formative indicator model (capital structure, risk, financial performance, and firm value) and the outer loading to a reflective indicator model (corporate governance). The value of (score factor / components) any indicators would be easy to be interpreted if outer weight / loading have similar mark (in this case +). On the other hand, an indicator said to be valid (converging) if it is significant (see Table 6). < Table 6 is about here > 207
- 9. European Journal of Business and Management ISSN 2222-1905 (Paper) ISSN 2222-2839 (Online) Vol.5, No.29, 2013 www.iiste.org Considering an indicator of Managerial Ownership (X1.2) and proportion of Independent Commissioners (X1.3) are having negative value of outer loading, then these indicators are issued in measuring Corporate Governance (X1) variable. It will be measured again without involving indicator and the results are presented in Table 7. < Table 7 is about here > Based on the table, can be known that the institutional ownership (X1.5) having outer loading largest, so that is an indicator of the most powerful as a measuring variable corporate governance (X1). Outer weight for variables risk (Y1) is worth 1 because this variable is just measured based on a single indicator (see Table 8). < Table 8 is about here > Debt to Equity Ratio (X2.2) indicator has negative value of outer loading. That indicator is issued as a measuring Capital Structure (X2) variable. An indicator of Return on Equity (Y2.2) and Net Profit Margin (Y2.3) have negative value of outer loading, and then those indicators are issued as measuring variable. Financial Performance (Y2) and Price-Earnings Ratio (Y3.2) indicator have negative values of outer loading, and then those indicators are issued as measuring Firm Value (Y3) variable. After removing these above indicators, then the measurement is carried out and obtained the following results: outer weight for Risk (Y1), Capital Structure (X2) and the Financial Performance (Y2), is equal to 1 because this variable is just measured based on a single indicator (for details, please refer to Table 9). < Table 9 is about here > 5.3. Goodness of Fit Inner Model Goodness of fit models in the PLS analysis is Q2 and it is calculated from the values of R-square. It has a value range of 0 < Q2 < 1. R-square is based on the coefficient of determination of the endogenous variables, as presented in Table 10. < Table 10 is about here > According to Table 10, Q2 can be calculated as follows: Q2 = 1 – (1 – 0,098)(1 – 0,234)(1 – 0,007) = 0.31389 Thus, it may say that the model can explain the phenomena which are reviewed by 31.39 %. 5.4. The Result of Hypothesis Testing Hypothesis Testing on PLS done with t-test and in a concise manner served in Table 11. < Table 11 is about here > The results of the hypotheses testing are also shown in a form of a diagram as can be seen in Figure 2. < Figure 2 is about here > Based on Table 11 and Figure 2, the results of research hypothesis testing can be described as the following explanation. 5.4.1 The Influence of Corporate Governance on Risk Test on hypotheses 1 indicates that corporate governance affects the risk, PLS analysis produces a path coefficient as much as 0,007 and p = 0,813. So, it is said to be insignificant. This means that corporate governance does not affect the risk in mining company in Indonesian IDX, which are listed in thus hypothesis was denied, 1. In other words, the practice of corporate governance also does not affect the risk of the company. In this research, risk proxies use market risk. This finding is not consistent with the results of research by Francis 208
- 10. European Journal of Business and Management ISSN 2222-1905 (Paper) ISSN 2222-2839 (Online) Vol.5, No.29, 2013 www.iiste.org and Armstrong (2003) which discovered that the practice of ethics was also an important part of risk management, and research by Prasetyo (2011) that there was the forceful impact between corporate governance and systematic risk. Other researcher, Reddy et al., (2010) reported his innovation that the firm level of risk associated with insiders ownership. The Firm level of risk has positive relationship with block holding, nonexecutive / independent directors and board size. 5.4.2 The Influence of Corporate Governance on Financial Performance and Firm Value Test on hypotheses 2 indicates that corporate governance affects the financial performance of corporations. PLS analysis produces a path coefficient as much as 0,154 and p = 0.0001 which is said to be significant. Considering a coefficient the lane marked positive, then can be meant that better corporate governance will improve financial performance of Indonesian mining company listed in IDX. Thus, hypothesis 2 is accepted. Test on hypotheses 3 indicates that corporate governance is influential favorably to firm value. PLS analysis produce a path coefficient as much as 0,184 and p = 0,035. So it is said to be significant. Considering a coefficient of the lane marked positive, then it can be meant that better corporate governance will increase the firm value of Indonesian mining companies listed in IDX. Thus, hypothesis 3 is accepted. This finding is consistent with the research results by Coleman (2007), that the Audit Committee is another mechanism of internal governance that impact to improve the quality of financial management and performance of the company. However, very few empirical studies have been done on the impact of the audit committee of firm performance. According to John and Senbet (1998), a more independent board has more non-executive directors (Non-Executive Directors/NEDs). Weisbach (1988), Cotter, Shivdasani, Zenner (1997) and Coleman (2007) supports this view underlines the importance of the role of the Board of Directors of beyond in protecting shareholders' interests through Influence decision controls. Klein (2002) found that the number of audit committee independence increases with increasing board size and board independence, and decreased in line with the decline in the company's growth opportunities and the company reported losses in a row. Moreover, Klein (2006) found that there is a non-negative linear relationship between audit committee independence and earnings manipulation. Referring to a Table 5.7, it says that Institutional Ownership (X1.5) has outer loading largest, so that it is an indicator of the most powerful as a measuring Corporate Governance (X1) variable. As the rate of outer loading institutional ownership is positive, thus it means that institutional ownership has the greatest contribution. Good Corporate governance also increases financial performance and firm value. It is consistent with the results of the research of Chen et al. (2008) declaring that institutional investors can give positive contributions through the cost supervision that may influence management behavior. 5.4.3 The Influence of Risk on Firm’s Financial Performance Test on hypotheses 4 stating that risk affects the financial performance of corporations. PLS analysis produce a path coefficient as much as -0,081 and p = 0,020 so it is said to be significant. Considering a coefficient of the lane marked negative then it means that the higher risk would lower financial performance of the Indonesian mining company listed in IDX. Therefore, hypothesis 4 is accepted. According to the pecking order theory, a company that has the ability to generate high profit generally has a low debt level, thus it will have a low level of risk. Research results by Chung et al. (2003) found that the Tobin’s Q ratio (firm value) is associated positively with significant profitability (financial performance) and is associated with negative risk. During this research, the knowledge of the theory and research that there's been more discussed about the influence of the financial performance and firm value against the risk. Researchers in this study tried to do the contrary i.e. how influence risk of financial performance, particularly in mining company listed in the IDX, can be a novelty in this research. According to the financial report 2009 PT Adaro Energy Tbk, mining is a risky business. Businesses that require huge capital, long-term, and yields slow. It takes specialized knowledge, experience and contains significant barriers and obstacles that must be overcome. This business is governed by strict regulation, brings great influence on the community, and always relevant and potentially exposed to the negative influences of the volatility of commodity markets in terms of costs and revenues. 209
- 11. European Journal of Business and Management ISSN 2222-1905 (Paper) ISSN 2222-2839 (Online) Vol.5, No.29, 2013 www.iiste.org 5.4.4 The Influence of Capital Structure on Risk Test on hypothesis 5 is stating that capital structure affects the risk. PLS analysis produces a path coefficient as much as 0,085 and p = 0,076, so it is said to be insignificant. This can be inferred that capital structure does not affect the risk in mining company in listed in IDX. Thus hypothesis 5 is rejected. The finding is not consistent with the opinions of pecking order theory that the higher levels of debt of an enterprise, the higher the risk of the company will be. Companies that had the ability to generate high profit, on generally will have a low debt and thus it will have low risk. These findings confirm the MM Theory which says that capital structure does not affect the firm value. Factor which influences the firm value is the level of profit and business risk. Furthermore, MM Theory says that the value of debt has turned a company with debt to have higher value compare to companies with no debt. The implications of the MM Theory, companies can use debt as much as possible, but this theory cannot be applied for granted owing must meet several assumptions. According to Brigham and Houston (2011) the assumptions that became the basis of the study is not a realistic assumption MM, so that the results are subject to be questioned. 5.4.5 The Influence of Capital Structure on Firm’s Financial Performance Test on hypothesis 6 is stating that capital structure affects the financial performance of companies. PLS analysis produces a path coefficient as much as -0,215 and p = 0,0008. So, it is said to be significant. Considering a negative coefficient of the lane, it means that the higher capital structure will lower the financial performance of mining companies listed in IDX. Thus hypothesis 6 is accepted. This findings confirm the pecking order theory that is supported by Jensen and Meckling (1976), Myers (1977), Fama and French (1997), which predicts a negative relationship between leverage and profitability. Pecking order theory States that debt affect negatively to financial performance and firm value, the higher the level of indebtedness of a corporation then the higher the risk of the company. The company has the ability to generate high profit generally has a low debt level, thus it will have a low risk. These findings are also consistent with the results of the research of Zeitun and Tian (2007) that tested the relationship between capital structure and firm performance in Jordan. The results show that the level of debt is associated with the negative performance (both accounting and market-based measurement), as well as research from Ebaid (2009), that the capital structure affects negatively to firm performance. 5.4.6 The Influence of Capital Structure on Firm Value Test on hypothesis 7 says that capital structure affects the firm value. PLS analysis produces a path coefficient as much as -0,131 and p = 0,013. So it is said to be significant. Considering a coefficient the lane is negative, it could mean that the higher capital structure will lower the value of mining companies in Indonesia. Thus, hypothesis 7 is accepted. These findings confirm the pecking order theory describing the negative impact of debt on the financial performance and firm value. The higher the level of indebtedness of a corporation then the higher the risk of the company will be. The company which has the ability to generate high profit generally has a low debt level, thus will have a low risk. These findings are consistent with the results of the research of Zeitun and Tian (2007) that test the relationship between capital structure and firm performance in Jordan, the results show that the level of debt associated with the negative performance (both accounting and market-based measurement), as well as research from Ebaid (2009), that the capital structure affects firm performance negatively. 5.4.7 The Influence of Financial Performance on Firm Value Test on hypothesis 8 asserts that financial performance is favorably influential to firm value. PLS analysis produces a path coefficient as much as 0,343 and p = 0,0017. So, it is said to be significant. Considering a coefficient of the lane is positive, this indicates that the better financial performance will increase the firm value of mining companies listed in IDX. Thus, hypothesis 8 is accepted. These findings confirm the MM Theory stating that some factors that affect firm value are the level of profit and business risk. These findings are consistent with the results of the research of Demsetz and Villalonga (2001). They found that financial performance measured using profit rate is associated significantly with the firm value measured using Tobin% u2019s Q. It is also consistent with the results of the study by Chung et al. (2003). He found that% u2019s Tobin Q ratio (firm value) corresponds to a significant result with profitability (financial performance) and negatively correlated with risk. The main purpose of the company is to maximize firm value. The purpose of this does not 210
- 12. European Journal of Business and Management ISSN 2222-1905 (Paper) ISSN 2222-2839 (Online) Vol.5, No.29, 2013 www.iiste.org only bring benefits for shareholders, but also provide the best benefits for society (Keown, et al 2004). An increase in firm value can be achieved if the company can achieve the targeted profit. 6. Concluding Remarks 6.1. Conclusion Based on the presented findings of the research, then researchers come to some following conclusions: 1. Corporate Governance has no Influence to the Risk on a mining company in Indonesia listed in the IDX. in other words, a good corporate governance practices at a mining company in Indonesia which is recorded in IDX has no Influence to the risk. Risk proxies in this study uses market risk; 2. The better corporate governance will improve Financial Performance. This finding confirmed some previous studies suggesting that corporate governance is influential favorably to firm performance; 3. The better Corporate Governance will increase the Firm Value; 4. The higher Risk will lower the Financial Performance. This finding is a novelty in this research because all this knowledge, theories and research researcher that there has been more discussed are about the influence of the financial performance and firm value against the risk. Researchers in this study tried to do the study instead how the influence of risk in correspond to firm financial performance, particularly in mining companies listed in the IDX; 5. Capital Structure has no Influence on the Risk. These findings confirm the MM Theory which says that capital structure does not affect firm value. What influences the firm value is the level of profit and business risk. Further, MM Theory says that the value of a company with debt has turned out to be higher compare to companies with no debt; 6. Capital structure has negative Influences to Financial Performance. These findings confirm pecking order theory that is supported by Jensen and Meckling (1976), Myers (1977), Fama and French (1997) who predict negative relationship between leverage and profitability; 7. Capital Structure affects negatively to Firm Value. These findings confirm the pecking order theory describing the negative impact of debt on the financial performance and firm value. The higher the level of indebtedness of a corporation, then the company will have higher risk. The company has the ability to generate high profit generally has a low debt level, thus will have a low risk; and 8. The better Financial Performance will improve Firm Value. These findings confirm the MM Theory stating the factors that affect the firm value are the level of profit and business risk. This is in accordance to the results of the research by Demsetz and Villalonga (2001). They found that financial performance which is measured using the profit rate is associated significantly with the firm value measured using Tobin’s Q. It is also consistent with the results of the study by Chung et al. (2003) saying that Tobin’s Q ratio (firm value) corresponds to a significant result with profitability (financial performance) and connects it with the negative risk. 6.2. Research Limitations and Suggestions Suggestions in this research were given based on the findings of research and the limitations of research: 1. Risk in this research is only using market risk by the use of a parameter betas share. Formerly, researchers will use market risk by the use of a parameter betas stock and accounting risk by using the parameters betas ROA, but researchers have difficulty to obtain data of quarterly report from the mining companies which will be used as sample. This is because not all companies publish financial report on the website www.IDX.co.id every 3 months. Researcher suggested experimental work which will generate variable risk which can be proxied by some risk indicators like degree of operating leverage, degree of financial leverage, variability of ROA, and other. 2. Ownership, the Proportion of Independent Commissioners, the Proportion of Independent Audit Committee, and Institutional Ownership, turns out to be a significant positive coefficient has a value and just Proportion of the Non-Executive Director, Proportion of Independent Audit Committee and Institutional Ownership. For the future research, it is recommended to include other indicators such as numbers of directors in board 211
- 13. European Journal of Business and Management ISSN 2222-1905 (Paper) ISSN 2222-2839 (Online) Vol.5, No.29, 2013 www.iiste.org meeting, numbers of board commissioners meeting, numbers of audit committee meeting, disclosure, proportion of foreign ownership, the proportion of public shares, and more. 3. Capital structure in this study proxy using indicators of debt ratio and the debt to equity ratio. Debt coefficient numbers and equity ratio in this study are negative, so it can't be used together with the debt ratio. One of the findings in this study is the Influence of capital structure toward the risk proxies that use market risk which is found to be not significant and not influential. This may imply that the debt increases when there is no Influence against market risk. Therefore, researchers suggest that research in the future should include the indicator proportion of foreign debt to total assets. Investigators suspect that debts from foreign financial institutions or foreign stock ownership also can improve financial performance and can also protect the firm from business risks. References Anderson, Ronald C., Mansi Sattar A., and Reeb David M., 2004, Board characteristics, accounting report integrity, and the cost of debt, Journal of Accounting and Economics, Volume 37, Issue 3, September 2004, Pages 315–342. Bathala, C. T. and Rao, R. P., 1995: The Determinants of Board Composition: An Agency Theory Perspective, Managerial and Decision Economics, 16, 59-69. Available at URL: DOI: 10.1002/mde.4090160108. Beaver,William., Kettler, Paul.and Scholes, Myron. 1970.The Association between Market Determined and Accounting Determined Risk Measures. The Accounting Review, Vol. 45, No. 4 (Oct., 1970), pp. 654-682. Beaver,William.and Manegold, J. 1975.The Association Between Market-determined and Accountingdetermined Measures of Systematic Risk: Some Further Evidence, Journal of Financial and Quantitative Analysis, June, pp. 231 - 284. Brealey, Richard A., Myers, Stewart C., Allen, Franklin. 2011.Principles of Corporate Finance, Tenth Edition, Published by McGraw-Hill/Irwin, a business unit of The McGraw-Hill Companies, Inc. Brigham, Eugene F. and Daves, Phillip R., 2007, Intermediate Financial Management, Ninth Edition, Thomson Higher Education, 5191 Natorp Boulevard, Mason, OH 45040, USA. Brigham, Eugene F. and Houston, Joel F., 2010, Essencial of Financial Management, 11th Editions – Book 1 (translation), Penerbit Salemba Empat, Jl. Raya Lenteng Agung No. 101, Jagakarsa, Jakarta 12610. Brigham, Eugene F. and Houston, Joel F.2011.Essencial of Financial Management, 11th Editions – Book 2 (translation), Penerbit Salemba Empat, Jl. Raya Lenteng Agung No. 101, Jagakarsa, Jakarta 12610. Chen, Jianguo., Blenman, Lloyd., And Chen, Dar-Hsi. 2008.Does institutional ownership create values? The New Zealand case, Quarterly Journal of Finance and Accounting, Vol. 47, No. 4, Financing Costs,Earnings Management, and Risks: Debt and Equity Markets (Autumn, 2008), pp. 109-124. Chung, Kee H. and Pruitt, Stephen W. 1994.A Simple Approximation of Tobin's Q. Financial Management, Vol. 23, No. 3, 1994. Chung, Kee H., Wright, Peter.and Kedia, Ben. 2003.Corporate Governance and Market Valuation of Capital and R&D Investment, Review of Financial Economics, 12, 161-172. Coleman, Anthony Kyereboah. 2007.Corporate Governance And Firm Performance In Africa – A Dynamic Panel, A Paper Prepared for the “International Conference on Corporate Governance in Emerging Markets”, Organized by the Global Corporate Governance Forum (GCGF) and Asian Institute of Corporate Governance (AICG), 15th -17th November, 2007, Sabanci University, Istanbul, Turkey. Cotter, James F., Shivdasani,Anil., Zenner, Marc. 1997.Do independent directors enhance target shareholder wealth during tender offers?, Journal of Financial Economics, Volume 43, Issue 2, February 1997, Pages 195–218. DECISION OF THE BOARD OF DIRECTORS PT JAKARTA STOCK EXCHANGE NUMBER: Kep305/BEJ/07-2004 IA RULE NUMBER OF SHARES AND LISTING OF SECURITIES OTHER THAN EQUITY SHARES ISSUED BY THE COMPANY LISTED. 212
- 14. European Journal of Business and Management ISSN 2222-1905 (Paper) ISSN 2222-2839 (Online) Vol.5, No.29, 2013 www.iiste.org Demsetz Harold and Villalonga Belén. 2001.Ownership structure and corporate performance. Journal of Corporate Finance Volume 7, Issue 3, September 2001, Pages 209–233. Ebaid Ibrahim El-Sayed. 2009.The impact of capital-structure choice on firm performance: empirical evidence from Egypt, Journal of Risk Finance, The, Vol. 10 Iss: 5, pp.477 – 487. Faccio Mara and Lasfer Meziane. 1999.Managerial Ownership, Board Structure and Firm Value: The UK Evidence. Cass Business School Research Paper. Available at SSRN: http://ssrn.com/abstract=179008. Fama Eugene F. and. Jensen M. C. 1983a. Agency Problems and Residual Claims, Journal of Law and Economics, 26, 327-349. Fama Eugene F. and Jensen.M.C. 1983b.The separation of ownership and control. Journal of law and economics, 26 (2), 301–325. Fama Eugene F. and French Kenneth R. 1997.Taxes, Financing Decisions, and Firm Value. Center for Research in Security Prices (CRSP) Working Paper. Fama Eugene F. and French Kenneth R. 2002.Testing tradeoff and pecking order predictions about dividends and debt, Review of Financial Studies, Vol. 15, pp. 1-33. Francis R. and Armstrong A. 2003.Ethics as a Risk Management Strategy: The Australian Experience. Journal of Business Ethics 45: 375–385, 2003. Gitman Lawrence J. and Zutter Chad J. 2012.Principles of Managerial Finance, Thirteenth Edition, The Prentice Hall series in finance, ISBN 978-0-13-611946-3 (alk. paper). Hermalin, B. and Weisbach, M. 1991.The Influences of Board Composition and Direct Incentives on Firm Performance, Financial Management, 20(4), Vol. 20, No. 4, pp. 101-112. Hoyt, Robert E. and Liebenberg, Andre P. 2011.THE VALUE OF ENTERPRISE RISK MANAGEMENT, The Journal of Risk and Insurance, 2011, Vol. 78, No. 4, 795-822. Jacobson, Robert. 1987.The Validity of ROI as a Measure of Business Performance, The American Economic Review, Vol. 77, No. 3 (Jun., 1987), pp. 470-478Published by: American Economic Association. Jensen,Michael C. and Meckling,William H. 1976.Theory of the Firm: Managerial Behaviour, Agency Costs, and Ownership Structure, Journal of Financial Economics, 3, 305-350. Jensen, Michael C. 1993.The Modern Industrial Revolution, Exit, and the Failure of Internal Control Systems. Journal of Finance, 48(3), 832-880. John, Kose.and Senbet, Lemma W.1998, Corporate governance and board Influenceiveness, Journal of Banking & Finance, Volume 22, Issue 4, May 1998, Pages 371–403. Jogiyanto, H. M. dan Abdillah, Willy.2009, Konsep dan aplikasi PLS (Partial Least Square) untuk penelitian empris, BPFE Fakultas Ekonomi & Bisnis UGM, Yogyakarta. Keown, Arthur J., Martin, John D., Petty, J. William., Scott David F. jr. 2004.Manajemen Keuangan: Prinsipprinsip Dasar Dan Aplikasi, Jilid 1 (translation), PT Indeks. Keown, Arthur J., Martin, John D., Petty, J. William., Scott David F. jr. 2010.Manajemen Keuangan: Prinsipprinsip Dasar Dan Aplikasi, Jilid 2 (translation), PT Indeks. Klein, April. 1988.Firm Performance and Board Committee Structure, Journal of Law and Economics, Vol. 41, No. 1 (April 1998), pp. 275-304. Stable URL: http://www.jstor.org/stable/10.1086/467391. Klein, April. 2002. Economic Determinants of Audit Committee Independence, The Accounting Review, Vol. 77, No. 2 (Apr., 2002), pp. 435-452. Klein, April. 2006.Audit committee, board of director characteristics, and earnings management, Journal of Accounting and Economics, Volume 33, Issue 3, August 2002, Pages 375–400. Kravchenko, Natalia.and Yusupova, Almira. 2005.Corporate Governance and Firms Valuations: Case of Russia. Available at SSRN: http://ssrn.com/abstract=673182 or http://dx.doi.org/10.2139/ssrn.673182 Lev, Baruch. 1974.On the Association Between Operating Leverage and Risk. The Journal of Financial and Quantitative Analysis, Vol. 9, No. 4 (Sep., 1974), pp. 627-641.University of Washington School of Business Administration. 213
- 15. European Journal of Business and Management ISSN 2222-1905 (Paper) ISSN 2222-2839 (Online) Vol.5, No.29, 2013 www.iiste.org Liang, Neng.and Li, Joanne. 1999.Board Structure and Firm Performance: New Evidence from China’s Private Firms. China Center for Economic Research (CCER), Peking University, China.Paper to be presented at the Academy of Management Annual Conference, Chicago, USA, August 7-10, 1999. Law of the Republic of Indonesia Number 40 of 2007 on Limited Liability Companies. Law of the Republic of Indonesia Nomer11 Of 1967 On Basic Provisions of Mining. Mak, Yuen Teen.and Kusnadi, Yuanto. 2005.Size Really Matters: Further Evidence on the Negative Relationship Between Board Size and Firm Value, Pacific-Basin Finance Journal, Volume 13, Issue 3, June 2005, Pages 301–318. Mayer, Colin. 1996.Corporate Governance, Competition and Performance, OECD Economics Department Working Papers, No. 164, OECD Publishing. Myers, Stewart C. 1977.Determinants of Corporate Borrowing, Journal of Financial Economics 25, 25–43. Myers, Stewart C. and Majluf, Nicholas S. 1984.Corporate financing and investment decisions when firms have information that investors do not have. Journal of Financial Economics 13 (2): 187–221. Patell, James M. 1976,Corporate Forecasts of Earnings Per Share and Stock Price Behavior: Empirical Test, Journal of Accounting Research, Vol. 14, No. 2. (Autumn, 1976), pp. 246-276. Prasetyo, Aries Heru. 2010.Systematic Risk And Capital Structure In Emerging Indonesian Market, 2010 International Conference on Economics, Business and Management, IPEDR vol.2 (2011) © (2011) IAC S IT Press, Manila, Philippines. Prasetyo, Aries Heru. 2011.Corporate Governance and Systematic Risk: Evidence from Indonesia Listed Company, 2011 International Conference on Economics and Finance Research, IPEDR vol.4 (2011) © (2011) IACSIT Press, Singapore. Rajan, Raghuram G. and Zingales, Luigi. 1995, What Do We Know about Capital Structure? Some Evidence from International Data. The Journal of Finance, Vol. 50, No. 5 (Dec., 1995), pp. 1421-1460 Published by: Wiley for the American Finance Association. Reddy,Krishna., Locke, Stuart.and Scrimgeour, Frank. 2010. The efficacy of principle-based corporate governance practices and firm financial performance: An empirical investigation, International Journal of Managerial Finance, Vol. 6 Iss: 3 pp. 190 – 219. Simerly, Roy.and Li, Mingfang. 2000.Environmental dynamism, financial leverage and performance: a theoretical integration and an empirical test, Strategic Management Journal, Vol. 21, pp. 31-49. Solomon, Jill.and Solomon, Aris. 2004.Corporate Governance and Accountability, John Wiley & Sons Ltd, England. Tahir, Izah Mohd.dan Razali, Ahamdad Rizal. 2011.The Relationship Between Enterprise Risk Management (ERM) And Firm Value: Evidance From Malaysian Public Listed Companies, Inernational Journal of Economics and Management Sciences, Vol. 1, No. 2, 2011, pp.32-41, ISSN: 2162-6359. Taub, A. 1975.Determinants of firm’s capital structure, Review of Economics and Statistics, Vol. 57, pp. 410-6. Weisbach, Michael S.1998.Outside directors and CEO turnover, Journal of Financial Economics, Volume 20, January–March 1988, Pages 431–460. Wolfe, Joseph. and Sauaia, Antonio Carlos Aidar. 2003. THE TOBIN q AS A COMPANY PERFORMANCEINDICATOR, Developments in Business Simulation and Experiential Learning, Volume 30, 2003. Zeitun, R. and Tian, G. G. 2007.Capital structure and corporate performance - evidence from Jordan, Australasian Accounting Business and Finance Journal, 1(4). 214
- 16. European Journal of Business and Management ISSN 2222-1905 (Paper) ISSN 2222-2839 (Online) Vol.5, No.29, 2013 www.iiste.org Figures and Tables Corporate Governance H1 H2 H3 H4 Risk H5 H8 Financial Performance Firm Value H7 H6 Capital Structure Figure 1. Hypothesis Model Corporate Governance 0,007NS 0,154S -0,081S Risk 0,085NS 0,184S -0,215S Financial Performance 0,343S Firm Value -0,131S Capital Structure Figure 2. A Diagram of the Result of Hypothesis Testing Note: S = Significant NS = Non Significant Table 1. A Descriptive Analysis of the Results for Corporate Governance (X1) variable Indicator Minimum Maximum (1) Proportion of Non-Executive Director (X1.1). Mean Std. Deviation 0 Source: Secondary Data Processed in 2013 215 0.0616 0.16962 0.50 0.3833 0.08361 0.67 0.3407 0.09237 0 (5) Institutional Ownership (X1.5). 0.71 0 (4) Proportion of Independent Audit Committee (X1.4). 0.14527 0.20 (3) Proportion of Independent Commissioners (X1.3). 0.0610 0 (2) Managerial Ownership (X1.2). 1.00 0.99 0.5876 0.23676
- 17. European Journal of Business and Management ISSN 2222-1905 (Paper) ISSN 2222-2839 (Online) Vol.5, No.29, 2013 www.iiste.org Table 2. A Descriptive Analysis Of The Results for Capital Structure (X2) variable. Indicator Minimum Maximum Mean (1) Debt Ratio (X2.1). 0.17 0.98 0.5109 (2) Debt to Equity Ratio (X2.2). 0.21 55.16 2.6017 Std. Deviation 0.20327 6.84044 Source: Secondary Data Processed in 2013 Table 3. A Descriptive Analysis Of The Results for Risk (Y1) and Financial Performance (Y2) Variable. Variable/Indicator Minimum Maximum Mean Std. Deviation Risk (Y1) (1) Market Risk (Y1.1). -1.16 6.41 0.8123 1.01190 Variable Financial Performance (Y2) (1) Return on Investment (Y2.1). -0.22 1.20 0.0865 0.17419 (2) Return on Equity (Y2.2). (3) Net Profit Margin (Y2.3). -1.80 4.14 0.1345 0.53227 -126.08 26.32 -0.9179 13.70906 Mean Std. Deviation 1.4996 1.52909 Source: Secondary Data Processed in 2013 Table 4. A Descriptive Analysis Of The Results for Firm Value (Y3) Variable Indicator Minimum Maximum (1) Tobin’s Q (Y3.1). 0.22 7.45 (2) Price-Earnings Ratio (Y3.2). -1.29 2.55 0.1647 0.44330 50 50750 4814.04 9880.900 (3) Closing Price (Y3.3). Source: Secondary Data Processed in 2013 Table 5. The result of Assumption Linearity Testing No The Relationship Between Variables 1 Corporate Governance (X1) Risk (Y1) 2 Corporate Governance (X1) Financial Performance (Y2) 3 Corporate Governance (X1) Firm Value (Y3) 4 Risk (Y1) Financial Performance (Y2) 5 Capital Structure (X2) Risk (Y1) 6 Capital Structure (X2) Financial Performance (Y2) 7 Capital Structure (X2) Firm Value (Y3) 8 Financial Performance (Y2) Firm Value (Y3) Source: Secondary Data Processed in 2013 Hypothesis Testing All Models Insignificant All Models Insignificant All Models Insignificant All Models Insignificant All Models Insignificant All Models Insignificant All Models Insignificant All Models Insignificant Table 6. Complete Outer Loading Indicators for Corporate Governance (X1) Variable Indicator Outer Loading Proportion of Non-Executive Director (X1.1). 0.552111 Managerial Ownership (X1.2). -0.161160 Proportion of Independent Commissioners (X1.3). -0.343509 Proportion of Independent Audit Committee (X1.4). 0.263837 Institutional Ownership (X1.5). 0.597874 Source: Secondary Data Processed in 2013 p-value 0.0178 0.2630 0.0488 0.1724 0.0099 Table 7. Outer Loading Indicator Marked Positive For Corporate Governance (X1) Variable Indicator Outer Loading Proportion of Non-Executive Director (X1.1). 0.361553 Proportion of Independent Audit Committee (X1.4). 0.391122 Institutional Ownership (X1.5). 0.814152 Source: Secondary Data Processed in 2013 216 Description Linier Linier Linier Linier Linier Linier Linier Linier Description Positive Negative Negative Positive Positive p-value 0.0248 0.0422 0.0000
- 18. European Journal of Business and Management ISSN 2222-1905 (Paper) ISSN 2222-2839 (Online) Vol.5, No.29, 2013 www.iiste.org Table 8. Complete Outer Loading Indicators for Capital Structure (X2), Financial Performance (Y2) and Firm Value (Y3) Variables Variable/Indicator Outer Weight p-value Description Capital Structure (X2) Debt Ratio (X2.1). 1.192769 0.0017 Positive Debt to Equity Ratio (X2.2). -0.788877 0.0511 Negative Financial Performance (Y2) Return on Investment (Y2.1). 2.035569 0.0017 Positive Return on Equity (Y2.2). -1.492016 0.0511 Negative Net Profit Margin (Y2.3). -0.113301 0.2589 Negative Firm Value (Y3) Tobin’s Q (Y3.1). 0.411725 0.0717 Positive Price-Earnings Ratio (Y3.2). -0.114281 0.2899 Negative Closing Price (Y3.3). 0.682591 0.0141 Positive Source: Secondary Data Processed in 2013 Table 9. Outer Weight indicator Positive For Firm Value (Y3) Variable/Indicator Outer Weight Tobin’s Q (Y3.1). 0.506851 Closing Price (Y3.3). 0.589826 Source: Secondary Data Processed in 2013 Table 10. Goodness of Fit Model No Endogenous Variable 1 Risk (Y1) 2 Financial Performance (Y2) 3 Firm Value (Y3) Source: Secondary Data Processed in 2013 p-value 0.0196 0.0125 R-square 0.098412 0.233638 0.006994 Table 11. The Result of Research Hypothesis Testing No The Relationship Between Variables 1 Corporate Governance (X1) 2 Corporate Governance (X1) 3 Corporate Governance (X1) 4 Risk (Y1) 5 Capital Structure (X2) 6 Capital Structure (X2) 7 Capital Structure (X2) 8 Financial Performance (Y2) Source: Secondary Data Processed in 2013 Risk (Y1) Financial Performance (Y2) Firm Value (Y3) Financial Performance (Y2) Risk (Y1) Financial Performance (Y2) Firm Value (Y3) Firm Value (Y3) 217 Path Coefficient 0.007254 0.8130 Non Significant 0.153680 0.0000 Significant 0.184423 0.0355 Significant -0.081374 0.0204 Significant 0.085415 0.0759 Non Significant -0.214481 0.0008 Significant -0.130727 0.342956 0.0133 0.0017 Significant Significant p-value Descriptive
- 19. This academic article was published by The International Institute for Science, Technology and Education (IISTE). The IISTE is a pioneer in the Open Access Publishing service based in the U.S. and Europe. The aim of the institute is Accelerating Global Knowledge Sharing. More information about the publisher can be found in the IISTE’s homepage: http://www.iiste.org CALL FOR JOURNAL PAPERS The IISTE is currently hosting more than 30 peer-reviewed academic journals and collaborating with academic institutions around the world. There’s no deadline for submission. Prospective authors of IISTE journals can find the submission instruction on the following page: http://www.iiste.org/journals/ The IISTE editorial team promises to the review and publish all the qualified submissions in a fast manner. All the journals articles are available online to the readers all over the world without financial, legal, or technical barriers other than those inseparable from gaining access to the internet itself. Printed version of the journals is also available upon request of readers and authors. MORE RESOURCES Book publication information: http://www.iiste.org/book/ Recent conferences: http://www.iiste.org/conference/ IISTE Knowledge Sharing Partners EBSCO, Index Copernicus, Ulrich's Periodicals Directory, JournalTOCS, PKP Open Archives Harvester, Bielefeld Academic Search Engine, Elektronische Zeitschriftenbibliothek EZB, Open J-Gate, OCLC WorldCat, Universe Digtial Library , NewJour, Google Scholar