Recomendados

Recomendados
Más contenido relacionado
La actualidad más candente
La actualidad más candente (20)
Similar a Predictors of A1c among women with a history of gestational diabetes in Aboriginal communities of Alberta
Similar a Predictors of A1c among women with a history of gestational diabetes in Aboriginal communities of Alberta (20)
Más de Kelli Buckreus
Más de Kelli Buckreus (20)
Último
Último (20)
Predictors of A1c among women with a history of gestational diabetes in Aboriginal communities of Alberta
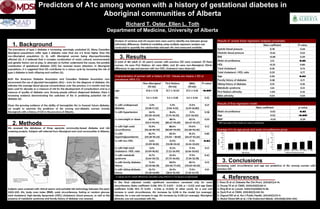
- 1. Predictors of A1c among women with a history of gestational diabetes in Aboriginal communities of Alberta Richard T. Oster, Ellen L. Toth Department of Medicine, University of Alberta Canadian Aboriginal Issues Database, www.ualberta.ca/ ~walld/map.html Aboriginal Affairs and Northern Development Canada, www.ainc- inac.gc.ca 1. Background The prevalence of type 2 diabetes is increasing, seemingly unabated (1). Many Canadian Aboriginal populations suffer type 2 diabetes rates that are 2-5 times higher than the non-Aboriginal population (2, 3), with Aboriginal women being disproportionately affected (4). It is believed that a complex combination of social, cultural, environmental and genetic factors are at play. In attempts to further understand the causes, the possible contribution of gestational diabetes (GD) has received recent attention. In Aboriginal populations, it is suggested that GD contributes to a vicious cycle by increasing the risk of type 2 diabetes in both offspring and mothers (5). Both the American Diabetes Association and Canadian Diabetes Association now recommend the use of glycated hemoglobin (A1c) ≥ 6.5% for the diagnosis of diabetes. A1c indicates the average blood glucose concentrations over the previous 2-3 months and has been used for decades as a measure of risk for the development of complications and as a measure of quality of diabetes care. Among people without diagnosed diabetes, there is increasing evidence demonstrating the usefulness of A1c in predicting potential risk of diabetes (6). Given the growing evidence of the ability of hemoglobin A1c to forecast future diabetes, we sought to examine the predictors of A1c among non-diabetic women (mostly Aboriginal) with a history of GD in the province of Alberta. 2. Methods We accessed the databases of three separate community-based diabetes and risk screening projects. Subjects self-referred from Aboriginal and rural communities in Alberta. Subjects were screened with clinical exams and portable lab technology between the years 2003-2011. A1c, body mass index (BMI), waist circumference, fasting or random glucose, total cholesterol, high-density lipoprotein (HDL) cholesterol, blood pressure, as well as the presence of metabolic syndrome and family history of diabetes was assessed. K 3. Results A total of 184 adult (≥ 20 years) women with previous GD were screened. Of these women, 114 were First Nations, 40 were Métis, and 30 were non-Aboriginal. Ethnic differences in age and percent with low HDL cholesterol were observed. In the final adjusted model, significant associations remained only for waist circumference (beta coefficient 0.018; 95% CI 0.007 - 0.031; p = 0.02) and age (beta coefficient 0.018; 95% CI 0.010 - 0.026; p <0.001). In other words, for a one unit increase in waist circumference, A1c increases by 0.018 in the model (on average). Likewise, for a one unit increase in age, A1c increases by 0.018 (on average). Aboriginal ethnicity was not associated with A1c. Non-Aboriginal (N=30) First Nations (N=114) Métis (N=40) P-value* age 47.8 ± 11.78 37.7 ± 10.03 37.5 ± 9.36 <0.001 A1c 5.5 ± 0.49 5.4 ± 0.58 5.6 ± 0.94 0.32 % with undiagnosed diabetes 3.3% (0.08-17.22) 5.3% (1.96-11.10) 12.5% (4.19-26.80) 0.21 % with hypertension 24.1% (10.30-43.54) 18.4% (7.74-34.33) 11.1% (3.11-26.06) 0.38 % overweight or obese 82.1% (63.11-93.94) 88.1% (80.47-93.49) 82.1% (66.47-92.47) 0.53 % with high waist circumference 75.9% (56.46-89.70) 88.6% (80.89-93.95) 79.0% (62.68-90.45) 0.13 % with hypertriglyceridemia 86.7% (69.28-96.24) 83.3% (74.94 – 89.81) 81.2% (65.67-92.26) 0.85 % with low HDL 3.6% (0.09-18.35) 21.9% (13.08-33.14) 17.1% (6.56-33.65) 0.04 % with high total cholesterol : HDL ratio 3.6% (0.09-18.35) 15.2% (7.22-26.99) 17.4% (6.56-33.65) 0.21 % with metabolic syndrome 16.7% (5.64-34.72) 25.4% (17.75-34.45) 17.5% (7.34-32.78) 0.42 % with family diabetes history 71.4% (51.33-86.78) 68.9% (59.06-77.69) 86.1% (70.50-95.33) 0.13 % with sibling diabetes history 26.7% (12.28-45.89) 26.3% (18.51-35.39) 17.5% (7.34-32.79) 0.51 Characteristics of women with a history of GD. Values are means ± SD or prevalence (95% CI). * p-values are for overall differences calculated using ANOVA or Chi-square as appropriate Beta coefficient P-value Systolic blood pressure 0.78 0.44 Diastolic blood pressure -0.65 0.52 BMI -0.68 0.49 Waist circumference 2.12 0.03 HDL -0.25 0.80 Total cholesterol 0.35 0.73 Total cholesterol : HDL ratio 0.29 0.77 Age 2.06 0.04 Family history of diabetes 0.38 0.71 Sibling history of diabetes 0.91 0.36 Metabolic syndrome 1.54 0.13 First Nations ethnicity -1.00 0.32 Métis ethnicity 0.54 0.54 Results of simple linear regression analysis (univariate) Beta coefficient p-value Waist circumference 0.02 0.02 Age 0.02 <0.001 BMI* -0.01 0.29 Results of final regression model * BMI was kept in the model as it was a confounder 3. Conclusions Increasing waist circumference and age are predictive of A1c among women with previous GD. Analysis of variance and chi-square tests were used to identify any between group (ethnicity) differences. Statistical modeling using multiple regression analysis was conducted to quantify the relationships between A1c and measured variables. 20-29 30-39 40-49 50-59 > 60 4 4.5 5 5.5 6 6.5 7 7.5 Age group A1c(%) < 84.9 85-99.9 100-114.9 115-129.9 >130 4 4.5 5 5.5 6 6.5 7 7.5 Waist circumferencegroup A1c(%) Average A1c by age group and waist circumference group 4. References 1. Shaw JE et al. Diabetes Res Clin Pract. 2010;87(1):4-14. 2. Young TK et al. CMAJ. 2000;163(5):561-6. 3. King M et al. Lancet. 2009;374(9683):76-85. 4. Dyck R et al. CMAJ. 2010;182(3):249-56. 5. Osgood ND et al. Am J Public Health. 2011;101(1):173-9. 6. Abdul-Ghani MA et al. J Clin Endocrinol Metab. 2011;96(8):2596-600. h