Recomendados

Recomendados
Más contenido relacionado
La actualidad más candente
La actualidad más candente (18)
Destacado
Similar a Itrs_muricea_recruitment_pstr_2009_weisman
Similar a Itrs_muricea_recruitment_pstr_2009_weisman (20)
Itrs_muricea_recruitment_pstr_2009_weisman
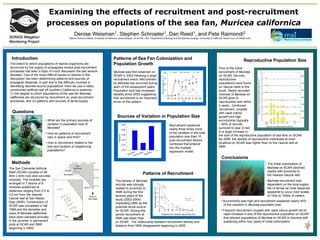
- 1. Examining the effects of recruitment and post-recruitment processes on populations of the sea fan, Muricea californica Denise Weisman1 , Stephen Schroeter1 , Dan Reed1 , and Pete Raimondi2 1 Marine Science Institute, University of California, Santa Barbara, CA 93106, USA, 2 Department of Biology and Evolutionary Ecology, University of California, Santa Cruz, CA 95064 USA Sources of Variation in Population Size Muricea was first observed on SCAR in 2002 following a large recruitment event. Recruitment by Muricea has occurred during each of the subsequent years. Population size has increased steadily since 2002 suggesting that recruitment is an important driver of this pattern. The density of Muricea recruits was strongly related to proximity to SMK during the first several years of the study (2002-2004) implicating SMK as the potential larval source for SCAR. During this period recruitment at SMK was lower than on SCAR. The relationship between recruitment density and distance from SMK disappeared beginning in 2005. Introduction The extent to which populations of marine organisms are structured by the supply of propagules versus post-recruitment processes has been a topic of much discussion the last several decades. One of the more difficult issues to resolve in this discussion has been determining patterns and sources of propagule dispersal, in part due to the difficulty involved in identifying discrete source populations. Here we use a newly constructed artificial reef off southern California to examine: (1) the degree to which populations of the sea fan Muricea californica are structured by recruitment vs. post-recruitment processes, and (2) patterns and sources of larval supply. Questions Methods The San Clemente Artificial Reef (SCAR) consists of 56 40m x 40m rock and concrete modules. The modules are arranged in 7 blocks of 8 modules positioned at distances ranging from 0.5 to 3.5 km from the nearest natural reef at San Mateo Kelp (SMK). Construction of SCAR was completed in fall 1999 and the densities and sizes of Muricea californica have been sampled annually in the summer in permanent plots at SCAR and SMK beginning in 2000. 00 01 02 03 04 05 06 07 08 09 0 5 10 15 20 Year MuriceaDensity(No.m-2 ) Non-recruitRecruit Total Recruitment Post-recruitment Unexplained 0.00 0.10 0.20 0.30 0.40 0.50 PartialR2 Patterns of Recruitment Patterns of Sea Fan Colonization and Population Growth Conclusions • Survivorship was high and recruitment explained nearly 40% of the variation in Muricea population size. • Frequent recruitment coupled with rapid colony growth led to rapid increase in size of the reproductive population on SCAR that allowed populations of Muricea on SCAR to become self- sustaining within four years of initial colonization. Reproductive Population Size Recruitment explained nearly three times more of the variation in the total population size than 10 post-recruitment factors combined that entered into the multiple regression model. • What are the primary sources of variation in population size of Muricea? • How do patterns of recruitment vary in space and time? • How is recruitment related to the size and location of neighboring populations? Prior to the initial recruitment of Muricea on SCAR, the only reproductive populations were found on natural reefs to the south. Newly recruited colonies of Muricea on SCAR grew to reproductive size within 2 years. Continued recruitment, coupled with rapid colony growth and high survivorship (typically ~ 80% of recruits survived to year 2) led to a large increase in Distance from nearest natural reef (km) 0 1 2 3 4 RecruitDensity(No.m-2 ) 0 10 20 30 40 50 60 2002 2003 2005 - 2008 r2 = 0.98 r2 = 0.98 2004 r2 = 0.91 r2 < 0.35, p > 0.6 the size of the reproductive population of sea fans on SCAR. By 2006, the density of reproductive individuals at most locations on SCAR was higher than on the natural reef at SMK. • The initial colonization of Muricea on SCAR declined rapidly with proximity to the nearest natural reef. • Muricea recruitment was dependent on the local supply the of larvae as most dispersal appeared to occur over scales of 100s to 1000s of meters. 2008 Distance from nearest natural reef (km) 0.0 0.6 0.9 1.4 1.8 2.1 2.5 3.40.0 0.6 0.9 1.4 1.8 2.1 2.5 3.40.0 0.6 0.9 1.4 1.8 2.1 2.5 3.40.0 0.6 0.9 1.4 1.8 2.1 2.5 3.40.0 0.6 0.9 1.4 1.8 2.1 2.5 3.40.0 0.6 0.9 1.4 1.8 2.1 2.5 3.40.0 0.6 0.9 1.4 1.8 2.1 2.5 3.40.0 0.6 0.9 1.4 1.8 2.1 2.5 3.40.0 0.6 0.9 1.4 1.8 2.1 2.5 3.4 0 50 100 150 200 250 2007 0 50 100 150 200 250 2006 0 50 100 150 200 250 2005 ReproductivePopulationDensityIndex(No.m-2 ) 0 50 100 150 200 250 2004 0 50 100 150 200 250 2003 0 50 100 150 200 250 2002 0 50 100 150 200 250 (SMK)