A comparative study on sustainable building construction with conventional re...
C25_juliananakao5 TM101206 granskat
1. 1 INTRODUCTION
Buildings play a significant role to decrease society´s greenhouse gas emissions and also to
assure energy security in medium and long term (Fay et. al, 2000). It is estimated that the con-
struction industry annually uses 30-40% of the world energy (UNEP, 2007).
Reducing energy demand during the operation of buildings has become a priority to decrease
the environmental impact of the building and construction sectors. Over the past years different
efforts have been made to reduce the energy demand and different definitions of low energy
buildings have emerged, such as passive houses, zero carbon houses, positive energy houses,
etc. Mostly, these concepts focus on achieving energy efficiency during the use stage.
Even though, it is extremely important to improve energy efficiency during the operation
stage of buildings, it should be stressed, that this is not the only environmental aspect of the
sector. The life cycle of a building starts from the extraction of natural resources for the manu-
facture of building materials until the demolition and disposal of construction wastes. It con-
sumes a lot of energy during the whole life cycle and along with low-energy concepts entering
the market, more emphasis has started to be paid also to the energy use and environmental im-
pact related to other life cycle stages of buildings. For instance, Marsh et al. (2000) showed that
the use stage accounted for 40-95% in a number of new, two-storey buildings in Denmark. And
the construction of buildings have shown to form to a considerable part of the contributions to
climate change of the Swedish building sector (Toller et al, 2010).
Besides the energy use, the building sector also contributes to other environmental impacts
such as resource depletion, biological diversity losses, global warming, acidification, etc.
Basic analysis to minimize the contributions to climate change in
building design – a Swedish case study
Juliana Nakao
Junakao@gmail.com
Tove Malmqvist
Royal Institute of Technology, Department of Urban Planning and Environment, Division of Environ-
mental Strategies Research, Stockholm, Sweden, tove.malmqvist@abe.kth.se
Mauritz Glaumann
University of Gävle, Department of Building, Energy and Environmental Engineering, Division of Build-
ing Quality, Gävle, Sweden, mauritz.glaumann@hig.se
ABSTRACT: It is estimated that the building sector is responsible to 30-40% of the energy use
worldwide. Over the past years, reducing energy demand during the usage stage of a building
has become a priority for minimizing the environmental impact related to the building sector.
Even though it is extremely important to reduce the energy during the operational stage, recent
studies have highlighted that solutions to achieve low energy demand can lead to an increase of
the embodied energy of buildings. Life cycle assessment (LCA) is a useful approach to under-
stand these relations regarding a building´s environmental impact in different life cycle stages.
This paper presents a case study of a residential house in Sweden designed to be a low energy
building. A basic tool for analyzing operational energy use and contributions to climate change
in a life cycle perspective is used to calculate the impact on climate change and to suggest po-
tential improvements of this house. The performance of such a basic LCA tool shows that the
use of this type of building assessment tool during the design phase can provide useful insights
when trying to improve the environmental performance of buildings. The results of different
scenarios tested in this case study shows that a careful material choice as well as to improve the
space efficiency of the house during the design phase is crucial to decrease the contributions to
climate change.
2. (Kofoworola and Gheewala, 2008; Fay et. al, 2000; Bribia´n et. al, 2009). Accordingly, the life
cycle assessment (LCA) methodology is an important environmental assessment approach to
understand the impact related to the sector and as a consequence, to give suggestions on envi-
ronmental improvements.
There are many applications of LCA in the building sector; it can be applied to building
products and building components as well as to a single or a group of buildings. Due to the
large amount of data required, the use of a software tool is recommended. Most LCA tools in-
clude databases that contain data regarding emissions from building material manufacture and
different sources of energy (Malmqvist et al, 2010; IEA, 2001). Current tools which can be
used for assessment of buildings may be divided into basic, medium and advanced (Malmqvist
et al, 2010). The basic LCA tools normally cover one or two impact categories with basic cal-
culations in excel sheets (Bribia´n et. al, 2009; Malmqvist et. al, 2010). Medium tools provide
more complete LCA studies, normally covering a majority of the life cycle stages and different
impact categories. Some of them also include calculations of life cycle costs. Examples of me-
dium tools are: Ecosoft, EcoEffect, Athena, Equer, Eco-quantum, Jomar, Legep, Becost, En-
vest 2 (Bribia´n et. al, 2009; Glaumann et al, 2010).
General and comprehensive LCA tools like SimaPro and Gabi are classified as advanced
tools. They provide a more detailed LCA and leave more methodological options for the user to
decide. They can also be used by the building sector but they are more recommendable for the
assessment on the building material and component level (Bribia´n et. al, 2009; Glaumann et
al, 2010).
1.1 Goal and objectives
This paper presents a case study of a residential house in Sweden. . A basic LCA tool,
ENSLIC BASIC ENERGY & CLIMATE TOOL, have been chosen to make an analysis of contribu-
tions to climate change and to suggest potential improvements for the house. The objective of
the paper is thus to discuss the use of such basic tools for improving the environmental perfor-
mance of buildings in a life cycle perspective. The paper is based on the main author´s Master
thesis project at the Royal Institute of Technology in Stockholm (Nakao, 2010).
2 CASE STUDY
The Ross Arkitektur & design AB is a Swedish company founded in 1996 in Stockholm by
Paul and Deirdre Ross. The office concept is to develop houses that have a low energy demand,
good indoor air quality and long life. Currently the company is developing a new project for a
residential house in Uppsala which is aimed to be a net zero energy building (ZEB). To be con-
sidered as a ZEB a building should produce enough energy or exceed its annual demand (Her-
nandez & Kenny, 2010). In the case study building this is achieved by the use of photovoltaics
and solar panels.
The building under study is a single family house projected to be built in Uppsala, Sweden.
The usable floor area is 173 m2
, designed to be a guest house for a family of four people. The
house has two floors (122 m2
1st floor, 51 m2
2nd floor): a hall, a bathroom, a kitchen, a living
room and two bedrooms downstairs, and a library, a bathroom, a master bedroom and a dress-
ing room upstairs (Figures 1-3). Table 1 shows general information of the building.
3. Table 1. General information of the case study building.
FACT BOX
Architect Ross Arkitektur & design AB
Year of design 2010
Location Uppsala, Sweden
Building type Residential
Average outdoor temperature 5,7 °C
Usable floor area 173 m2
Heated floor area 173 m2
Designed numbers of users 4
Indoor air temperature 20 °C
Air change rate 0,4 of the volume/hour
Basic construction Insulated Concrete Form
Local energy recovery and supply Yes
Figure 1. Case study building, floor 1.
Figure 2. Case study building, floor 2.
4. Figure 3. Case study building, facade.
The project is designed with the same construction used in most of the projects of the com-
pany; Insulated Concrete Form (ICF). Table 2 shows the specifications of the building ele-
ments. In the studied case the reduced energy demand is achieved by local renewable energy
production and increased thermal characteristics. As shown in Table 3, the grid is theoretically
used as a store since the electricity from the photovoltaics and solar panels are produced during
the summer and used during the winter.
Table 2. Specifications of the building elements.
THICKNESS
(mm)
U-VALUE
(W/m2
K)
External wall (EPS, Reinforced concrete,
Polyethene, Wood, Gypsum, Plaster)
514 0,15
Roof (Gypsum, Wood, Rockwool, Wood,
Air gap, Aluminum)
643 0,09
Basement (Concrete, Plastic film, EPS) 500 0,09
Floor Structure (Gypsum, Wood, Concrete) 306 Not relevant
Internal wall type 1 (Concrete lightweight,
Plaster)
150
Internal wall type 2 (Concrete lightweight,
Plaster)
120 Not relevant
Window (Wood, Glass, Air gap) Not relevant 0,8
Door (Wood, Glass, Air gap) Not relevant 1,2
Table 3. Specifications of energy use and supply of the studied building.
kWh / m²,year
Electricity use 57,9
Heat use 68,4
Total energy use 126,3
Photovoltaics -65,5
Small wind turbine (1.7 radius) -2,6
Total local electricity supply -68,1
Heat pump (Air) -45,6
Solar panels -12,7
Total local heat supply -58,3
Total local energy supply -126,5
5. 3 METHODOLOGY
The contributions to climate change as well as the energy use were calculated with the basic
LCA tool “ENSLIC BASIC ENERGY & CLIMATE TOOL” developed by the Royal Institute of
Technology (KTH). This tool gives a rough calculation of contributions to climate change relat-
ed to building material production and energy use during the operational stage. In addition, it
enables estimations of the energy use during the operation stage. Even though the calculation of
climate change contribution only relates to two life cycle stages, these cover the majority of the
impact of the life cycle. This precision has been judged to be feasible for this tool since it main-
ly aims at being a tool for working with improvement options in early design stages.
The tool includes emission data for Swedish conditions. The emissions of construction mate-
rials were provided by Swedish manufacturers, sometimes complemented with Ecoinvent data,
and data for energy carriers based on Swedish sources (Malmqvist et. al, 2010). The contribu-
tion to climate change was calculated by the tool in CO2 equivalents based on GWP 100 values
(Global Warming Potential values with a time horizon of 100 years) from IPCC 2007.
The tool enables calculation of contributions to climate change related to the production of
the main building materials used in the building structure, excluding raw finishing and decorat-
ing, electrical and plumbing material. The contributions to climate change related to the opera-
tion stage relates to the energy demand for heating, ventilation, hot water and electricity.
According to the European Committee for Standardization (CEN 350) the functional unit of
a building should be set according to the function of the building. Therefore, the functional unit
in this case study is “a Swedish residential house designed for 4 people, 173 m2
with indoor
temperature set to be 20 °C and an air exchange rate of 0,35 l/s m2
during an anticipated life
time of 50 years”.
4 RESULTS
4.1 Analysis of contributions to climate change
As it was explained before, the case under study is aimed to be ZEB. The total local renewa-
ble energy production is estimated to make the building self sufficient on a yearly basis, thus
the manufacturing of building materials represents 100% of the contribution to climate change.
This contribution stands for a total of 4,4 kg CO2-equiv./m2
,yr without waste at the construction
site (Table 4). The material for external walls is the part of the building structure that contrib-
utes the most to the impact on climate change. The external walls consist of 140 mm of con-
crete, 330 mm of EPS, 12 mm of wood, 13 mm of gypsum and 3 mm of plaster.
Table 4. Used amounts and contribution to climate change related to different building element without
waste at construction site.
kg/m2
% kg CO2-equiv./m2
,yr %
External walls including
windows and doors 475 58% 1,7 38%
Attic 37 5% 1,2 26%
Basement 44 8% 0,5 12%
Slabs 160 20% 0,4 10%
Internal walls 80 10% 0,6 14%
Total 797 100% 4,4 100%
6. Table 5. Contribution to climate change related to different building materials including waste at the
building site.
MATERIALS kg CO2- equiv. %
Aluminum 6.055 15%
Concrete, lightweight 8.064 20%
Concrete, reinforced 14.308 35%
Glass 1.143 3%
Gypsum, plaster board 1.546 4%
Insulation, Polystyrene,
EPS
3.667 9%
Insulation, Rockwool 3.590 9%
Plaster 549 1%
Polyethene 829 2%
Wood 592 1%
Total 40.343 100%
Per year 807
Per year and m2
4,7
Table 5 shows the materials that contributes the most to climate change. As can be observed
the concrete contributes to the dominant part, 55%, since the production of concrete requires a
large amount of energy, and since it is the material mostly used in the building.
4.2 Potential improvements for the house
Based on these calculations, different scenarios were performed with the aim to find
improvement measures that would enable a further reduction of the contribution to climate
change.
The result shows that the manufacture of building materials contributes most to climate
change, especially the external walls and roof materials production. As it was showed in table 5
the use of concrete plays an important role. Thus, in order to try to reduce the emissions that
come from the construction of walls, two scenarios trying to reduce and avoiding the use of
concrete were tested.
1. Wood wall (WW): The same building design as well as the same local energy produc-
tion, but a wooden structure of the external walls was assumed. This construction
method was chosen according to the specification of a typical passive house in Sweden.
The details of this construction method includes:
13mm plasterboard (fraction of Layer 100%)
70mm Glass wool insulation (fraction of Layer 100%)
70mm Wood (fraction of Layer 20%)
12 mm Polystyrene, EPS (fraction of Layer 100%)
120 mm Glass wool insulation (fraction of Layer 100%)
145 mm Glass wool insulation (fraction of Layer 100%)
145 mm Wood (fraction of Layer 20%)
9 mm Wood (fraction of Layer 100%)
22 mm Air (fraction of Layer 100%)
22 mm Wood (fraction of Layer 100%)
As the production of the insulation Rockwool also contributes significantly to climate change
in the original building, a second scenario reducing the thickness of Rockwool in the roof was
calculated:
7. 2. Rockwool reduction (RR): A reduction from 500 mm to 300 mm thickness of the
Rockwool in the roof was calculated.
Improve the space use efficiency of the building is important to reduce the footprint of the
construction, as it can reduce the total of materials used as well as the heat demand. Based on
that, a third scenario excluding the round space of the first floor using the huge open space as a
floor area of the second floor was created:
3. Space Efficiency (SE): Exclusion of the round space of the first floor and using the
open space as a floor area of the second floor.
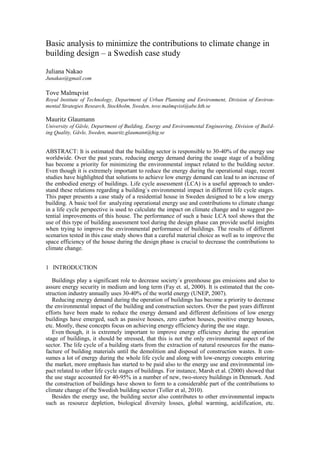
Figure 4 shows a comparison between the original building (OB), WW, RR and SE. As can
be observed from the calculations of the same building design avoiding the use of concrete and
Rockwool insulation can reduce significantly the contribution to climate change in a life cycle
perspective.
-1
0
1
2
3
4
5
OB WW RR SE
kgCO2-eq/m²,yr
OPERATIONAL
MANUFACTURING
Figure 4. Contributions to climate change for alternative designs of the case study building (OB= original
building, WW= wooden construction of external wall, RR= Rockwool reduction in the insulation in the
roof, SE = Space efficiency).
The WW scenario contributes with 3,3 kg CO2-eq/m2
,yr showing a potential reduction of
25% compared to the OB. In the WW scenario the external walls basically consist of wood and
glass wool insulation, which are materials that compared to concrete and Rockwool insulation
cause less emissions of greenhouse gases during the production. It was also noticed that the
WW scenario had less energy losses through the walls than the OB, but it is not a large differ-
ence.
Regarding the RR scenario, Figure 4 shows that reducing the thickness of the insulation in
the roof affects the thermal characteristics more and increases the energy required to heat the
building. However, on the basis of an analysis over a 50 years lifetime the total contribution to
climate change is almost the same as in the original building.
The calculation of the scenario SE shows that improving the space efficiency of the construc-
tion is a good strategy to decrease the emissions of greenhouse gases during both the manufac-
turing and operational life cycle stages. The SE scenario contributes with a total of 3,7 CO2-
eq/m2
,yr, showing a potential reduction of 18%. The importance of this strategy becomes even
more clear when calculating the emissions per designed number of users instead, Figure 5.
8. -50
0
50
100
150
200
250
OB WW RR SE
kgCO2-eq/pers,yr
OPERATIONAL
MANUFACTURING
Figure 5. Contributions to climate change calculated per designed number of user.
By reducing the open space of the second floor it is possible to add another room for two res-
idents at the second floor. The OB is planned for four residents but with alterations within the
square area it becomes possible to accommodate seven residents in the same building. This is
the reason why the SE scenario displays a relatively low impact per person compared to the
other studied scenarios, only 99 kg CO2-eq/pers, yr. In this perspective, the SE scenario shows
a potential reduction of contributions to climate change of 52% in comparison with the original
building.
5 CONCLUSION
A lot of efforts have been put on decreasing the environmental impacts related to buildings´
operational stage. However, recently more attention is starting to be paid to the energy use also
of other life cycle stages of a building. Hence, life cycle assessment is an important approach to
understand the impacts related to the building and construction sectors and to visualize the in-
ter-dependency of different life cycle stages.
This case study application shows how a basic LCA tool for buildings can be used to roughly
analyze the environmental impact, in this case the contribution to climate change, of different
design choices of a building. In this example, the manufacturing life cycle stage stands for a
considerable proportion of the impact in the original design of the building. The case is some-
what special since it has local, renewable energy production and therefore has low greenhouse
gas emissions related to the operational stage of the building. To use the electric grid as a store
of electricity, is however doubtful.
This basic tool actually gives that the manufacturing of building materials of the case study
building represents 100% of the contribution to climate change. More specifically, the tool en-
abled the analysis that external walls and roof were the building elements causing a majority of
the impact. Of individual building materials, the reinforced concrete contributes most to climate
change due to two main reasons; the production of concrete requires much energy for the pro-
duction and it is the material most used in the construction. In general, concrete and metals
have comparatively large contributions to climate change, which creates a relation between im-
pacts and building weight.
The results from the different scenarios performed showed that it is possible to reduce or
avoid the use of the concrete without affecting the thermal characteristics of this house. It was
noticed a potential reduction of 25% of greenhouse gas emissions by replacing the external
walls constructed with EPS and concrete into wood. Although, it should be stressed that the
greenhouse gas emissions for wood materials as well as the concrete depend on how it is han-
dled after demolition (Börjesson &Gustavsson, 1999). And in this study, it is only taken into
account the manufacturing and operational stage, the end-of-life is not considered.
The SE scenario also shows the importance of space use efficiency forreducing the carbon
footprint of the house. By decreasing the external wall perimeter it was observed a considerable
reduction of contributions to climate change during the operational and manufacturing stages.
9. This becomes even more evident when calculating impacts per designed number of users in-
stead of per floor area. To use this type of unit for comparing different building designs should
actually be preferable since it displays impacts more relevant for the function of a building, to
accommodate a certain number of persons, than when comparing impacts per floor area. An-
other advantage with calculating impacts per user is also that housing-related impacts can be
compared to impacts related to other human activities, like driving a car, eating, etc..
The results from this study demonstrate that space efficiency considerations, a careful design
and choice of the materials specifications during the design phase are crucial to reduce the con-
tributions to climate change, particularly in a low-energy building case like the one studied in
the paper. The application of such a basic LCA tool shows that this type of tools can provide
useful learnings for decision makers, provide simple ways of trial-and-error calculations in or-
der to improve the environmental performance of buildings.
6 REFERENCES
Bribia´n, I., Uso´ n, A. & Scarpellini, S. 2009. Life cycle assessment in buildings: state of art and simpli-
fied LCA methodology as complement for building certification. Building and Environment 44 (12):
2510-2520.
Börjesson, P. & Gustavsson, L. 1999. Greenhouse gas balances in building construction: wood versus
concrete from life-cycle and forest land-use perspectives. Energy Policy 28 (9): 575-588.
Fay,R., Treolar, G. & Iyer-Raniga, U. 2000. Life-cycle analysis of buildings: a case study. Building Re-
search & Information 28 (1): 31-41.
Glaumann, M.,, Malmqvist, T., Peuportier, B., Wetzel, C., Scarpellini, S., Zabalza, I., Diaz de Garayo, S.,
Staller, H., Krigsvoll, G., Stoykova, E., Horvath, S., Szalay, Z. & Degiovanni, V.. 2010. Guidelines
for LCA calculations in early design phases. Deliverable D3.1 of European ENSLIC BUILDING pro-
ject. Available at www.enslic.eu, accessed 2010-12-06.
Hernandez, P. & Kenny, P. 2010. From net energy to zero energy buildings: Defining life cycle zero ener-
gy builidings (LC-ZEB). Energy and Buildings 42 (6): 815-821.
IEA. 2001. LCA Methods for buildings. Annex 31 Energy-Related Environmental Impact of Buildings.
Paris: IEA.
Kofoworola, F. & Gheewala, H. 2008. Environmental life cycle assessment of a commercial office build-
ing in Thailand. The international Journal of Life cycle Assessment 13 (6): 498-511.
Marsh R, Lauring M, & Holleris Petersen E. 2000. Arkitektur og miljø - form konstruktion, materialer –
og miljøpåvirkning. Århus: Arkitektskolens Forlag.
Malmqvist, T., Glaumann, M., Scarpellini, S., Zabalza, I., Aranda, A., Llera, E. & Diaz, S. 2010. Life cy-
cle assessment in buildings: The ENSLIC simplified method and guidelines. Energy, in press.
Nakao, J. 2010. A comparison of a low energy building and a standard house from the life cycle assess-
ment perspective. SoM EX 2010-32. Stockholm: KTH Department of Urban Planning and Environ-
ment, Division of Environmental Strategies Research.
Toller, S., Wadeskog, A., Finnveden, G., Malmqvist, T. & Carlsson, A. 2010. Environmental Impacts of
the Swedish Building and Real Estate Management Sectors. Journal of Industrial Ecology, accepted
for publication.
UNEP. 2007. Buildings and Climate Change; Status, Challenge and Opportunities. Paris: UNEP. Avail-
able at: http://www.unep.org/publications/search/pub_details_s.asp?ID=3934