MSCI's decision to delay A share' inclusion won't slow China's pace to further liberalize its capital markets.
•Descargar como DOCX, PDF•
1 recomendación•139 vistas

A-share inclusion proposal will be revisited in MSCI's 2017 Market Classification Review if not earlier. Another year of capital market liberalization ahead of us to look forward to.

Recomendados
Más contenido relacionado
Destacado
Similar a MSCI's decision to delay A share' inclusion won't slow China's pace to further liberalize its capital markets.
Similar a MSCI's decision to delay A share' inclusion won't slow China's pace to further liberalize its capital markets. (20)
Último
Último (20)
MSCI's decision to delay A share' inclusion won't slow China's pace to further liberalize its capital markets.
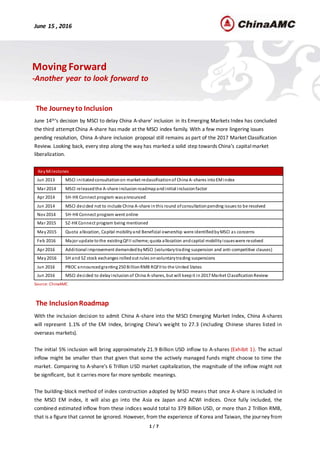
- 1. June 15 , 2016 1 / 7 Moving Forward -Another year to look forward to The Journey to Inclusion June 14th’s decision by MSCI to delay China A-share’ inclusion in its Emerging Markets Index has concluded the third attempt China A-share has made at the MSCI index family. With a few more lingering issues pending resolution, China A-share inclusion proposal still remains as part of the 2017 Market Classification Review. Looking back, every step along the way has marked a solid step towards China’s capitalmarket liberalization. KeyMilestones Jun 2013 MSCI initiatedconsultationon market reclassificationof China A-shares intoEMindex Mar 2014 MSCI releasedthe A-share inclusionroadmapandinitial inclusionfactor Apr 2014 SH-HKConnect program wasannounced Jun 2014 MSCI decided not to include China A-share inthis round ofconsultationpending issues to be resolved Nov2014 SH-HKConnect program went online Mar 2015 SZ-HKConnect program being mentioned May2015 Quota allocation, Capital mobilityand Beneficial ownership were identifiedbyMSCI as concerns Feb 2016 Major update tothe existingQFII scheme;quota allocation andcapital mobilityissueswere resolved Apr 2016 Additional improvement demandedbyMSCI (voluntarytrading suspension and anti-competitive clauses) May2016 SH and SZ stock exchanges rolledout rules onvoluntarytrading suspensions Jun 2016 PBOC announcedgranting250 BillionRMB RQFII to the United States Jun 2016 MSCI decided to delayinclusionof China A-shares, but will keepit in 2017 Market ClassificationReview Source: ChinaAMC The InclusionRoadmap With the inclusion decision to admit China A-share into the MSCI Emerging Market Index, China A-shares will represent 1.1% of the EM Index, bringing China’s weight to 27.3 (including Chinese shares listed in overseas markets). The initial 5% inclusion will bring approximately 21.9 Billion USD inflow to A-shares (Exhibit 1). The actual inflow might be smaller than that given that some the actively managed funds might choose to time the market. Comparing to A-share’s 6 Trillion USD market capitalization, the magnitude of the inflow might not be significant, but it carries more far more symbolic meanings. The building-block method of index construction adopted by MSCI means that once A-share is included in the MSCI EM index, it will also go into the Asia ex Japan and ACWI indices. Once fully included, the combined estimated inflow from these indices would total to 379 Billion USD, or more than 2 Trillion RMB, that is a figure that cannot be ignored. However, from the experience of Korea and Taiwan, the journey from
- 2. 2 / 7 0 5 10 15 20 25 30 35 40 45 1965 1969 1973 1977 1981 1985 1989 1993 1997 2001 2005 2009 2013 Korea Japan Taiwan China Overall USA China A Annual increase for foreign equity ownership: Japan: 0.78% in 27-year history; Taiwan: 0.97% in 16-year history; Korea: 1.19% in 15-year history; USA: 0.25% in 53-year history. China: We expect 0.8% annual initial inclusion to full inclusion could take5 to 10 years. Exhibt1: Inflow Estimates Source: MSCI, ChinaAMC Changes Are Good and For Good What to expect once included? The answer may lie within the precedents set by Korea and Taiwan. The following benefits have been observed in these two markets since their inclusion into the MSCI index family. More balanced investor structure Improved investment styles Further integrationwith global markets Historically, the China A-share market has been dominated by retail investors and had limited institutional participation, especially that of foreign institutions. (Exhibit 2) Retail investors are typically more vulnerable to psychological factors such as greed and fear. The herding effect of retail dominated market could also amplify market swings and volatility. Over time, the investor base of China’s capital market starts to gravitatetowardboth institutionalization and internationalization. (Exhibit 3) Exhibit2. Foreign EquityOwnership Comparison Exhibit3: Structuraltrends ofChina A-shareholding structure Source: CEIC, Wind As a result, one key observation in such market environment is the high turnover rate. Yet, it is expected to taper once the market becomes more institutionalized with the inclusion, as evidenced by what happened in Korea and Taiwan. (Exhibit 4) Asset Tracking theIndex (USD Tn) A-share weight (%) Estimated inflow (USD Bn) 5% Inclusion MSCI ACWI 2.8 0.1 2.8 MSCI EM 1.5 1.1 16.5 MSCI Asia ex Japan 0.2 1.3 2.6 Total 21.9 100% Inclusion MSCI ACWI 2.8 2.3 64.4 MSCI EM 1.5 18.2 273 MSCI Asia ex Japan 0.2 20.7 41.4 Total 378.8 46% 42% 19% 39% 24% 37% 15% 8% 11% 29% 10% 16% 49% 47% 44% 40% 22% 27% 28% 1% 5% 2% 7% 31% 24% 32% 13% 33% 0% 20% 40% 60% 80% 100% China A (2013) China A (2020E) Japan (2014YTD) Taiwan (2013) Korea (2012) US (2010) EU (2012) Retailors Institutional Investors Gov't and Corporates Foreigners
- 3. 3 / 7 26.3 10.4 4.6 28.1 12.9 5.4 19.7 0.9 3.0 0 5 10 15 20 25 30 US China Japan Euronext Canada Germany India Swiss Korea Australia Market Cap Turnover Free float adj. Mkt_cap included in MSCI AC World Index Exhibt4: Turnovercoming downsincethe inclusion,Korea(LHS) andTaiwan(RHS) Source: CICC Owing to the capital control, the Chinese capital market has been relatively isolated to the global markets until the beginning of the new millennium. Since the launch of the QFII scheme back in 2002, the past decade has marked a journey of market liberalization. Yet, the potential inclusion is like no other, it marks the pinnacle of recognition by the global investment communities regarding the market’s accessibility and readiness to be part of a global market. Precedents set by Korea and Taiwan have prophesied further integration and synchronization with global markets, as evidenced by rising correlation with S&P500. (Exhibit 5) Exhibt5: correlationwithUS equity market upsince inclusion Korea(LHS) and Taiwan(RHS) Source: CEIC, CICC China Is Simply Too Big To Ignore Many global investors own an incomplete China portfolio and have overlooked the potential strategic role of China A-shares in their global portfolio, deterred by benchmarking, accessibility and operational concerns. As the China capital market liberalizes, China A-shares could well become part of global equity investors' opportunity set. (Exhibit 6) Exhibt6: MarketCap, Turnover and MSCI AC World IndexWeight Source: CEIC, Wind Domestic Overseas Domestic Overseas US$ tn Since its inclusion in 1998, retail turnover kept lowering Like Korea, Taiwan local investors’ turnover has come down TWSE 100% inclusion intoMSCIKOSPI 100% inclusion into MSCI
- 4. 4 / 7 A-share offers significant benefit of diversification Adding China A-shares to a global equity portfolio could potentially provide enhanced diversification and improve the potential to capture a long-term economic growth premium. (Exhibit 7) Exhibt7: Correlation ofMonthly Returns (Dec2004 –Jun2014) Source: MSCI, Current MSCI China Index which excludes A-shares. Based on unhedged gross monthly return series in USD. At a country level, the China A-share market is the only market among the major developed and emerging countries that has enjoyed such a low correlation with global indexes. (Exhibit 8). For example, Brazil, India, Russia, South Africa and China (without A-shares) all had correlations with developed markets in the range of 0.72 – 0.80, based on the period ending June 2014. Exhibt8: Correlation ofMonthly Returns (Dec2004 –Jun2014) Source: MSCI, Current MSCI China Index which excludes A-shares. Based on unhedged gross monthly return series in USD. Valuation is also attractive June 2016 marks the one year anniversary for the market reaching its peak in summer 2015. Since then the market has entered into a prolonged phase of correction and consolidation. Yet, blue chips have already seen their valuation dipping into the attractive zone (Exhibit 9), especially those names well positioned to benefit from policy and supply side reform expectations will be the first to recover in valuation. ACWI EAFE World EM FM ChinaA ACWI 1 EAFE 0.98 1 World 1.00 0.98 1 EM 0.91 0.89 0.88 1 FM 0.64 0.64 0.64 0.61 1 ChinaA 0.41 0.39 0.39 0.39 0.25 1 ACWI EAFE World EM ChinaA 0.41 0.39 0.39 0.49 China 0.75 0.75 0.72 0.88 USA 0.96 0.9 0.97 0.8 Japan 0.76 0.81 0.76 0.69 Europe 0.97 0.99 0.97 0.87 Brazil 0.79 0.78 0.76 0.91 Russia 0.79 0.79 0.76 0.86 India 0.78 0.75 0.75 0.85 South Africa 0.82 0.82 0.8 0.87 Taiwan 0.79 0.76 0.76 0.85 Korea 0.82 0.79 0.79 0.88
- 5. 5 / 7 Exhibit9: Valuation looks attractivefor A-share’s Blue-chip Companies Source: ChinaAMC, Wind as of Mar31, 2016 The market liberalization is inevitable also irreversible China’s capital market liberalization is already underway regardless of the inclusion. Global investors have already come to the consensus that, China, the world’s second largest economy shall not be the missing piece in their policy portfolio. During the first half of 2016, large institutional investors have readied themselves. Vanguard and Blackrock have received 30 and 20 Billion of RQFII quotas from Australia and Singapore respectively. In June, a RQFII quota of 250 Billion RMB, approximately 50% of the total existing quotas, has been granted to the United States. β or α, InclusionHas Something To Offer For Both Based on the constituent selection methodology of MSCI EM index, it is not difficult to tell that large-cap and blue chip names have the best propensity to be included. For investors seeking β exposure, ChinaAMC’s MSCI China A ETF (512990) and its feeder fund (000975) are the first and only ETF in the domestic market tracking MSCI China A index. It is the ideal instrument for capturing the inclusion opportunity. (Exhibit 10) For investors seeking alternative large cap exposure, ChinaAMC also manages a series of large cap index ETF such as its flagship China50 ETF and CSI 300 ETF. (Exhibit 11) Exhibit10: ChinaAMC MSCI China AETF Source: ChinaAMC
- 6. 6 / 7 Exhibit11: Performanceofmajor ChinaAMC A-share index ETFs 12 Months ending 2016Q1 Ticker Tracking Difference(Daily) Tracking Error (Daily) Tracking Error (Annualized) Excess Return ChinaAMC MSCI China AETF 512990 0.10% 0.10% 1.50% 2.70% ChinaAMC China50ETF 510050 0.04% 0.00% 0.70% 3.20% ChinaAMC 300ETF 510330 0.10% 0.10% 1.20% 2.60% Source: ChinaAMC For investors seeking α, ChinaAMC‘s active equity VPS (Value-Payout-Sustainability) Strategy might just be what they are looking for. This strategy utilizes a quantitative screening to perform an initial scan of the 2800+ names in the A-share market and then applies ChinaAMC’s cutting edge fundamental research capabilities to select the most fundamentally sound names. No doubt, this strategy also takes into account of the propensity to benefit from the inclusion, and hence it is large to mid cap oriented. The portfolio would be a high conviction one, with concentrated holdings. Contrary to most investor’s belief that China A-shares are all about growth, this strategy focuses on value, both from a valuation standpoint and the company’s ability to pay cash dividends. The resulting portfolio offers comparable if not lower valuation (P/E) than the MSCI China A index, but significantly higher dividend yield and earnings growththan that of the index. (Exhibit 12) Exhibit12: ChinaAMC VPS Portfoliohas better dividend and valuationprofilethan theCSI 300 index and MSCIChina Aindex Source: ChinaAMC
- 7. 7 / 7 Disclaimer Important Information This report is intended only for the use of our clients and prospects. Neither this report nor any of its contents may be reproduced or published for any other purpose without the prior written consent of China Asset Management Co. Ltd (“ChinaAMC” ). All the investment strategy illustrated in this report was made on a preliminary basis only, no representation or warranty is made as to the efficacy of any particular strategy or the actual returns that may be achieved. The information in this report reflects prevailing market conditions and our judgment as of this date, which are subject to change. In preparing this report, we have relied upon and assumed without independent verification, the accuracy and completeness of all information available from public sources. We consider the information in this report to be reliable, but we do not represent that it is complete or accurate. ChinaAMC, its affiliates, directors, officers or employees accept no liability for any errors or omissions relating to information available in this report, and will not be liable for any damages or costs arising out of or in any way connected with the use of the information provided in this report. Any information given or representation made by any dealer, salesman or other person and (in either case) not contained herein should be regarded as unauthorized and, accordingly, should not be relied upon. Accordingly, no person receiving a copy of this report in any territory may treat the same as constituting an invitation to him to purchase or subscribe for the participating shares of the Fund nor should he in any event use the Fund’s subscription agreement unless in the relevant jurisdiction such invitation and distribution islawfully made. Contact Information China Asset Management Co. Ltd. 8F, Tower 7, One Yuetan Street South, Xicheng District, Beijing100045, China IB@ChinaAMC.com Tel:+86 10 8806 6688/ Fax:+86 10 8806 6330