

Recomendados
Recomendados
Más contenido relacionado
La actualidad más candente
La actualidad más candente (20)
Destacado
Destacado (14)
Similar a 5 article azojete vol 9 37 50
Similar a 5 article azojete vol 9 37 50 (20)
Más de Oyeniyi Samuel
Más de Oyeniyi Samuel (20)
Último
Último (20)
5 article azojete vol 9 37 50
- 1. Arid Zone Journal of Engineering, Technology and Environment. August, 2013; Vol. 9: 37-50 Copyright© Faculty of Engineering, University of Maiduguri, Nigeria. Print ISSN: 1596-2490, Electronic ISSN: 2545-5818 www.azojete.com.ng 37 ECONOMICS OF A SMALL WIND PUMP SYSTEM BASED ON ESTIMATED PETROL AND DIESEL COST SAVINGS FROM USE IN NORTHERN NIGERIA Ejieji C. J* . and Olayaki-Luqman M. (Department of Agricultural and Biosystems Engineering, University of Ilorin, Ilorin, Nigeria) * Corresponding author’s email addresses: emeka_ejieji@yahoo.com, cjejieji@unilorin.edu.ng Abstract Eleven years of daily wind records were analyzed for the estimation of available wind energy for water pumping at three selected locations in Northern Nigeria, namely Jos, Kano and Sokoto. This formed the basis for investigating the economics of the use of an imported small wind pump under a deregulated energy market environment. The estimated available energy for water pumping at the installation height of 9m was 190 kwh/m2 /yr for Jos, 225 kwh/m2 /yr for Kano and 348 kwh/m2 /yr for Sokoto. The monetary value of the available wind energy was considered as saved energy cost. The saved cost was obtained in terms of the unsubsidized cost of the petrol and diesel that an internal combustion engine (ICE) would consume to produce energy equivalent to the available wind energy. At the prevailing interest and inflation rates of 21.96 % and 12.1% respectively, and unsubsidized prices of N 131.32/l and N 140.23/l for petrol and diesel respectively, investment in the wind pump was not found to be economically competitive relative to using a pump with ICE prime mover at the three locations unless the cost of the pump was subsidized. For Sokoto, the estimated subsidy for initial cost of the wind pump required for the investment to be competitive relative to the use of a pump driven by a petrol ICE was 16%. Relative to a pump driven by a diesel ICE, the required subsidy was 24%. The corresponding subsidy estimates for Kano were 48 % and 51 % respectively. For Jos, it was 56% relative to the use of a pump driven by a petrol ICE and 60 % relative to that driven by a diesel ICE. Considering the potential environmental and social and environmental benefits however, subsidy support by government for local manufacturing of the pumps was recommended since shipping cost and custom tariff constituted over 36% of the initial cost of the wind pump. Keywords: Wind energy, pumps, cost saving, environment, Northern Nigeria 1. Introduction Energy is of fundamental importance to the economic, social, and industrial development of any nation. The amount of energy available and consumed by a nation is an index of its level of economic development (Karakezi and Ranja, 1997). Nigeria is a country that is blessed with abundant energy resources as evident from its large coal, petroleum and gas deposits. There is also great potential in Nigeria for the use of renewable energy such as solar and wind energies (Sambo, 2005). The potentially available solar and wind energies are 1.377×10¹³ MJ per year and 1.5×10¹⁵ MJ per year respectively (Yakubu etal., 1995). The population of Nigeria, about 140 millions according to year 2006 national population census, has an annual growth rate of about 2.5% (Adamu, 2006). With the growing population and tendency for rural-urban migration, the stemming of rural-urban drift could be achieved through the provision of social amenities such as energy and other infrastructural facilities thereby creating employment opportunities in the rural areas. To achieve this would require optimal exploitation of all available sources of energy in order to provide a reliable and adequate power for the industrial and economic development of rural communities. Conventional energy from the national distribution grid and fossil fuels are frequently not easily accessed in rural localities because of costs of provision and associated supply logistics. This is one of the
- 2. Ejieji & Olayaki-Luqman: Economics of small wind pump system based on estimated petrol and diesel cost savings from use in Nigeria. AZOJETE, 9: 37-50, 2013 38 reasons for the overdependence of the rural communities on fuel wood which leads to degradation of the environment. Renewable energy facilities such as wind turbines and wind pumps are attractive in this circumstance due to their ability to be installed in dispersed and isolated communities independent of the national grid network. Wind energy utilization in Nigeria for water pumping dates back to over 70 years (Pedder, 1937). Details of past wind pump installations in various parts of the country have been reported by Lovejoy (1984) and, Ojosu and Salawu, (1990a). The earlier promising attempts at wind energy exploitation were however later abandoned and many of the pumps fell into disuse (Umar, 2000). In addition to lack of sustained institutional support, part of the reason for the dwindled wind energy patronage may be due to subsidies in conventional energy that are not extended to the renewable energy sector. This makes the latter uncompetitive economically (Iloeje, 2004., Ejieji, 2006). There is currently a sustained effort by the Federal Government of Nigeria to deregulate the energy sector including the downstream sector of the oil industry. The deregulation, with the complete withdrawal of subsidies, would subject the local pricing of petroleum products to the vagaries of international market forces. In view of the emerging post-deregulation scenario therefore, it is necessary to evaluate the potentials of renewable energy and the relative economics of the conversion systems for areas of the country with good prospects for renewable energy exploitation. The Sudan Savannah and Plateau zones of Nigeria correspond to the areas described by Ojosu and Salawu (1990b) as having good potentials for wind energy exploitation for water pumping and electricity generation. The aim of this study was to evaluate the economics of a small wind pump system for powering water pumping operation relative to petrol and diesel fuelled engines. Its objective is to determine whether investment in such a wind pump system would be attractive vis-à-vis the use of a pump having a conventional internal combustion engine (ICE) as prime mover. 2. Materials and method 2.1 Theoretical considerations The specific power of wind at a site expressed in W/m2 of the area swept by the rotating blades of a wind driven device such as a windmill is given by (Patel, 1999) Ps = ½ ρV3 (1) where Ps is the specific power (W/m2 ), ρ is density of the air (kg/m3 ) and V is the wind speed (m/s). The specific power is also referred to as the power density and is the power in the upstream wind. It is an indicator of the wind energy potential of a site useful in the comparison of wind energy availability of stations. In order to account for the variation of air mass density, the following relation has been proposed for discretizing the estimation of the annual average power density (Patel, 1999) Prc = n 1i 3 ii2n 1 Vρ (2)
- 3. Ejieji & Olayaki-Luqman: Economics of small wind pump system based on estimated petrol and diesel cost savings from use in Nigeria. AZOJETE, 9: 37-50, 2013 39 where Prc is the average power density, ρi is the air mass density at the i-th observation time and n is the number of observations in the averaging period. Air density can be estimated as follows (Linsley et al., 1975): ρ = e 0.3781 RT (3) where is the atmospheric pressure (kPa), R is the gas constant (0.287KJ/kg K), T is the air temperature (K) and e is the vapour pressure (kPa) which is related to the saturation vapour pressure and relative humidity by the expression e = 100se f (4) where es is the saturation vapour pressure (kPa) and f is the relative humidity (%). The following relations have been given for es (Murray, 1967) es = 237.3T 17.27T a a 0.6108exp (5) where Ta is the air temperature (o C). The power extracted from the wind by a wind turbine or a wind pump is dependent on the rotor efficiency (Heronemus, 1981). The fraction of the upstream wind power actually captured by the rotor blades, also known as the power coefficient, has a theoretical maximum value of 0.59 (Betz, 1928; as cited by Heronemus, 1981). The useful energy obtainable over a time period from a wind pump or turbine is influenced by the unsteady nature of wind speed (Patel, 1999). Therefore the energy per area swept by the rotor blades could be estimated using the following equation. Es = i n 1i 3 ii2n 1 tVρ A (6) where Es is the useful energy (J), A is the cross sectional area swept by the blades (m2 ), is the overall efficiency of the turbine or wind pump, is the power coefficient, ti is the time duration (s) of the interval i over which the wind speed was observed and n is the number of discrete intervals in the period. All other terms in Equation 6 are as previously defined. A measure of the appropriateness of investing in a renewable energy conversion machine would be how much income or cost savings it would generate within the service life to profitably and timely recover the initial investment. An analytical approach which was suggested by Ezeike (1985) is the payback time in the presence of inflation. It was based on the net present value (NPV) (Hawkins and Pearce, 1971) given by Ezeike (1985) as NPV = L ST r r1 1 ri r1 CC i (7) where CT is the cost of initial investment, CS is the annual energy cost savings in place of using conventional energy, r is the inflation rate, i is the interest rate and L is the service life
- 4. Ejieji & Olayaki-Luqman: Economics of small wind pump system based on estimated petrol and diesel cost savings from use in Nigeria. AZOJETE, 9: 37-50, 2013 40 of the machine in years. For the investment to be considered economically desirable, NPV must be positive i.e. R F (8a) where R is the ratio of the initial investment cost to the annual cost savings and F is the present worth factor of annual cost savings in the life of the machine considering inflation and interest. R is given by S T C C R (8b) and F by L ri r1 1 ri r1 F (8c) The computation of F is as follows (Ezeike , 1985) ri riL F , ri r1 1 ri r1 , L (9) The useful energy production of the wind pump is the portion of converted wind energy available for the lifting of water. The monetary value could be regarded as saved energy cost which would have been incurred if another energy source was used in powering the pump. In the context of this study, the useful energy production of the wind pump was valued in terms of cost of the fuel which an internal combustion engine (ICE) would consume to deliver the useful energy equivalent to that of the wind pump. The amount of fuel required by an ICE to deliver useful shaft power depends on its overall efficiency which increases with the rating. Based on the lower heating value i.e. the net calorific value (NCV), Evans et al. (1986) suggested the use of efficiency values ranging from 28% to 38% for the estimation of fuel consumption of diesel engines that have ratings between 63kW to 346kw. According to Yates (2002) however, the overall efficiency of ICEs considering a combination of the thermal and mechanical efficiencies ranges from 24.4% to 32.0%. The valuing of the useful energy of the wind pump in relation to petrol or diesel consumption of an ICE that would deliver the equivalent useful energy for shaft work could therefore be as follows CηC E E L IC W V f (10) where EV is the value of energy (N), EW is the available useful wind energy for water pumping (MJ/yr), Cf is the net calorific value of fuel (MJ/L), CL is the price of fuel (N/litre) and IC is the overall efficiency of the ICE considering its thermal and mechanical efficiencies. The Ev computed was considered to be the energy cost saving per year in place of using conventional energy.
- 5. Ejieji & Olayaki-Luqman: Economics of small wind pump system based on estimated petrol and diesel cost savings from use in Nigeria. AZOJETE, 9: 37-50, 2013 41 2.2 Locations of the study The locations of the study are in Sudan Savanna and Plateau zones of Nigeria. Kano and Sokoto were chosen as the representative stations for the Sudan Savanna zone while Jos was chosen for the Plateau zone. The Sudan Savanna vegetative zone of Nigeria corresponds to the tropical continental zone described by Iloeje (1976). The annual rainfall is between 500 mm and 1000 mm in the wet season that lasts from May to September. The relative humidity is always low, between 20% and 40% in January, rising to between 60% and 80% in July. The mean annual temperature is 27 o C. The Plateau vegetative zone corresponds to the high plateau described by Fapohunda (2001). The annual rainfall is 1400 mm. The mean monthly temperature ranges from 20 o C in August to 25 o C in April. 2.3 Data collection and analysis Meteorological data for all the stations were all obtained from the Nigeria Meteorological Agency, Oshodi, Lagos. These consisted of eleven years (1980 – 1990) of daily records of wind speed (knots), atmospheric pressure (HPa), air temperature (o C), and relative humidity (%) at three hourly intervals of 0, 3, 6, 9, 12, 15, 18 and 21 hours GMT. The data were obtained in hard copies and processed into electronic data files on the computer. Equation (2) was used to compute the average annual and monthly power densities. The wind speed data were grouped into classes having widths of 0.514 m/s for all but the first class which had a lower boundary of 0.0 and class width of 0.257 m/s. The number of class boundaries for each station was such that adequately covered the observed range of wind speeds. The class delineation scheme was necessitated by the fact that the wind speeds were measured in knots and recorded to the nearest knot (1knot = 0.514m/s). The observed values of wind speed in the first class were essentially 0.0m/s hence the assignment of a relatively narrow width to this class. The number of times the observed wind speed occurred in each class divided by the total number of historical data yielded the relative frequency of the class which was taken as the estimated probability of occurrence. In addition, each Vi was assigned to the appropriate class of wind speeds and the product 3 ii V½ρ computed. The sum of the products for each class divided by the cumulated sums of the products from all the classes yielded the relative contribution of the class to energy production. In analyzing the relative contribution of the various classes of wind speed to annual average energy production, the annual average energy (kWh/m2 ) was first estimated from the product of annual average power density and 1000th of the number of hours in the year (that is 8.76h). The annual average energy was then partitioned to the wind speed classes in proportion of their estimated relative contributions to energy production. In order to undertake the above analysis at the installation height of the wind pump, the wind speed at the installation height was estimated from the wind speed at the station’s anemometer level (i.e. the height of measurement of historical data) by the application of the power law relationship (Musgrave, 1987). A friction factor of 0.20 was used as the exponent representing the average of the values suggested by Patel (1999). To estimate the average annual available energy (kWh/m2 /yr) for water pumping using Equation (7), the duration of each wind class Ti was taken as the product of its relative frequency and the number of hours in the year. The contributions of wind speeds from 0 to 2.056 m/s (i.e. 0 to 4 knots) were not considered
- 6. Ejieji & Olayaki-Luqman: Economics of small wind pump system based on estimated petrol and diesel cost savings from use in Nigeria. AZOJETE, 9: 37-50, 2013 42 because wind speeds in that range were less than the break-in wind speed for water pumping. The power coefficient was taken as 0.59 while the overall efficiency was assumed to be 0.40. The small wind pump system adopted for this study was the Poldaw wind pump manufactured by Villiers Aqua Engineering, South Africa (Villiers Aqua Engineering, 2009) under license from Neale Consulting Engineers Limited (NCEL), UK. It possessed attractive features for small-scale application which include a multi blade rotor and a simple direct drive reciprocating mechanism for low cost and high reliability. According to the manufacturers, the aerodynamics is tailored to produce high torque at low speed. The design was also intended to achieve low maintenance requirements essentially limited to greasing of bearings and other components once per year. Full description of the pumps can be found at http://www.poldawwindpumps.co.za. The Poldaw pumps are designed to operate in wind speeds as low as 3 m/s or less at installation height of 9m. The manufacturer provided the 24h discharge capacities of the pump at average wind speeds of 3m/s and 4m/s for a range of total pumping heads. The information was used to estimate the overall efficiency, , of the pump at the given total pumping heads under the two average wind speeds. Overall efficiency was estimated as the fraction of theoretical maximum convertible wind energy which was productively expended in lifting water in a 24h period. The theoretical maximum convertible wind energy was estimated using Equation (6) with n = 1, = 1, = 0.59, T = 24 × 3600s and Vi = 3 ms-1 or 4 ms-1 . Average air density of 1.142 kg/m3 estimated for region of study was # used. The productively expended energy was estimated as the net energy used in the lifting of water in the 24h period as follows gQHTρE wu (11) where Eu is the net expended energy for pumping water (J), ρw is density of water (1000 kg/m3 ), g is acceleration due to gravity (9.81m/s2 ), Q is the average 24h discharge rate (m3 /s), H is the total pumping head (m) and T is 24 × 3600s. The components of the initial investment cost of the pump considered were the factory price, shipping freight charge, custom tariff; value added tax (VAT), road haulage cost from Lagos port to location and installation cost. The factory cost in South African Rands and volume of freight were obtained from the manufacturers. The factory cost was converted to Naira at the rate of one Rand to 22.12 Naira. The sea freight rate was estimated from African Seafreight (2011). The prevailing rate of VAT of 5% was assumed while the custom tariff was taken to be 5% i.e. the rate for pumps as given by the Nigerian Custom Administration (2011). The road haulage distance from Lagos to each of the stations was obtained (http://www.placesonline.com/africa/nigeria/map.asp) and 200km added to account for possible haulage from the station to surrounding locations. The road haulage rate was obtained from data provided by Ogunsanya (2006) adjusted to year 2011 by the application of yearly consumer price index for the transportation sector (National Bureau of Statistics, 2011). The installation cost was estimated as 10% of the factory price. In the application of Equation (10), NCV of petrol and diesel were taken to be 32.7 MJ/l and 37.1 MJ/l respectively. They were estimated from the averages of the ranges of values of NCV (kJ/kg) obtained from International Energy Agency (2004) by conversion to MJ/l using
- 7. Ejieji & Olayaki-Luqman: Economics of small wind pump system based on estimated petrol and diesel cost savings from use in Nigeria. AZOJETE, 9: 37-50, 2013 43 averages of the specific gravities of petrol and diesel oils for oil industry conversions (http://www.eppo.go.th/ref/UNIT-OIL.html). The unsubsidized prices of petrol and diesel given respectively as N 131.32 /l and N 140.23 /l by Petroleum Products Pricing Regulating Agency (2011) for February 2011 were also used. For the estimation of NPV, the average maximum lending interest rate of 21.96% for general commerce (Central Bank of Nigeria, 2011a) was used. The inflation rate was taken to be 12.1% (Central Bank of Nigeria, 2011b). 3. Results and discussion The locations and elevations of the stations are presented in Table 1 along with the anemometer heights and periods of record considered in this study. The average monthly and annual wind power densities and ratio of day-time to night-time wind speeds at the stations are presented in Table 2. The ratios of the day-time to night-time wind speed were generally greater than unity indicating that more wind energy would be available during the day than in the night. The months June to September correspond to the rainy reason period in the areas studied and have lower wind power densities than the drier periods of October through December to April. This is fortuitous in that the drier periods had greater wind energy availability for water pumping. In a related study at a more southerly location in northern Nigeria, Ejieji (2006) also found the wind speeds to be higher during day-time than night-time hours. However, the wind power densities were higher during the rainy than the dry season at the location. The wind speed distributions are similar at all the locations (Figure 1). The exceedence probabilities for wind speeds greater than or equal to the break-in wind speed of 2.5 m/s as estimated from the cumulative relative frequencies were 0.769, 0.719 and 0.676 for Jos, Kano and Sokoto respectively. This implies that the storage capacities to be provided for the water requirements of a given period must be scaled up by factors of 1.30, 1.39 and 1.45 at Jos, Kano and Sokoto respectively in order to provide for the calm periods of wind activity. The modal wind speed at all the stations was 5.14 m/s with relative frequencies of 0.144, 0.109 and 0.114 at Jos, Kano and Sokoto respectively. The relative contribution of the modal wind speed to annual energy production at Jos, Kano and Sokoto was 11.08%, 8.34 and 7.16% respectively. The characteristics of the pumps are summarized in Tables 3 and 4. The overall efficiency, , estimated with Equation (6) and Table 4 data decreased with total pumping head and wind speed. It ranged from 0.233 to 0.292 at average wind speed of 3 m/s. At 4 m/s, it ranged from 0.181 to 0.246. The average for the two wind conditions was 0.249. This implies that the - value of 0.40 adopted for the estimation of available wind power may be overgenerous with respect to the Poldaw wind pump. It should however be noted the of the Poldaw wind pump might be higher than estimated because probable head losses in suction and delivery lines were not considered in the estimation.
- 8. Ejieji & Olayaki-Luqman: Economics of small wind pump system based on estimated petrol and diesel cost savings from use in Nigeria. AZOJETE, 9: 37-50, 2013 44 Table 1 Details of stations used for the study Station Anemometer Height (m) Latitude (o N) Longitude ( o E) Elevation (m) Period of data Jos 10.64 9.87 8.88 1285.58 1980 – 1990 Kano 7.60 12.05 8.53 472.14 1980 – 1990 Sokoto 5.47 13.02 5.25 350.75 1980 – 1990 Table 2 Average monthly and annual wind power densities and ratio of day-time to night-time wind speeds. Data relate to wind speeds measured at the anemometer heights of the stations Station Average Power density (W/ m2 ) Ratio of day-time to night-time wind speeds Month Jos Kano Sokoto Jos Kano Sokoto Jan. 147.16 127.73 187.39 1.47 1.78 1.59 Feb. 128.10 105.34 209.80 1.60 1.67 1.76 Mar. 95.26 143.93 124.32 1.59 1.86 1.79 Apr. 106.60 100.66 111.86 1.58 1.59 2.13 May 92.90 115.93 143.27 1.27 1.10 1.33 Jun. 87.42 141.77 143.31 1.29 1.09 1.09 Jul. 79.69 95.18 111.21 1.34 1.32 1.45 Aug. 65.83 65.97 63.98 1.43 1.36 1.52 Sept. 69.69 54.05 57.19 1.54 1.11 1.29 Oct. 104.17 58.38 59.64 2.40 1.98 1.89 Nov 129.28 81.93 110.43 2.22 2.04 1.78 Dec. 111.46 95.15 164.03 1.60 2.01 1.69 Annual 101.26 97.96 121.49 1.61 1.56 1.61
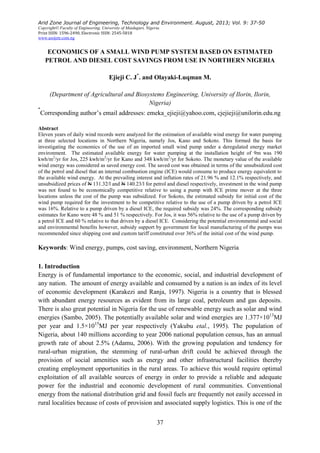
- 9. Ejieji & Olayaki-Luqman: Economics of small wind pump system based on estimated petrol and diesel cost savings from use in Nigeria. AZOJETE, 9: 37-50, 2013 45 0 0.1 0.2 0.3 0.4 0.5 0.6 0.7 0.8 0.9 1 0 2 4 6 8 10 12 14 16 18 20 22 24 26 28 Wind speed (m/s) Cumulativerelativefrequency Kano Sokoto Jos Figure 1: Distribution of wind speeds observed at 3-hourly intervals at the stations. The available energy for water pumping at the installation height of 9 m (i.e. assuming a - value of 0.40) was 190 kwh/m2 /year at Jos. At Kano and Sokoto it was 225 kwh/m2 /year and 348 kwh/m2 /year respectively. The estimation of the initial cost of the pump is illustrated in Table 5 while details of the valuation of the available energy for water pumping and estimation of the ratio of the initial investment cost to the annual energy cost savings (R) are presented in Table 6. Table 3 Specifications of the 3.5 m Poldaw wind pump Feature Value Number of blades 12 Tower height (m) 9 Typical rotor Speed (rpm) 40 to 80 Starting wind Speed (m/s) 2.5 Survival wind Speed (m/s) 50 Service life (years) 20 Source: http://.www.Tribology.co.uk/Poldaw.htm.
- 10. Ejieji & Olayaki-Luqman: Economics of small wind pump system based on estimated petrol and diesel cost savings from use in Nigeria. AZOJETE, 9: 37-50, 2013 46 Table 4 Approximate outputs of the 3.5m Poldaw wind pump per 24 hours at two average wind speeds under various total pumping heads Total pumping head (m) Discharge per 24 hours (l) Light wind (3 ms) Medium wind (4 ms) 5 45000 90000 10 22000 45000 15 15000 29000 25 9000 16000 30 7000 13000 45 4700 8000 60 3000 5500 Source: http://.www.Tribology.co.uk/Poldaw.htm. Table 5 Estimation of the initial cost of the pump for Jos station Cost component Unit Cost per unit (N) Quantity Total Cost (N) Factory price Naira 1071882.09 1.00 1071882.09 Custom Tariff Naira 0.05 Factory price 53594.10 Value added tax Naira 0.05 Factory price 53594.10 Shipping N/m3 198287.70 3.39 672195.30 Road haulage tonne-km 7.35 1x1232* 9055.20 Installation Naira 0.10 Factory price 107188.21 Total initial cost Naira 1967509.01 * Distance shown is for Jos. Corresponding values for Kano and Sokoto are 1219km and 1172 km respectively. The total initial costs for Kano and Sokoto are N 1967413.46 and N 1967068.01 respectively.
- 11. Ejieji & Olayaki-Luqman: Economics of small wind pump system based on estimated petrol and diesel cost savings from use in Nigeria. AZOJETE, 9: 37-50, 2013 47 Table 6 Valuation of the annual available energy for water pumping and estimation of the ratio of the initial investment cost to the annual energy cost savings (R) for the three stations Station Available wind energy (kWh/yr) Petrol equivalent of available wind energy (litres/yr) Diesel equivalent of available wind energy (litres/yr) Naira equivalent of Petrol Naira Equivalent of Diesel Values of R Petrol Diesel Jos 1826.52 718.16 632.99 94308.76 88763.81 20.86 22.17 Kano 2163.23 850.55 749.68 111694.11 105126.98 17.61 18.71 Sokoto 3342.85 1314.36 1314.36 172601.47 162453.24 11.40 12.14 At the prevailing interest rate of 21.96 % and inflation rate of 12.1%, the computed F was 9.26. This showed that the NPV of the wind pump was negative at all the stations despite the generous -value used to estimate available wind energy for water pumping. It implies that investment in the wind pump may not be a good proposition based on purely financial considerations. The outcome is least adverse for Sokoto and worst for Jos. A further analysis of the results for Sokoto showed that in the prevailing inflation and interest rate regimes and under a deregulated energy market, the initial cost of the wind pump would need to be subsidized by about 16 % for it to be more attractive than using a petrol engine powered pump and by about 24% for it to be preferred to a diesel engine powered pump. For Kano the corresponding levels subsidy were about 48% and 51% respectively. For Jos, they were about 56% and 60% respectively for preference of the wind pump to petrol and diesel ICE-powered pump. Shipping cost and custom tariff constituted, on the average, more than 36% of the total initial cost of the wind pump. Local manufacturing of the wind pump would therefore improve its economic competitiveness provided the materials are sourced locally and the manufacturing infrastructure is efficient. 4. Conclusions It could be concluded from this study that at the prevailing interest rate and inflation regimes, and under a deregulated energy market environment, the use of the imported small wind pump would not be economically competitive compared to pumps powered by petrol and diesel ICEs. This conclusion is however based on financial considerations alone. The environmental benefits and social benefits from improved levels of rural economic enterprise, health and sanitation that would result from using wind pump for water provision to isolated communities have not been considered. In view of the potential environmental and social benefits, subsidy support by government for local production of the wind pump is recommended since shipping cost and custom tariff constituted more than 36% of the total initial cost of the wind pump.
- 12. Ejieji & Olayaki-Luqman: Economics of small wind pump system based on estimated petrol and diesel cost savings from use in Nigeria. AZOJETE, 9: 37-50, 2013 48 References Adamu, K. 2006. Summary of 2006 Census. Federal Republic of Nigeria 2006 Population Census.National Bureau of Statistics. http://www.nigerianstat.gov.ng/Connections/Pop2006.Pdf. African Seafreight. 2009. Nigeria Seafreight rates for Personal Goods. http://www.shipping_overseas.com/Africa.html. Central Bank of Nigeria. 2011a. Average deposit and lending rates as at 4th February, 2011. The Punch Newspaper. Punch Nigeria Limited, Ikeja, Lagos. February, 9, 2011. Central Bank of Nigeria. 2011b. Data and Statistics. http://www.cenbank.org/rates/inflrates.asp Ejieji, CJ. 2006. An evaluation of wind energy potentials in Ilorin, Kwara State of Nigeria. Ife Journal of Technology, 15(2): 27-35. Evans, FL., Olson, CR., Steen-Johnsen, H., Swearingen, JSS. and Jenett, E. 1986. Process machinery drives. In: Perry, RH., Green, DW and Maloney, JO. (eds) Perry’s Chemical Engineers’ Handbook, 6th edition, pp. 24.14 – 24.35. McGraw Hill Book Company, NewYork. Ezeike, GOI. 1985. Economic Analysis of a Solar Dryer System. Paper Presented at the 1985 National Conference of the Nigerian Society of Agricultural Engineers. Concorde Hotel Owerri, 3-6 September 1985. Fapohunda, HO. 2001. Comparison of Potential Evapotranspiration Calculation methods in a Tropical Region. Journal of Agricultural Engineering and Technology, 9: 20-31. Hawkins, COJ. and Pearce, D. 1971. Capital Investment Appraisal. MacMillan, London. International Energy Agency. 2004. Net calorific values. Energy statistics working group meeting, Special Issue Paper 8, http://www.iea.org/work/2004/eswg/21_ncv.pdf Heronemus, W. 1981. Wind power. In: Parker, S. P. (Ed.) Encyclopedia of Energy, 2nd Edition, pp. 787 – 789, McGraw Hill Book Company, New York. Karakezi, S. and Ranja, T. 1997. Renewable Energy Technologies in Africa. Zed Books Ltd, London. Iloeje, NP. 1976. A New Geography of Nigeria. Longman Limited, Nigeria.
- 13. Ejieji & Olayaki-Luqman: Economics of small wind pump system based on estimated petrol and diesel cost savings from use in Nigeria. AZOJETE, 9: 37-50, 2013 49 Iloeje, OC. 2004. Overview of renewable energy in Nigeria, opportunity for rural development of a renewable energy master plan. Paper presented at the renewable energy conference, Energetic Solution Abuja / Calabar, 21-26 November 2004. Lovejoy, D. 1984. Mission report on Nigeria Programme on Demonstration of Solar and Wind Energy in Northern Nigeria, 8-9 September, 1984. United Nations Dept. of Technical Cooperation and Development (UNDTCD) / United Nations Development Programme (UNDP), New York, 1984. Linsley, RK., Kohler, MA. and Paulhus, JLH. 1975. Hydrology for Engineers, McGraw- Hill/Kogakusha Ltd., Tokyo. Mugrave, PJ. 1987. Wind energy conversion: recent progress and future prospects. Solar and Wind Technology, 4: 37 – 49. Murray, FW. 1967. On the calculation of saturation vapor pressure. Journal of Applied Meteorology, 6(1): 203 – 204. National Bureau of Statistics 2010. Statistical news (Price Statistics). National Bureau of Statistics, Abuja, Nigeria. No 474, April 16, 2010. Nigeria Customs Administration 2011. Nigeria Customs Services. http://www.customs.gov.ng/Statutory/management_act.php Ogunsanya, AA. 2006. Road freight transport in Nigeria. Research Report. Department of Geography, University of Ilorin, Ilorin, Nigeria. Ojosu, JO. and Salawu, RI. 1990a. Wind energy development in Nigeria. Nigeria Journal of Solar Energy, 9: 209-222. Ojosu, JO. and Salawu, RI. 1990b. A survey of wind energy potential in Nigeria. Solar and Wind Technology, 7: 155 – 167. Patel, MR. 1999. Wind and Solar Power Systems. C.R.C.Press LLC, Boca Raton, Florida, USA. Pedder, JB. 1937. Windmills for pumping in Nigeria. Government Printer, Lagos, 1937. Petroleum Products Pricing Regulating Agency 2011. Products Pricing Templates Explanatory Note. http://.www. pppra-nigeria.org/pricing template_asp Sambo, AS. 2005. Renewable energy for rural development : The Nigerian perspective. ISESCO Science and Technology Vision, 1:12 – 22.
- 14. Ejieji & Olayaki-Luqman: Economics of small wind pump system based on estimated petrol and diesel cost savings from use in Nigeria. AZOJETE, 9: 37-50, 2013 50 Umar, IH. 2000. The potentials of renewable energy in national development. Proceedings of the Nigerian Institution of Agricultural Engineers, 22; 2 – 7. Villiers Aqua Engineering, South Africa 2009. Poldaw Windpump Information Sheet. http://. www. Poldawwindpump. co.za/product list.html. Yakubu, NA., Mummah, SN. and Adedayo, EA. 1995. A Sustainable Energy Policy for Nigeria Challenge and Future Prospects. Nigerian Journal of Solar Energy, 13:118-123. Yates, Z. 2002. The efficiency of the internal combustion engine. http://ffden- 2.phys.uaf.edu/102spring2002_web_projects/z.yates/zach%27s%20web%20project%20folder /eice%20-%20main.htm