Diva-Thane European Call Girls Number-9833754194-Diva Busty Professional Call...
Weekly Market Report
1. 9,757.11
9,700
9,733.19
50,00,000
9,669.69
9,643.50
9,500
0
27-Oct
28-Oct
29-Oct
30-Oct
Volume
Week ended
Oct 31, 2013
1,452.1
5,33,105.7
522,486.1
2.0
34.2
2.1
15,267
15,235
0.2
41
42
(2.4)
29:11
Value Traded (QR mn)
Week ended
Oct 24, 2013
1,502.1
34.9
Market Indicators
18:23
–
Exch. Market Cap. (QR mn)
Volume (mn)
Number of Transactions
Companies Traded
Market Breadth
Market Indices
Close
Total Return
14,055.51
All Share Index
2,466.67
Banks/Financial Svcs.
2,337.58
Industrials
3,220.11
Transportation
1,830.07
Real Estate
1,823.05
Insurance
2,331.58
Telecoms
1,438.50
Consumer
5,891.43
Al Rayan Islamic Index
2,813.42
Market Indices
Weekly Index Performance
WTD%
1.9
1.8
1.8
3.1
1.4
1.0
0.3
0.7
0.4
1.1
MTD%
2.4
2.0
(0.1)
5.5
3.3
4.4
4.4
(0.4)
0.3
2.0
0.4%
Close
Qatar (QE)*
Dubai
Abu Dhabi
Saudi Arabia
Kuwait
Oman
Bahrain
9,837.49
2,922.18
3,845.72
8,044.47
7,946.39
6,674.07
1,201.79
WTD%
MTD%
YTD%
1.9
0.4
(0.9)
(1.5)
(0.1)
0.1
(0.1)
2.4
5.8
0.1
1.0
2.3
0.4
0.7
17.7
80.1
46.2
18.3
33.9
15.9
12.8
(3.3)
YTD%
24.2
22.4
19.9
22.6
36.5
13.1
18.7
35.1
26.1
13.1
0.1%
(1.0%)
(0.1%) (0.1%)
Weekly Exchange
Traded Value ($ mn)
357.37
854.04
454.28
6,088.00
580.81
105.43
7.74
Exchange Mkt.
Cap. ($ mn)
1,46,444.1
70,176.16
1,11,348.1
429,656.8#
1,10,906.7
23,775.6
16,923.3
Kuwait
Saudi Arabia
(0.9%) (1.5%)
(3.5%)
Foreign institutions turned bullish for the week with net buying of
QR85.4mn vs. net selling of QR40.9mn in the prior week. Qatari
institutions turned bullish with net buying of QR46.8mn vs. net selling of
QR70.9mn the week before.
Regional Indices
Chg. %
1.9%
1.5%
Abu Dhabi
4.0%
31-Oct
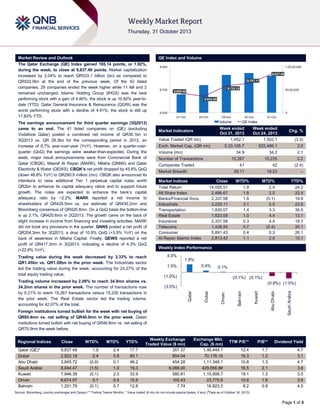
QE Index
Bahrain
Trading volume increased by 2.06% to reach 34.9mn shares vs.
34.2mn shares in the prior week. The number of transactions rose
by 0.21% to reach 15,267 transactions versus 15,235 transactions in
the prior week. The Real Estate sector led the trading volume,
accounting for 42.07% of the total.
1,00,00,000
9,837.49
Oman
Trading value during the week decreased by 3.33% to reach
QR1.45bn vs. QR1.50bn in the prior week. The Industrials sector
led the trading value during the week, accounting for 23.27% of the
total equity trading value.
9,900
Dubai
The earnings announcement for third quarter earnings (3Q2013)
came to an end. The 41 listed companies on (QE) (excluding
Vodafone Qatar) posted a combined net income of QR30.1bn in
3Q2013 vs. QR 28.3bn for the corresponding period in 2012, an
increase of 6.7% year-over-year (YoY). However, on a quarter-overquarter (QoQ) the earnings were weaker-than-expected. During the
week, major result announcements were from Commercial Bank of
Qatar (CBQK), Masraf Al Rayan (MARK), Milaha (QNNS) and Qatar
Electricity & Water (QEWS). CBQK’s net profit dropped by 45.8% QoQ
(down 48.8% YoY) to QR280.9 million (mn). CBQK also announced its
intentions to raise additional Tier 1 perpetual capital notes worth
QR2bn to enhance its capital adequacy ratios and to support future
growth. The notes are expected to enhance the bank‟s capital
adequacy ratio by ~2.2%. MARK reported a net income to
shareholders of QR429.5mn vs. our estimate of QR430.2mn and
Bloomberg consensus of QR420.8mn. On a QoQ basis the bottom-line
is up 2.1%, QR420.6mn in 2Q2013. The growth came on the back of
slight increase in income from financing and investing activities. MARK
did not book any provisions in the quarter. QNNS posted a net profit of
QR204.3mn for 3Q2013, a drop of 10.9% QoQ (+3.9% YoY) on the
back of weakness in Milaha Capital. Finally, QEWS reported a net
profit of QR417.3mn in 3Q2013, indicating a decline of 4.3% QoQ
(+22.8% YoY).
QE Index and Volume
Qatar
Market Review and Outlook
The Qatar Exchange (QE) Index gained 185.14 points, or 1.92%,
during the week, to close at 9,837.49 points. Market capitalization
increased by 2.04% to reach QR533.1 billion (bn) as compared to
QR522.5bn at the end of the previous week. Of the 42 listed
companies, 29 companies ended the week higher while 11 fell and 2
remained unchanged. Islamic Holding Group (IHGS) was the best
performing stock with a gain of 4.46%; the stock is up 10.92% year-todate (YTD). Qatar General Insurance & Reinsurance (QGRI) was the
worst performing stock with a decline of 4.91%; the stock is still up
17.83% YTD.
TTM P/E**
P/B**
Dividend Yield
12.4
16.3
10.8
16.5
19.1
10.8
8.2
1.7
1.2
1.3
2.1
1.3
1.6
0.8
4.7
3.1
4.7
3.6
3.5
3.9
4.0
#
Source: Bloomberg, country exchanges and Zawya (** Trailing Twelve Months; * Value traded ($ mn) do not include special trades, if any) ( Data as of October 30, 2013)
Page 1 of 5
2. News
Market & Corporate News
QEWS net profit declines 4.3% QoQ in 3Q2013 – Qatar
Electricity & Water Company (QEWS) reported a net profit of
QR417.3mn in 3Q2013, indicating a decline of 4.3% QoQ
(+22.8% YoY). Bloomberg consensus for net income was
QR402.3mn. Basic earnings per share amounted to QR10.54
for the nine months period ended on September 30, 2013 as
compared to QR9.76 for the corresponding period in 2012. The
company's sales rose by 2.8% QoQ (+4.6% YoY) to
QR806.4mn. We maintain our annual estimates. For 2013 and
2014 revenue, we pencil in QR2,856mn and QR2,903mn,
respectively. Our 2013 and 2014 EPS estimates are QR13.61
and QR14.44, respectively. Low-risk play deeply linked to
Qatar‟s growth story. Despite a lack of significant near-tomedium-term growth catalysts, we continue to remain bullish
longer term on QEWS. The company is Qatar‟s leading listed
electricity/desalinated water producer and possesses a low-risk
business model (minimal demand/cost risk), with secure and
visible earnings and cash flows.
MARK 3Q2013 net income in-line with estimates – Masraf Al
Rayan (MARK) reported a net income to shareholders of
QR429.5mn vs. our estimate of QR430.2mn and Bloomberg
consensus of QR420.8mn. On a QoQ basis the bottom-line is
up 2.1%, QR420.6mn in 2Q2013. The growth came on the back
of slight increase in income from financing and investing
activities. MARK did not book any provisions in the quarter.
Income from financing activities increased by 1.7% QoQ, while
profit to investment account holders increased by 3.3%. Hence,
net financing income only improved by 1.2% QoQ. On the other
hand, income from investing activities grew by 5.3% QoQ
helping the bottom-line grow by 2.1% QoQ. Regional expansion
is on the cards. MARK has expressed its intention to buy a 40%
stake in a Libyan bank. The acquisition will cost around QR1bn
and is in line with our view that the bank will diversify within the
MENA region for long-term growth potential. However, post the
announcement there has been no significant update on this
front. We maintain our FY2013 estimates and price target to
QR27.60. We expect public sector loans to pick up in coming
months. This, along with relatively tight lid on deposits rates,
will help MARK to post a net profit of QR1.67bn in FY2013. On
the DPS front, we maintain our cash DPS forecast of QR1.10
and 1.20 for 2013 and 2014, respectively. (QNBFS Research,
QE)
CBQK profit down 45.8% QoQ in 3Q2013 – Commercial Bank
of Qatar‟s (CBQK) net profit dropped by 45.8% QoQ (-48.8%
YoY) to QR280.9mn. Net interest income expanded by 39.8%
QoQ (+39.1% YoY) to QR642.8mn, while net fee and
commission income declined by 12.4% QoQ (+8.0% YoY) to
QR144.5mn. Total loans and advances stood at QR64.9bn at
the end of Q3 2013, up 33.5% YTD, while customer deposits
rose 39.4% YTD to QR57.7bn. As such the LDR stood at
112.4%. (QE)
CBQK intends to raise QR2bn Tier 1 perpetual capital notes
– The Commercial Bank of Qatar (CBQK) intends to raise
additional Tier 1 perpetual capital notes worth QR2bn to
enhance its capital adequacy ratios and to support future
growth. The notes are expected to enhance the bank‟s capital
adequacy ratio by ~2.2%. This proposed issue will be a local
private placement that is expected to be completed in December
2013. (Company Press Release)
Ooredoo earns QR2.07bn net profit on NGN, affiliates’ gain
– Growing demand for new products in next generation
networks (NGN) and impressive performances of group
companies in Qatar, Algeria and Iraq have enabled Ooredoo
Group to post a nine-month net profit of QR2.07bn and revenue
of QR25.7bn. The net profit attributable to Ooredoo‟s
shareholders represented a 4% YoY decrease, but that includes
foreign exchange losses primarily from Indosat (Indonesia).
Excluding this, the net profit to shareholders stood at the same
level as in 3Q2012 and increased by 12% for the nine months in
2013. Meanwhile, as of September 30, the group‟s consolidated
customer base stood at 89.6mn subscribers compared with
89.2mn in the same period last year, representing 0.4% YoY
growth. In September 2013, Ooredoo‟s customer base in Qatar
stood at 2.8mn as compared to 2.4mn in the same period in
2012. (Gulf-Times.com)
BRES reports net profit of QR268.3mn in 3Q2013 – Barwa
Real Estate Company (BRES) reported a net profit of
QR268.3mn in 3Q2013 as compared to QR40.6mn in 2Q2013
(up 44.7% YoY). Total revenues and gains rose by 56.9% QoQ
(+19.8% YoY) to QR571.3mn in 3Q2013. EPS amounted to
QR1.20 for the nine months ended September 30, 2013 as
compared to QR2.00 for the corresponding period in 2012.
(QE)
WDAM reports QR47.2mn net profit in 9M2013 – Widam
Food Company (WDAM) posted net profit of QR47.2 million for
the nine months period ended September 30, 2013 vs. a net
profit of QR62.1 million for the corresponding period last year.
The company‟s Earnings per Share (EPS) amounted to QR2.63
for the period ended September 30, 2013 versus QR3.45 for the
corresponding period in 2012. (QE)
MRDS reports QR7.7mn net profit in 9M2013 – Mazaya Qatar
Real Estate Development (MRDS) posted a net profit of QR7.7
million for the nine months period ended September 30, 2013
vs. a net profit of QR 4.4 million for the corresponding period
last year. The company‟s Earnings per Share (EPS) amounted
to QR0.077 for the period ended September 30, 2013 vs.
QR0.044 for the corresponding period in 2012. (QE)
KCBK’s weak 3Q2013 profitability due to muted gains from
investment securities – KCBK posted a net profit of
QR107.7mn in 3Q2013, dropping by 32.3% QoQ (-7.6% YoY).
Net profit declined primarily on the back of a significant drop in
investment gains. Gains from investment securities
(representing 33% of net operating income) was the thrust of
profitability in 2Q2013, expanding by 365.5% QoQ (-10.3% YoY)
to reach QR93.9mn vs. QR20.2mn in 1Q2013 (QR104.6mn in
2Q2012). However, in 3Q2013 gains plunged by 81.8% QoQ (71.1% YoY). The bank‟s net interest income dropped by 10.6%
QoQ (+8.5% YoY). Moreover, TTM NIMs was flattish in 9M2013,
reaching 1.99% vs. ~2.04% in 1H2013 (1.79% at the end of
2012). Net fees and commissions remained under pressure,
dropping by 21.8% QoQ (+62.9% YoY) likely due to heavy
competition in the corporate sector. Nevertheless, KCBK‟s
RoAE marginally deteriorated in 9M2013 to 9.7% vs. 10.2% in
1H2013 (9.3% at the end of 2012). Loans significantly expanded
QoQ and YTD. Al Khaliji‟s loan book grew by 7.2% QoQ
(+22.6% YTD). (QNBFS Research, QE)
QNNS 3Q2013 net profit pulled down by Milaha Capital –
Milaha posted net profit of QR204.3mn for 3Q2013, a drop of
10.9% QoQ (+3.9% YoY). Net income slightly fell short of our
forecast. Milaha Capital‟s revenue fell by 32.8% QoQ mainly
due to the lack of dividends and muted investment gains.
Generally Milaha Capital enjoys a robust first quarter. (QNBFS
Research, QE)
Page 2 of 5
3. Qatar Exchange
Top 5 Gainers
Top 5 Decliners
0.0%
6.0%
-1.4%
-1.1%
Al Khaleej
Takaful
Insurance
Widam Food
Co.
-2.1%
4.5%
4.3%
-3.3%
-4.0%
3.8%
4.0%
3.2%
-4.9%
2.6%
2.0%
-8.0%
0.0%
Islamic
Holding Group
Industries
Qatar
QNB Group
Gulf
Qatar
International Electricity and
Services
Water
Source: Qatar Exchange (QE)
-12.0%
Qatar General
Insurance &
Reinsurance
Doha
Insurance
Dlala Holding
Source: Qatar Exchange (QE)
Most Active Shares by Value (QR Million)
Most Active Shares by Volume (Million)
260.0
12.0
224.3
214.7
9.9
195.0
8.0
147.9
130.0
92.0
89.5
4.0
3.4
3.1
65.0
1.7
0.0
United
Development
Medicare
Group
Barwa Real
Estate
Commercial
Bank of Qatar
Source: Qatar Exchange (QE)
60%
17.31%
10.72%
United
Development
Medicare
Group
Industries
Qatar
Net Traded Value by Nationality (QR Million)
60
11.43%
12.45%
Non-Qatari
347
407
39.19%
35.97%
40%
20%
Barwa Real
Estate
Source: Qatar Exchange (QE)
Investor Trading Percentage to Total Value Traded
80%
Qatar Gas
Transport
(Nakilat)
0.0
Industries
Qatar
100%
1.4
32.78%
(60)
40.15%
Qatari
1,105
1,045
0%
Buy
Sell
Qatari Individuals
Qatari Institutions
Non-Qatari Individuals
Non-Qatari Institutions
Source: Qatar Exchange (QE)
(200)
-
200
Net Investment
400
600
Total Sold
800
1,000
1,200
Total Bought
Source: Qatar Exchange (QE)
Page 3 of 5
4. TECHNICAL ANALYSIS OF THE QE INDEX
Source: Bloomberg
The QE Index ended last week on a positive note closing at its weekly high. After witnessing a bullish start on Sunday, the index continued its uptrend
during the week, revealing little weakness on Tuesday. The index rebounded near the support of the 9,600.0 psychological level as buyers stepped in and
quickly offset the weakness, surpassing the stiff resistance of the descending trendline at 9,700.0, which had restricted its bullish move in the past. This was
a nice display of strength, signifying a shift in the underlying sentiment. The breach of the resistances of 9,766.28 and 9,800.0 levels in a single swoop on
Thursday were positive developments, indicating rising buying interest. Technically speaking, we believe if the index can stay above the descending
trendline, it may set the stage for a higher move and test the 9,900.0-10,000.0 levels since it has strong momentum going in. Moreover, the RSI and the
MACD lines are providing bullish signals indicating that the index has enough steam to accelerate further. However, on the flip side traders may keep a
close watch on the descending trendline, which is also in proximity to the 55-day moving average (currently at 9,724.33) for any reversal signs as a dip
below it may result in a bearish implication.
DEFINITIONS OF KEY TERMS USED IN TECHNICAL ANALYSIS
RSI (Relative Strength Index) indicator – RSI is a momentum oscillator that measures the speed and change of price movements. The RSI oscillates
between 0 to 100. The index is deemed to be overbought once the RSI approaches the 70 level, indicating that a correction is likely. On the other hand, if
the RSI approaches 30, it is an indication that the index may be getting oversold and therefore likely to bounce back.
MACD (Moving Average Convergence Divergence) indicator – The indicator consists of the MACD line and a signal line. The divergence or the
convergence of the MACD line with the signal line indicates the strength in the momentum during the uptrend or downtrend, as the case may be. When the
MACD crosses the signal line from below and trades above it, it gives a positive indication. The reverse is the situation for a bearish trend.
Candlestick chart – A candlestick chart is a price chart that displays the high, low, open, and close for a security. The „body‟ of the chart is portion between
the open and close price, while the high and low intraday movements form the „shadow‟. The candlestick may represent any time frame. We use a one-day
candlestick chart (every candlestick represents one trading day) in our analysis.
Doji candlestick pattern – A Doji candlestick is formed when a security's open and close are practically equal. The pattern indicates indecisiveness, and
based on preceding price actions and future confirmation, may indicate a bullish or bearish trend reversal.
Shooting Star/Inverted Hammer candlestick patterns – These candlestick patterns have a small real body (open price and close price are near to each
other), and a long upper shadow (large intraday movement on the upside). The Shooting Star is a bearish reversal pattern that forms after a rally. The
Inverted Hammer looks exactly like a Shooting Star, but forms after a downtrend. Inverted Hammers represent a potential bullish trend reversal.
Page 4 of 5
5. Price % Change 5(Oct 31)
Day
% Change
Monthly
Market Cap.
QR Million
TTM P/E
P/B
Div. Yield
166.00
3.75
(0.48)
116,155
12.6
2.3
3.6
Qatar Islamic Bank
67.70
1.35
(1.46)
15,997
14.8
1.4
5.5
Commercial Bank of Qatar
66.30
(0.15)
(3.07)
16,406
9.4
1.2
9.0
Doha Bank
55.00
0.92
2.23
14,210
9.6
1.6
7.5
Al Ahli Bank
55.50
(0.54)
(0.54)
7,053
13.6
2.1
5.4
Qatar International Islamic Bank
57.30
1.24
2.69
8,673
12.1
1.7
6.1
Masraf Al Rayan
29.35
0.00
2.09
22,013
13.2
2.2
3.4
Al Khaliji Bank
18.83
0.16
2.90
6,779
14.2
1.3
5.3
National Leasing
30.50
(0.49)
(11.72)
1,509
12.9
1.2
6.6
Dlala Holding
20.46
(2.11)
(5.19)
454
N/M
2.1
N/A
Qatar & Oman Investment
12.35
0.82
(4.26)
389
25.9
1.2
4.0
Islamic Holding Group
42.15
4.46
0.36
169
22.6
3.0
2.7
Company Name
Qatar National Bank
209,807
Banking and Financial Services
Zad Holding
68.10
0.15
2.56
891
9.0
0.7
5.9
Qatar German Co. for Medical Devices
15.10
1.96
0.33
174
N/M
0.9
N/A
Salam International Investment
12.20
(0.41)
1.16
1,395
10.8
0.8
5.7
Medicare Group
49.05
1.55
1.13
1,380
22.5
1.8
3.7
Qatar Cinema & Film Distribution
44.20
0.00
252
33.8
1.8
4.5
283.80
0.64
0.39
18,438
15.4
3.1
3.5
48.25
(1.13)
(6.85)
869
14.4
3.8
8.3
135.50
(0.73)
2.65
2,710
18.6
2.2
5.9
Qatar Fuel
Qatar Meat and Livestock
Al Meera Consumer Goods
(11.60)
26,109
Consumer Goods and Services
50.30
0.60
0.60
1,992
9.4
1.5
6.0
Qatar National Cement
102.30
0.29
1.29
5,023
11.8
2.0
5.9
Industries Qatar
159.50
4.25
6.40
96,498
11.9
3.0
4.8
31.50
0.80
8.62
3,916
16.8
1.9
2.4
159.00
2.58
0.76
15,900
10.5
2.8
4.6
Mannai Corp.
88.90
2.18
5.21
4,056
8.8
1.7
5.4
Aamal
14.25
0.35
(0.35)
8,550
13.4
1.3
N/A
Gulf International Services
58.60
3.17
16.97
8,712
14.4
3.0
2.6
8,155
10.0
1.7
3.2
644
11.4
1.3
3.6
3,124
3.6
0.9
1.6
Qatar Industrial Manufacturing
Qatari Investors Group
Qatar Electricity and Water
144,646
Industrials
Qatar Insurance
63.50
2.58
5.83
Doha Insurance
25.00
(3.29)
(2.72)
Qatar General Insurance & Reinsurance
54.20
(4.91)
5.24
Al Khaleej Takaful Insurance
38.80
(1.40)
(3.48)
663
13.8
1.1
2.1
Qatar Islamic Insurance
56.90
1.61
(0.18)
854
13.4
3.1
6.2
13,439
Insurance
United Development
22.00
1.85
1.43
7,419
9.1
0.7
4.5
Barwa Real Estate
26.80
0.56
7.20
10,429
15.3
0.8
5.6
Ezdan Real Estate
17.11
0.65
(0.64)
45,384
N/M
1.6
0.8
Mazaya Qatar Real Estate Development
11.38
(0.96)
(1.22)
1,138
17.2
1.0
5.3
44,525
16.9
1.8
3.6
7,702
N/M
1.3
N/A
64,370
Real Estate
139.00
0.65
(0.57)
9.11
0.66
1.00
Qatar Navigation (Milaha)
86.20
1.29
7.35
9,872
10.1
0.8
4.4
Gulf Warehousing
40.20
1.52
(0.62)
1,912
19.2
2.4
N/A
Qatar Gas Transport (Nakilat)
Transportation
19.15
1.48
0.74
10,724
14.0
3.0
5.2
Qatar Telecom
Vodafone Qatar
52,226
Telecoms
22,508
Qatar Exchange
533,106
Source: Bloomberg
Contacts
Saugata Sarkar
Ahmed M. Shehada
Keith Whitney
Sahbi Kasraoui
Head of Research
Head of Trading
Head of Sales
Manager - HNWI
Tel: (+974) 4476 6534
Tel: (+974) 4476 6535
Tel: (+974) 4476 6533
Tel: (+974) 4476 6544
saugata.sarkar@qnbfs.com.qa
ahmed.shehada@qnbfs.com.qa
keith.whitney@qnbfs.com.qa
sahbi.alkasraoui@qnbfs.com.qa
QNB Financial Services SPC
Contact Center: (+974) 4476 6666
PO Box 24025, Doha, Qatar
DISCLAIMER: This publication has been prepared by QNB Financial Services SPC (“QNBFS”) a wholly-owned subsidiary of Qatar National Bank (“QNB”). QNBFS is regulated by the Qatar
Financial Markets Authority and the Qatar Exchange; QNB is regulated by the Qatar Central Bank. This publication expresses the views and opinions of QNBFS at a given time only. It is not an
offer, promotion or recommendation to buy or sell securities or other investments, nor is it intended to constitute legal, tax, accounting, or financial advice. We therefore strongly advise potential
investors to seek independent professional advice before making any investment decision. Although the information in this report has been obtained from sources that QNBFS believes to be
reliable, we have not independently verified such information and it may not be accurate or complete. While this publication has been prepared with the utmost degree of care by our analysts,
QNBFS does not make any representations warranties as to the accuracy and completeness of the information it may contain, and declines any liability in that respect. QNBFS reserves the right
to amend the views and opinions expressed in this publication at any time. It may also express viewpoints or make investment decisions that differ significantly from, or even contradict, the views
and opinions included in this report.
COPYRIGHT: No part of this document may be reproduced without the explicit written permission of QNBFS.
Page 5 of 5