1412 - Performance of the USHA Weeder in Rice and Other in Crops in Nepal
•Descargar como PPTX, PDF•
1 recomendación•2,707 vistas

Presentation at the Workshop on Crop Production Equipment for the System of Rice Intensification (SRI) Presenter: Ram B. Khadka, Nepal Agricultural Research Council Title: Performance of the USHA Weeder in Rice and Other Crops in Nepal Date: November 1, 2014 Venue: ACISAI, Asian Institute of Technology, Thailand

Recomendados
Recomendados
Más contenido relacionado
La actualidad más candente
La actualidad más candente (20)
Destacado
Destacado (20)
Similar a 1412 - Performance of the USHA Weeder in Rice and Other in Crops in Nepal
Similar a 1412 - Performance of the USHA Weeder in Rice and Other in Crops in Nepal (20)
Más de SRI-Rice, Dept. of Global Development, CALS, Cornell University
Más de SRI-Rice, Dept. of Global Development, CALS, Cornell University (20)
Último
Último (20)
1412 - Performance of the USHA Weeder in Rice and Other in Crops in Nepal
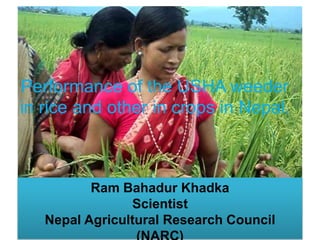
- 1. Performance of the USHA weeder in rice and other in crops in Nepal. Ram Bahadur Khadka Scientist Nepal Agricultural Research Council (NARC)
- 2. Nepal Area: 14.7 million hectares (147,181 sq.km) 93rd in the world Water: 2.8% Population: 26.6 million 2011 Population growth rate; 1.4 (2011) Density: 199.3/km2, 62nd Population below poverty line: 25.16% (2011) Mountain: 3000-8,848 masl, Cover 35 %land area, 2% of this land cultivable. Hill: 800-2,400 masl, Covers 43 % land area, One-tenth of it is cultivable. Terai: 60-300 masl, 23 % land area, Nearly half of it is cultivable.
- 3. Agricultural Scenario Dominated by subsistence and small holder agriculture Agriculture contributed 36% GDP Rice based and maize based cropping system are dominated in terai and hills respectively Cattle, buffalo and goat and poultry are major livestock Diversity in agriculture due to variation of agri-ecological diversity
- 4. Land holding 4.03 Av. Holding size, ha Av. No of parcel / holding Average size of parcel, hac 3.18 3.2 3.27 4.5 4 3.5 3 2.5 2 1.5 1 0.5 0 Mountain Hill Terai Total
- 5. Area, production & productivity of cereal crops, 2010/2011 2981 2281 2275 1122 1063 858 2477 3500 3000 2500 2000 1500 1000 500 0 10000 9000 8000 7000 6000 5000 4000 3000 2000 1000 0 Yield(ha) Area(ha), Production(Mt) Thousands Area(ha) Prodcution(mt. Yield (Kg/ha)
- 6. Agricultural work in gender perspective (Crop intensive pocket area in percentage) 0 64 64 61 32 58 44 32 17 94 32 33 36 64 38 53 65 80 6 4 3 2 3 3 3 3 3 100 90 80 70 60 50 40 30 20 10 0 Female Male Children
- 7. Farm Power Availability Farm Pwer Availability Animate power Mecha nical Power 23% Animal Power 41% Huma n Power 36% major source Stationary engine, two wheel power tiller and 4 wheel power tiller are considered The mechanical power is concentrated in terai
- 8. Agricultural Mechanization in SRI Nepal Tillage Majority by animal power Only 25% of farmers use iron plough In Nepal 8% use tractor and in terai 18% Most of the tractor use cultivator Custom hiring of tractor is common Power tiller and mini power is getting popular Planting and seeding Rice is manually transplanted Wheat is board casted and seed cum fertilizers are also using Maize & vegetable seeds is dibbled More than 64% is performed by women
- 9. Inter-culture Operation Rice, potato maize and vegetables needs major inter culture operations Khurpi and sickle, kuto are used Bullock drawn local plough is also used for maize inter culture In SRI use of cono, rotatory and twin wheel hoe weeder is getting popularity More than 60% of inter- culture operation by women
- 10. Challenges of AM in Nepal Small and fragmented land holding Subsistence nature of agriculture Poor infrastructure is major constrains of mechanization and commercialization of agriculture in Nepal Need of easy access to credit and awareness of financial intermediaries Need of easy access to appropriate AM technology Weak research and development system on AM Lack of clear cut policy and strategy on AM
- 11. Why weeding in SRI (In perspective of Nepal) Alternate drying and wetting promote the weed population. To facilitate the proper aeration in the soil which promotes healthy growth of roots and consequently the plant. Enhances the utilization of biomass, soil incorporation and decomposition Increased yields as a result or more productive tillers, large panicle size more number of grains per panicle and increased grain weight.
- 12. Early development of mechanical Weeder in SRI in Nepal 1990s Initially wooden flakes with iron pin were used as a weeder in SRI 2000s: Locally fabricated Rotatory weeder was developed by NARC 2010s: USA weeder was introduced for SRI and SWI promotion in Nepal
- 13. Introduction of USHA weeder in Nepal 2009: First visit was done at 2009 by expert team to KGVK, Jharkhand and introduced 10 weeder. 2010: about 500 weeder introduced to Nepal and distributed to more than 10 districts. 2011: 500 more weeder brought 2012NARC, RARS, Khajura, introduced 15 weeders for testing on-station including twin wheel hoe and cono weeder 2013 Caritas introduced 30 weeders and distributed to 3 districts
- 14. Types of weeder introduced Rotatory weeder Twin wheel hoe SWI cono-wedeer
- 15. Advantages Reducing woman drudgery since hand weeding is considered as a job of women only Attracting young generation towards agriculture. Can be used in multi crop Increasing productivity and helping in the management of weed biomass. Eco-friendly and suitable for small farmers Cost-effective Durable Easy to handling
- 16. Challenges No local suppliers Government subsidy is essential Wide range of awareness required Not suitable for big holders motorized weeders required Ensure source of water is essential for rotatory weeder Still we required suitable weeders for gravely soil in hilly area
- 17. Effect of different methods of weeding in SRI in Fresh and Dry weight of weed biomass 1200.00 1000.00 800.00 600.00 400.00 200.00 0.00 Fresh wt (gm per plot) Dry wt (gm per plot) Weed biomass 2012 90.00 80.00 70.00 60.00 50.00 40.00 30.00 20.00 10.00 0.00 Dry wt (gm) Dry… 2013
- 18. Effect of different methods of weeding in SRI 2.52 3.63 3.69 4.41 9.00 8.00 7.00 6.00 5.00 4.00 3.00 2.00 1.00 0.00 Straw Yield (Mt. per ha) 6.40 6.20 6.00 5.80 5.60 5.40 5.20 5.00 4.80 No weeding Chemical Hand weeding Rotatroy weeder Yield(Mt) Yield Mt/ha) 2012 2013
- 19. Time saving compared to hand weeding and yield advantage compared to herbicides Methods of weed Control Time saving compared to hand weeding Rotatory weeder (ha) 72.50% Hand weeding (ha) 0 Herbicides 92% Methods of weed Control Yield advantages Rotatory weeder (ha) 21.48% Hand weeding (ha) 1.65% Herbicides 0% In long run weeders are more cost effective, environmentally friendly and very suitable for small holder farmers
- 20. Direct seeded SRI Twin wheel hoe SWI Cono -weeder Relevancy of D-SRI No suitable technology for upland DSRSRI principle in rain-fed upland rice. Save labour, water and time.
- 21. SWI Treatment Tiller numbe r Number of spike per hill Number of grains per spike Number of spike per sq m Spike length (cm) TGW (gm) Productivity (Mt/ha) Conv. 4.333 4.000 44.200 311.333 10.200 45.000 4.867 SWI 31.333 30.167 58.500 367.333 15.433 56.667 7.633 GM 17.833 17.083 51.350 339.333 12.817 50.833 6.250 CV 24.12% 31.68% 17.30% 6.31% 11.26% 16.06% 12.08% LSD 15.110 19.014 31.202 75.184 5.069 28.684 2.653 Sign. ** ** ns ns * ns **
- 22. Mustard System of Mustard Intensification
- 23. Lentil
- 25. VffB ;'ljwf kl/of]hgf 5fkfdf Media coverage Weeder machines are demonstrated in 8 VDCs of Kailali Farmer's are attracted towards rotatory weeders
- 26. Thanks for your kind attention