This document describes the development of a custom-made linear array transducer for photoacoustic breast imaging. It has large transducer elements with a resonance frequency of 1 MHz for high sensitivity. Acoustic lenses are used to increase the acceptance angle. Characterization showed a minimum detectable pressure of 0.8 Pa, better than previous systems. The bandwidth is narrow but can be improved with optimized matching layers. A lateral resonance at 330 kHz was observed that could impact performance and needs to be addressed in future optimizations through techniques like sub-dicing. Phantom experiments are planned to evaluate the system using this transducer array.
Design and Optimization a Circular Shape Network Antenna Micro Strip for Some...
A_custom-made_linear_array_transducer
1. A custom-made linear array transducer for photoacoustic breast
imaging
Wenfeng Xia*a
, Daniele Pirasa
, Michelle Heijbloma,b
, Johan van Hespena
, Spiridon van Veldhovenc
,
Christian Prinsc
, Ton G. van Leeuwena,d
, Wiendelt Steenbergena
and Srirang Manohara
a
Biomedical Photonic Imaging group, Mira institute for Biomedical Technology and Technical
Medicine, University of Twente, P.O. Box 217, 7500 AE Enschede, The Netherlands;
b
Center for Breast Care, Medisch Spectrum Twente hospital, P.O.Box 50000, 7500 KA, Enschede,
The Netherlands;
c
Oldelft Ultrasound B.V., P.O. Box 5082, 2600 GB Delft, The Netherlands;
d
Biomedical Engineering and Physics, Academic Medical Center, University of Amsterdam, P.O.
Box 2270, 1100 DE Amsterdam, The Netherlands;
ABSTRACT
A custom-made first prototype of a linear array ultrasound transducer for breast imaging is presented. Large active area
transducer elements (5 mm x 5 mm) with 1 MHz resonance frequency are chosen to obtain a relatively high sensitivity.
Acoustic lenses are used to enlarge the narrow acceptance angle of such transducer elements. The minimum detectable
pressure, frequency bandwidth and electrical impedance of the transducer elements are characterized. The results show
the transducer has a minimum detectable pressure of 0.8 Pa, which is superior than the transducers used in the Twente
Photoacoustic Mammoscope system previously developed in our group. The bandwidth of the transducer is relative
small, however it can be improved when using optimized matching layer thickness in future. We also observed a strong
lateral resonance at 330 kHz, which may cause problems in various aspects for a photoacoustic imaging system. We
discuss the future improvement and plans for the transducer optimizations.
Keywords: Photoacoustic imaging, breast cancer, linear array transducer
1. INTRODUCTION
Photoacoustic imaging makes use of the optical contrast provided by selective light absorption of chromophores and
large penetration depth of ultrasound1-6
. It images objects deep in tissue and provides resolution as in ultrasound
imaging, and promises to be an alternative image modality for detecting angiogenic biomarkers of breast cancer7-15
.
The ultrasound transducer lies at the heart of a photoacoustic imaging system, especially for the application of breast
imaging, which requires to detect extremely weak ultrasound generated a few centimeter deep in tissue. In our system, a
large active area transducer (5 mm x 5 mm) with relatively low resonance frequency (1 MHz) using PZT as active
material is preferable for its higher sensitivity compared to small area transducer with high resonance frequency. On the
other hand, a large area transducer also has a small directivity angle, which limits the detection of signals off-axis. The
result is a limited lateral resolution of the system. To have high sensitivity and large directivity angle, a hemispherical
acoustic lens is places on top of each transducer element to enlarges the directivity angle of such a transducer without
compromising its sensitivity16,17
.
Moreover, laser generated photoacoustic signal frequency is related to the structure dimensions. To enable the efficient
detection of signals generated from objects with different sizes, a transducer with broad bandwidth is preferred. In our
*
Address all correspondence to: Wenfeng Xia, Biomedical Photonic Imaging group, Mira Institute for Biomedical
Technology and Technical Medicine, University of Twente, P.O. Box 217, 7500 AE Enschede, The Netherlands. Tel:
+31-53-489 3877; Fax: +31-53-489 1105; Email: W.Xia@tnw.utwente.nl.
2. Layer description
Layer Material Thickness
Front matching layer Eccobond 56C 0.590 mm
PZT layer CTS 3203HD 1.625 mm
Back matching layer Eccobond 56C 0.878 mm
Backing layer Elastosil 10 mm
Electrode/Flex print Copper foil 0.1 mm
design, two impedance matching layers (front and back) are used and the thicknesses of the matching layers are
optimized to broaden the bandwidth of the transducer.
A linear array transducer is developed according to this design and used for testing the performances of a photoacoustic
tomographic system for breast imaging12,18-20
. The sensitivity, frequency response and electrical impedance of the
transducer are measured. In future, breast phantoms will be used to evaluate the system using this transducer array. We
conclude that a sensitive and broadband transducer array has been achieved according to our theoretical design and
practical realizations.
2. MATERIALS AND METHODS
2.1 The transducer array
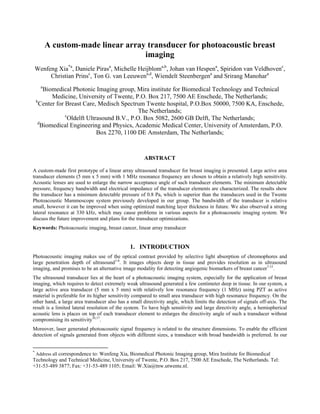
Figures 1 shows the schematic of 10 element transducer array developed. The PZT layer is designed to have resonance
frequency of 1 MHz, with a 5 mm x 5 mm surface area. Each element has two impedance matching layers (front and
back), used for impedance matching between the PZT material and tissue/backing. The thickness of the matching layers
are optimized using FEM based models to broaden the bandwidth of the transducer. A thick backing with strong
damping properties is used to absorb the acoustic energy which is emitted towards the backside of the transducer. By
adding a matching layer with the right acoustic properties between the PZT layer and the backing layer the bandwidth of
the transducer can be broadened. An aluminum frame on the back and side together with a very thin aluminum foil on
top is used as the grounding to give the entire transducer complete electrical shielding to reduce the noise level. Finally,
to enlarge the directivity of transducer elements, a hemispherical lens is placed on each element16
as shown in Figure 1.
The acoustic properties of the lens material have been described in detail in Reference 16. The materials and their
dimensions for the different layers of the transducer are listed in Table 1.
Figure 1. Schematics of the configuration of the transducer array.
Table 1. Transducer layer description
3. 2.2 Transducer sensitivity, frequency response and electrical impedance measurements.
The Minimum Detectable Pressure (MDP) of the detector is estimated by a substitution method. A 1 MHz transmitter
insonifies one selected element of the array with progressively reducing pressures till the transducer output signal
vanishes in the background noise. A calibrated hydrophone (Precision Acoustics Ltd. Dorchester) is used independently
to measure those pressures from the ultrasound transmitter in separate measurements. Finally, the electrical noise is
measured separately when the transducer is excited with minimal pressure. The sensitivity and MDP can be derived.
The acoustic impulse is obtained by illuminating a highly absorbing specimen. The detector is merged in a Perspex tank
with dimensions of 5 x 7 x 4 cm3
filled with 50% India Ink (Royal Talens, Apeldoorn), which is used as absorber. A Q-
switched Nd:YAG laser (Brilliant B, Quantel, Les Ulis CEDEX, France) is used as laser source (30mJ/cm2, 532nm,
10Hz). The photoacoustic impulse signal is generated by the light strongly absorbed by the India ink. Due to the
extremely high absorption of India ink, light energy is confined within a thin layer, which produces a broadband acoustic
wave, in the ideal case, an impulse. Under these experimental conditions the signal detected by transducer under
examination represents the end-of-cable impulse response of the element including the characteristics of the electronics.
The electrical impedance of an element in the array is measured using an impedance analyzer (HP 4149A) under both
water load and air load conditions.
3. RESULTS
Figure 2 shows the measured peak-to-peak voltage output of the signal from a single element transducer in the array as a
function of the excitation pressure on the surface of the element. The slope of the linear fit indicates the sensitivity of the
transducer element. The excitation pressure when the output voltage is equal to the noise level is the minimal detectable
pressure for the element under examination. Transducer element with a preamplifer has much lower MDP (8 Pa), and
when compared with transducer without such a preamplifier (170 Pa). The final sensitivity of the transducer with a
preamplifier is quite promising (0.8 Pa when using 100 signal averaging) since this value for the PVDF detector used in
the Twente Photoacoustic Mammoscope (PAM I) system8-10
is 100 times higher (80 Pa).
Figure 2. Minimal Detectable Pressure (MDP) measured for a single element in the array (a) without connecting a
preamplifier and (b) connecting a preamplifer.
4. The frequency response of a single element in the array is shown in Figure 3. The FFT of the impulse response signal in
time domain (a) reveals the frequency response of the element in the frequency domain. It shows that the transducer
element has the resonance frequency at 1.1 MHz, which is slightly higher than the designed 1 MHz resonance frequency
according to the thickness of the PZT layer. The element has -6 dB bandwidth from 0.95 MHz to 1.55MHz, around 60%
fractional bandwidth. The bandwidth of the transducer element can be increased when using optimized thickness for
matching layers. Compared to the PVDF transducer used in PAM I, the transducer element has much narrow bandwidth.
It is not surprising since PVDF has much soft nature and its acoustic impedance is closer to tissue, which gives PVDF a
broader bandwidth but lower sensitivity than PZT transducer.
The electrical impedance and phase angle of element 2 in the array are shown in Figure 4. Two resonance frequency are
visible: lateral resonance at 330 kHz and thickness resonance at 1.1 MHz, which corresponding to its dimensions. This
measurements confirm the measured peaks in the frequency response.
Figure 3. Frequency response measured for element 2 in the array (a) in time domain and (b) frequency domain.
Figure 4. (a) Electrical impedance and phase angle (b) for element 2 in the array measured with air load and water load.
5. 4. DISCUSSION AND CONCLUSIONS
In conclusion, we designed and developed a first prototype transducer array for photoacoustic imaging of breast. The
sensitivity, bandwidth and electrical impedance of the transducer have been characterized. The measured minimum
detectable pressure is 0.8 Pa, which is 100 times lower than the transducer used in PAM I. The bandwidth of the
transducer is narrow. This is not preferable for photoacoustic breast imaging since low bandwidth transducer limits the
ability for faithfully detecting photoacoustic signal frequencies for objects with differing dimensions. However, the
bandwidth can be improved when using optimized matching layer thicknesses. The electrical impedance measurements
have shown a strong lateral resonance peak, and is confirmed by the measured frequency response of the transducer. This
strong lateral resonance may lower the sensitivity for thickness mode resonance of the transducer. Furthermore, it causes
additional “tails” in the time domain signal detected. This may deteriorate the resolution of the system. Finally, the
lateral resonance caused peak at 330 KHz in the frequency domain response may cause problems for transducer
directivity and thereby influence the performance of the imaging system.
Further steps need to be taken to improve the transducer performances. First, a FEM model will be built to optimize the
matching layer thickness to broaden the bandwidth. Second, sub-dicing will be used to reduce the lateral resonance of the
transducer. In sub-dicing, single elements are sub-diced into units with the same dimensions. Electrically those units are
still grouped as a single elements, while ultrasonically they are separated by air kerfs in between. This design is used to
push the radial resonance away from the bandwidth of the transducer. Finally, phantom experiments are planned to
evaluate the system when the final optimized transducer is used.
5. CONFLICTS OF INTEREST
W.S., T.v.L. and S.M. have financial interest in PA imaging Holding BV, which however did not support this work.
6. ACKNOWLEDGMENTS
The financial support of the Agentschap NL Innovation Oriented Research Programmes Photonic Devices under the
HYMPACT Project (IPD083374); High Tech Health Fram, MIRA Institute for Biomedical Technology and Technical
Medicine; and the Vernieuwingsimpuls project (VICI grant 10831 of the Netherlands Technology Foundation STW) of
W. S. are gratefully acknowledged.
REFERENCES
[1] Wang, L.V., “Multiscale photoacoustic microscopy and computed tomography,” Nature Photon, 3, 503-509
(2009).
[2] Beard, P., “Biomedical photoacoustic imaging”, Interface Focus, 1, 602-631, (2011).
[3] Razansky, D., “Multi-Spectral Optoacoustic Tomography - Volumetric color hearing in real time”, IEEE J. Sel.
Topic Quantum. Electron. 99 (2011).
[4] Yao, J., Wang, L.V., “Photoacoustic tomography: fundamentals, advances and prospects”, Contrast Media &
Molecular Imaging, 6(5), 332-345, (2011).
[5] Jose, J., Manohar, S., Kolkman, R.G.M., Steenbergen, W. and van Leeuwen, T.G., “Imaging of tumor
vasculature using Twente photoacoustic systems,” J. Biophoton 2, 701-717 (2009).
[6] Mallidi, S., Luke, G. P. and Emelianov, S, “Photoacoustic imaging in cancer detection, diagnosis, and treatment
guidance,” Trends in Biotech. 29(5), 213-221 (2011).
[7] Kruger, R.A, Lam, R.B, Reinecke, D.R., Rio, S.P.D. and Doyle, R.P., “Photoacoustic angiography of the
breast,” Med. Phys. 37, 6096-6100 (2010).
6. [8] Piras, D., Xia, W., Steenbergen, W., van Leeuwen, T.G. and Manohar, S., “Photoacoustic imaging of the breast
using the Twente Photoacoustic Mammoscope: Present status and future perspectives,” IEEE J. Sel. Topic
Quantum. Electron. 16, 730-739 (2010).
[9] Manohar, S., Kharine, A., van Hespen, J., Steenbergen, W., Van Leeuwen, T., “The Twente Photoacoustic
Mammoscope: system overview and performance,” Phys. Med. Biol. 50, 2543-2557 (2005).
[10]Manohar, S., Vaartjes, S.E., van Hespen, J. C. G., Klaase, J. M., van den Engh, F. M., Steenbergen, W. and van
Leeuwen, T. G., “Initial results of in vivo non-invasive cancer imaging in the human breast using near-infrared
photoacoustics”, Opt. Express, 15(9), 12277-12285 (2007).
[11]Pramanik, M., Ku, G., Li, C. and Wang, L.V., “Design and evaluation of a novel breast cancer detection system
combining both thermoacoustic (TA) and photoacoustic (PA) tomography,” Med. Phys. 35, 2218-2223 (2008).
[12]Manohar, S., Kharine, A., van Hespen, J.C.G., Steenbergen, W. and van Leeuwen, T.G, “Photoacoustic
mammography laboratory prototype: imaging of breast tissue phantoms”, J. Biomed. Opt. 9, 1172 (2004).
[13]Heijblom, M., Piras, D., Tije, E. T., Xia, W., van Hespen, J., Klaase, J., van den Engh, F., van Leeuwen, T. G.,
Steenbergen, W. and Manohar, S., “Breast imaging using the Twente Photoacoustic Mammoscope (PAM): new
clinical measurements”, Proc. SPIE 8087, 80870(N), (2001).
[14]Ermilov, S. A., Khamapirad, T., Conjusteau, A., Leonard, M.H., Lacewell, R., Mehta, K., Miller, T. and
Oraevsky, A.A, “Laser optoacoustic imaging system for detection of breast cancer,” J. Biomed. Opt. 14(2),
024007 (2009).
[15]Hilgerink, M. P., Hummel, J. M., Manohar, S., Vaartijes, S. R. and IJzerman, M. J., “Assessment of the added
value of the Twente Photoacoustic Mammoscope in breast cancer diagnosis”, Medical Devices: Evidence and
Research, 4, 107-115, (2011).
[16]Xia, W., Piras, D., Heijblom, M., van Hespen, van Veldhoven, S., Prins, C., van Leeuwen, J. C.G.,
Steenbergen, W., T. G. and Manohar, S., “Enlarged acceptance angle of a finite size detector in photoacoustic
imaging using acoustic lenses,” Proc. SPIE 8090, 80900L (2011); doi:10.1117/12.889970.
[17]Pramanik, M., Ku, G., and Wang, L. V., “Tangetial resolution improvement in thermoacoustic and
photoacoustic tomography using a nagetive acoustic lens,” J. Biomed. Opt. 14(2), 024028 (2009).
[18]Kharine, A., Manohar, S., Seeton, R., Kolkman, R., Bolt, R., Steenbergen, W., de Mul, F., "Poly(vinyl
alcohol)gels for use as tissue hantoms in photoacoustic mammography," Phys. Med. Biol. 48, 357-370 (2003).
[19]Manohar, S., Kharine, A., van Hespen, J., Steenbergen, W., de Mul, F., van Leeuwen, T., “Photoacoustic
imaging of inhomogeneities embedded in breast tissue phantoms,” Proc. SPIE 4960, 64-75 (2003).
[20]Xia, W., Piras, D., Heijblom, M., Steenbergen, W., van Leeuwen, T., Manohar, S., “Poly(vinyl alcohol) gels as
photoacoustic breast phantoms revisited,” J. Biomed. Opt. 16(7), 075002 (2011).