SlideShare una empresa de Scribd logo
1 de 16
Descargar para leer sin conexión
Weekly Market Review
Talking Points
Weekly Highlights
• Domestic stocks fell from last week’s highs, despite positive
leading economic indicators, such as jobless claims falling to
their lowest levels in decades and strong existing home sales.
This week’s pullback likely signals investors’ profit taking as
the S&P500 traded up to 2,128, near its 52-week high of
2,134.
• World markets also fell, as European index declines
overshadowed Asian index gains. European markets fell, as
British energy supplier SSE and Aberdeen Asset Management
provided discouraging business updates. Asian markets
posted small gains, with the Nikkei rising on increased
tourism and positive earnings. Additionally, Hong Kong
shares and the Shanghai market moved higher even though
the telecom sector slipped on news that the Chinese
government ordered three industry giants to cut broadband
fees.
• U.S. Treasury yields fell, especially on the long end of the
curve, as concerns of slowing global growth and tame
inflation remain.
• Commodity indexes fell, as abundant inventories caused
coffee and sugar to fall notably, whereas Industrial metals,
like copper and nickel, declined on Chinese stock market
concerns.
Chart of the Week
July 24, 2015
• Among equities, large caps
outperformed small caps, and
growth stocks outperformed value-
oriented issues. Domestic stocks
outperformed international
equities. Developed markets
outperformed emerging market
stocks. Overall, equities fell for the
week.
• Treasury yields fell, and the yield
curve flattened, reflecting shifting
views on inflation expectations.
• Commodity indexes fell, as a gage
of 22 commodities dropped to its
lowest level since 2002.
• The dollar index fell this week
against a basket of six major
currencies.
• Among economic data released
this week, existing home sales
were strong in June – their highest
since February 2007. Whereas,
new home sales fell to seven
month lows; oil inventories
unexpectedly rose 2.5M barrels to
463.9 million barrels; US weekly
jobless claims declined to levels not
seen since 1973; PMI
Manufacturing Index held steady,
as expected.
0.0
50.0
100.0
150.0
200.0
250.0
300.0
350.0
400.0
450.0
Jul-14 Sep-14 Nov-14 Jan-15 Mar-15 May-15
%
Non-Farm Payrolls - Trailing 12 Months
Source: Bloomberg
-3.0
-2.0
-1.0
0.0
1.0
2.0
3.0
4.0
5.0
6.0
Sep-12 Mar-13 Sep-13 Mar-14 Sep-14 Mar-15
%
Real GDP Growth Rate - Annualized - Trailing 12 Qtrs.
Source: Bloomberg
17,000
17,200
17,400
17,600
17,800
18,000
18,200
18,400
Apr-15 May-15 Jun-15
Index
Dow Jones Industrial Average - Trailing 90 Days
Source: Bloomberg
-3.0
-2.0
-1.0
0.0
1.0
2.0
3.0
4.0
5.0
6.0
Sep-12 Mar-13 Sep-13 Mar-14 Sep-14 Mar-15
%
Real GDP Growth Rate - Annualized - Trailing 12 Qtrs.
Source: Bloomberg
PMC Weekly Market Review
2
July 24, 2015
MARKET DASHBOARD
0.7
0.8
0.9
1
1.1
1.2
1.3
1.4
Jun-13 Aug-13 Oct-13 Dec-13 Feb-14 Apr-14 Jun-14 Aug-14 Oct-14 Dec-14 Feb-15 Apr-15 Jun-15
Source: Bloomberg
Wealth Index|Growth of $1: Trailing 24 Months
S&P 500 Dow Industrials Small Cap EAFE Emerging Mkts.
L
S
Source: Bloomberg
-2.38% -2.33% -2.29%
-2.17% -1.82% -1.48%
7.57%1.77%-3.93%
One Week
Value Growth
-3.55% -3.24% -2.95%
YTD
Value Growth
-2.75% 1.52% 5.80%
-2.37% 0.86% 4.00%
1900
1950
2000
2050
2100
2150
1/26 2/9 2/23 3/9 3/23 4/6 4/20 5/4 5/18 6/1 6/15 6/29 7/13
Source: Bloomberg
S&P 500 Index: Trailing 180 Days
% Wgt in
S&P 500
Week %
Chg. YTD % Chg.
Consumer Discretionary 13.1 -0.46% 9.1%
Consumer Staples 9.6 -0.92% 2.0%
Energy 7.2 -4.07% -13.0%
Financials 16.9 -1.01% 1.5%
Health Care 15.4 -2.76% 9.2%
Industrials 9.8 -3.81% -6.3%
Information Technology 20.0 -2.45% 2.6%
Materials 2.9 -5.47% -7.4%
Telecom Services 2.2 -3.04% -1.9%
Utilities 2.8 -2.37% -10.5%
Source: Bloomberg
Sector Performance:
S&P/Global Industry Classification Sectors (GICS)
10
12
14
16
18
20
22
Jan-15 Feb-15 Mar-15 Apr-15 May-15 Jun-15
Source: Bloomberg
VIX Index: Trailing 180 Days
Last Price Change % Chg. YTD % Last Price Change % Chg. YTD %
S&P 500 2,079.65 -46.99 -2.21% 1.0% Russell Global EM 2,962.90 -49.37 -1.67% -2.3%
Dow Industrials 17,568.53 -517.92 -2.86% -1.4% 10-Year US Treas. 2.27 -8 bps NM NM
Nasdaq 5,088.63 -121.51 -2.33% 7.4% DJ UBS Comm. Idx. 93.29 -4.28 -4.39% -10.6%
Russell 2000 1,225.99 -41.10 -3.24% 1.8% Gold $1,099.61 -$34.38 -3.03% -7.1%
Euro Stoxx Index 394.64 -11.04 -2.72% 15.2% Crude Oil $48.09 -$3.08 -6.01% -16.3%
Shanghai Composite 4,070.91 113.56 2.87% 25.9% Dollar Index 97.26 -0.60 -0.61% 7.7%
Russell Global 1,792.67 -19.17 -1.07% 2.6% VIX Index 13.74 1.79 14.98% -28.4%
Source: Bloomberg; Index %change is based on price.
PMC Weekly Market Review
3
July 24, 2015
134
135
136
137
138
139
140
141
142
143
144
Dec-10 Feb-11 Apr-11 Jun-11 Aug-11 Oct-11
Index
S&P/Case-Shiller Home Price Index-Trailing 12 Mos.
Source: Bloomberg
THE ECONOMY AND MARKETS
An Upbeat Start to Earnings Season
In the first quarter of 2015 reported earnings per share (EPS) were $21.51 for the S&P 500 Index, representing a decline of
14.23% from the prior year. The Materials and the Industrials sectors were the worst performers, with year-over-year EPS
declining over 40%. Although Utilities and Financials were bright spots, gaining 40% and 20% year over year, respectively,
many corporations provided overall lower guidance, and Wall Street analysts lowered second quarter earnings expectations.
Thomson Reuters’ data forecasted a 5.9% gain in earnings for Q2 in January for the S&P 500 Index, and by June these
estimates were revised to a loss of 1.5%. Bob Doll of Nuveen Investments stated in a quarterly conference call earlier this
week that second quarter earnings estimates were cut too far, in his opinion, and that many companies will exceed Wall
Street consensus. So far, that holds true.
Corporate earnings releases kicked off unofficially on July 8th, when Alcoa (ticker: AA) reported solid second quarter profits.
Through the market close on Tuesday, July 21st, 102 companies (roughly 20%) in the S&P 500 Index have reported earnings.
Seventy percent beat earnings expectations, and 55% exceeded revenue forecasts. On the heels of a report that existing
home sales were strong in June, reaching highs not seen since February 2007, it is no surprise that housing companies posted
positive earnings. Specifically, Lennar Corp (ticker: LEN) reported $0.79 per diluted share, versus last year’s $0.61 per diluted
share. Corporations that did not perform as well typically had revenue exposure overseas, and were hurt by a strong dollar,
which reduces income derived outside of the US. Although the Technology sector posted year-over-year gains last quarter of
8.90%, tech companies surprised the market this week with lackluster earnings, with names like Qualcomm Corp (ticker:
QCOM), Apple (ticker: AAPL), SanDisk Corp (ticker: SNDK), IBM and Microsoft (ticker: MSFT) missing expectations in one way
or another. For example, Qualcomm reported a 47% decline in quarterly profits; Apple’s iPhone sales were lower than
anticipated; SanDisk reported a drop in both revenue and profit; IBM’s operating EPS fell 13%; Microsoft earnings and
revenue beat expectations, but had a loss for the quarter when previously disclosed restructuring charges were included.
Despite the soft spot in the Technology sector, the overall earnings season has started out well. In fact, we’re seen growth
across Basic Materials, Consumer Goods, and Financials, with names like Bank of America (ticker: BAC) and Citigroup (ticker:
C) beating expectations. Additionally, Walgreens Boots Alliance (ticker: WBA), Monsanto Co (ticker: MON), Constellation
Brands (ticker: STZ), Darden Restaurants (ticker: DRI), and UnitedHealth Group (ticker: UNH) all posted EPS growth of 57%,
48%, 30%, 26%, and 15%, respectively. Should earnings continue to beat expectations, the US Equity market may extend its
gains and even tolerate a future rate hike by the Fed.
Stephanie Hagglund
Investment Analyst
PMC Weekly Market Review
4
July 24, 2015
134
135
136
137
138
139
140
141
142
143
144
Dec-10 Feb-11 Apr-11 Jun-11 Aug-11 Oct-11
Index
S&P/Case-Shiller Home Price Index-Trailing 12 Mos.
Source: Bloomberg
ECONOMIC DATA
5.0
5.2
5.4
5.6
5.8
6.0
6.2
6.4
Jul-14 Sep-14 Nov-14 Jan-15 Mar-15 May-15
%
Unemployment Rate-Trailing 12 Mos.
Source: Bloomberg
-0.8
-0.6
-0.4
-0.2
0
0.2
0.4
0.6
Jul-14 Sep-14 Nov-14 Jan-15 Mar-15 May-15
Monthly%Chg.
Consumer Price Index-Trailing 12 Mos.
Headline CPI Core CPISource: Bloomberg
80.0
85.0
90.0
95.0
100.0
105.0
Jul-14 Sep-14 Nov-14 Jan-15 Mar-15 May-15
Index
Consumer Board Confidence Index - Trailing 12 Mos.
Source: Bloomberg
0
50
100
150
200
250
300
350
400
450
Jul-14 Sep-14 Nov-14 Jan-15 Mar-15 May-15
Thousands
Non-Farm Payrolls-Trailing 12 Mos.
Source: Bloomberg
-3.0
-2.0
-1.0
0.0
1.0
2.0
3.0
4.0
5.0
6.0
Sep-12 Mar-13 Sep-13 Mar-14 Sep-14 Mar-15
%
Real GDP Growth Rate - Annualized - 12 Qtrs.
Source: Bloomberg
230
240
250
260
270
280
290
300
5/1 5/15 5/29 6/12 6/26 7/10
Thousands
Initial Jobless Claims-Trailing 12 Wks.
Source: Bloomberg
PMC Weekly Market Review July 24, 2015
EUROZONE
5
Last Change % Chg. YTD % Last Change % Chg. YTD %
Germany 10-Yr. Govt. 0.69 9 bps NM NM France 10-Yr. Govt. 0.97 10 bps NM NM
Greece 10-Yr. Govt. 11.33 44 bps NM NM Ireland 10-Yr. Govt. 1.25 14 bps NM NM
Italy 10-Yr. Govt. 1.87 5 bps NM NM Portugal 10-Yr. Govt. 2.50 12 bps NM NM
Spain 10-Yr. Govt. 1.90 3 bps NM NM Netherlands 10-Yr. Govt. 0.85 10 bps NM NM
Belgium 10-Yr. Govt. 0.98 11 bps NM NM U.K. 10-Yr. Govt. 1.93 14 bps NM NM
SELECTED EUROPEAN SOVEREIGN YIELD PERFORMANCE
Source: Bloomberg
Basis points (bps)
0.00
0.20
0.40
0.60
0.80
1.00
1.20
4/27 5/11 5/25 6/8 6/22 7/6 7/20
%
Germany 10-Year Government Bond Yield
Source: Bloomberg
1.0
1.2
1.4
1.6
1.8
2.0
2.2
2.4
2.6
4/27 5/11 5/25 6/8 6/22 7/6 7/20
%
Spain 10-Year Government Bond Yield
Source: Bloomberg
1.1
1.3
1.5
1.7
1.9
2.1
2.3
2.5
4/27 5/11 5/25 6/8 6/22 7/6 7/20
%
Italy 10-Year Government Bond Yield
Source: Bloomberg
4.0
6.0
8.0
10.0
12.0
14.0
16.0
18.0
20.0
4/27 5/11 5/25 6/8 6/22 7/6 7/20
%
Greece 10-Year Government Bond Yield
Source: Bloomberg
PMC Weekly Market Review July 24, 2015
EQUITIES
6
4,700
4,750
4,800
4,850
4,900
4,950
5,000
5,050
5,100
5,150
5,200
5,250
4/27 5/11 5/25 6/8 6/22 7/6 7/20
Index
Nasdaq Composite-Trailing 90 Days
Source: Bloomberg
2,000
2,500
3,000
3,500
4,000
4,500
5,000
5,500
4/27 5/11 5/25 6/8 6/22 7/6 7/20
Index
Shanghai Composite Index-Trailing 90 Days
Source: Bloomberg
300
320
340
360
380
400
420
4/27 5/11 5/25 6/8 6/22 7/6 7/20
Index
Euro Stoxx Index-Trailing 90 Days
Source: Bloomberg
17,000
17,200
17,400
17,600
17,800
18,000
18,200
18,400
4/27 5/11 5/25 6/8 6/22 7/6 7/20
Index
Dow Jones Industrial Average -Trailing 90 Days
Source: Bloomberg
Last Change % Chg. YTD % Last Change % Chg. YTD %
S&P 500 2,079.65 -46.99 -2.21% 1.01% Swiss Market Index 9,322.97 -123.20 -1.30% 3.78%
Dow Industrials 17,568.53 -517.92 -2.86% -1.43% CAC 40 Index (France) 5,057.36 -67.03 -1.31% 18.36%
Nasdaq Composite 5,088.63 -121.51 -2.33% 7.44% DAX Index (Germany) 11,347.45 -325.97 -2.79% 15.72%
Russell Global 1,792.67 -19.17 -1.07% 2.6% Irish Overall Index 6,482.53 1.66 0.03% 24.08%
Russell Global EM 2,962.90 -49.37 -1.67% -2.3% Nikkei 225 20,544.53 -55.59 -0.27% 17.73%
S&P/TSX (Canada) 14,186.24 -456.60 -3.12% -3.05% Hang Seng Index 25,128.51 -286.76 -1.13% 6.45%
Mexico IPC 44,249.49 -1075.89 -2.37% 2.56% Shanghai Composite 4,070.91 113.56 2.87% 25.85%
Brazil Bovespa 49,245.85 -3095.95 -5.91% -1.52% Kospi Index (S. Korea) 2,045.96 -30.83 -1.48% 6.81%
Euro Stoxx 600 394.64 -11.04 -2.72% 15.21% Taiwan Taiex Index 8,767.86 -278.12 -3.07% -5.80%
FTSE 100 6,579.81 -195.27 -2.88% 0.21% Tel Aviv 25 Index 1,702.05 7.98 0.47% 16.18%
IBEX 35 (Spain) 11,309.30 -171.40 -1.49% 10.02% MICEX Index (Russia) 1,595.61 -54.47 -3.30% 14.25%
WORLD MARKET PERFORMANCE
Source: Bloomberg; Index %change is based on price.
PMC Weekly Market Review July 24, 2015
EQUITIES – EMERGING AND FRONTIER MARKETS
7
Last Change % Chg. YTD % Last Change % Chg. YTD %
Mexico IPC 44,249.49 -1075.89 -2.4% 2.6% Hang Seng Index 25,128.51 -286.76 -1.1% 6.5%
Brazil (Bovespa Index) 49,245.85 -3095.95 -5.9% -1.5% India (Sensex 30) 28,112.31 -351.00 -1.2% 2.2%
MICEX Index (Russia) 1,595.61 -54.47 -3.3% 14.2% Malaysia (KLCI Index) 1,720.76 -5.97 -0.3% -2.3%
Czech Republic (Prague) 1,030.83 5.89 0.6% 8.9% Singapore (Straits Times Index) 3,352.65 -0.80 0.0% -0.4%
Turkey (Istanbul) 78,712.06 -4077.71 -4.9% -8.2% Thailand (SET Index) 1,438.08 -41.23 -2.8% -4.0%
Egypt (Hermes Index) 719.14 4.23 0.6% -13.8% Indonesia (Jakarta) 4,856.60 -37.32 -0.8% -7.1%
Kenya (Nairobi 20 Index) 4,500.43 -138.01 -3.0% -12.0% Pakistan (Karachi KSE 100) 35,815.20 -72.46 -0.2% 11.5%
Saudi Arabia (TASI Index) 9,372.74 119.33 1.3% 12.5% Vietnam (Ho Chi Minh) 631.26 2.63 0.4% 15.7%
Lebanon (Beirut BLOM Index) 1,190.61 0.89 0.1% 1.7% Sri Lanka (Colombo) 7,269.05 107.09 1.5% -0.4%
Palestine 480.96 -1.52 -0.3% -4.3% Cambodia (Laos) 1,313.15 -12.80 -1.0% -7.1%
EMERGING AND FRONTIER MARKET PERFORMANCE
Source: Bloomberg; Index %change is based on price.
42,000
44,000
46,000
48,000
50,000
52,000
54,000
56,000
58,000
60,000
4/27 5/11 5/25 6/8 6/22 7/6 7/20
Index
Brazil (Bovespa Index)-Trailing 90 Days
Source: Bloomberg
25,000
25,500
26,000
26,500
27,000
27,500
28,000
28,500
29,000
4/27 5/11 5/25 6/8 6/22 7/6 7/20
Index
India (Sensex Index)-Trailing 90 Days
Source: Bloomberg
400
450
500
550
600
650
700
750
800
850
4/26 5/10 5/24 6/7 6/21 7/5 7/19
Index
Egypt (Hermes Index)-Trailing 90 Days
Source: Bloomberg
3,100
3,150
3,200
3,250
3,300
3,350
3,400
3,450
3,500
3,550
4/27 5/11 5/25 6/8 6/22 7/6 7/20
Index
Singapore (Straits Times Index)-Trailing 90 Days
Source: Bloomberg
PMC Weekly Market Review July 24, 2015
INTEREST RATES
YIELD CURVES
8
Last Change % Chg. YTD % Last Change % Chg. YTD %
2-Yr. U.S. Treasury 0.68% 0 bps NM NM Prime Rate 3.25% 0.00 NM NM
5-Yr. U.S. Treasury 1.62% -5 bps NM NM Fed Funds Rate 0.25% 0.00 NM NM
10-Yr. U.S. Treasury 2.27% -8 bps NM NM Discount Rate 0.75% 0.00 NM NM
30-Yr. U.S. Treasury 2.97% -11 bps NM NM LIBOR (3 Mo.) 0.30% 0 bps NM NM
German 10-Yr. Govt. 0.69% 9 bps NM NM Bond Buyer 40 Muni 4.12% -11 bps NM NM
France 10-Yr. 0.97% 10 bps NM NM Bond Buyer 40 G.O. 3.75% NA NM NM
Italy 10-Yr. 1.87% 5 bps NM NM Bond Buyer 40 Rev. 4.15% NA NM NM
Fed 5-Yr Fwd BE Inf. 2.10% 0 bps NM NM
SELECTED INTEREST RATES
Source: Bloomberg
1M 1Y 3Y 5Y 8Y 10Y 15Y 20Y 30Y
0.00
1.00
2.00
3.00
4.00
5.00
6.00
US Treasury Actives Curve 20150718
US Treasury Actives Curve 20150725
USD US Industrial (BB) BFV Cur 20150725
USD Composite (BBB) BFV Curve 20150725
1.50
1.70
1.90
2.10
2.30
2.50
2.70
1/26 2/26 3/26 4/26 5/26 6/26
Yield%
10-Year Treasury Yield - Trailing 180 Days
Source: Bloomberg
1.00
1.10
1.20
1.30
1.40
1.50
1.60
1.70
1.80
1.90
2.00
1/26 2/26 3/26 4/26 5/26 6/26
Index
BBB/Baa- 10-Yr Treas. Spread Rising Line = Risk Aversion
Source: Bloomberg
Source: Bloomberg
PMC Weekly Market Review July 24, 2015
CURRENCIES
9
88
90
92
94
96
98
100
102
1/26 2/26 3/26 4/26 5/26 6/26
U.S. Dollar Index - Trailing Six Months
Source: Bloomberg
0.80
0.85
0.90
0.95
1.00
1.05
1.10
1.15
1.20
1/26 2/26 3/26 4/26 5/26 6/26
Euro - U.S. Dollars per Euro
Source: Bloomberg
112.00
114.00
116.00
118.00
120.00
122.00
124.00
126.00
128.00
1/26 2/26 3/26 4/26 5/26 6/26
Japanese yen - Yen per U.S. Dollar
Source: Bloomberg
Last Change % Chg. YTD % Last Change % Chg. YTD %
Dollar Index 97.26 -0.601 -0.61% 7.75% Chinese Yuan 6.21 0.000 0.00% -0.06%
Euro 1.10 0.015 1.39% -9.24% Swiss Franc 0.96 0.001 -0.06% 3.35%
Japanese Yen 123.80 -0.290 0.23% -3.25% New Zealand Dollar 0.66 0.005 0.78% -15.63%
British Pound 1.55 -0.009 -0.60% -0.46% Brazilian Real 3.35 0.156 -4.67% -20.54%
Canadian Dollar 1.30 0.007 -0.51% -10.87% Mexican Peso 16.26 0.334 -2.05% -9.28%
SELECTED CURRENCY PERFORMANCE
Source: Bloomberg
6.14
6.16
6.18
6.20
6.22
6.24
6.26
6.28
6.30
1/26 2/26 3/26 4/26 5/26 6/26
Chinese yuan - yuan per U.S. Dollar
Source: Bloomberg
PMC Weekly Market Review July 24, 2015
COMMODITIES
10
40
45
50
55
60
65
1/26 2/26 3/26 4/26 5/26 6/26
$perbarrel
Crude Oil - Light Crude ($ per barrel)
Source: Bloomberg
1,100
1,150
1,200
1,250
1,300
1,350
1/26 2/26 3/26 4/26 5/26 6/26
$perounce
Gold - Spot gold price ($ per ounce)
Source: Bloomberg
5,000
5,200
5,400
5,600
5,800
6,000
6,200
6,400
6,600
1/26 2/25 3/27 4/26 5/26 6/25
Index
Copper
Source: Bloomberg
320
340
360
380
400
420
440
460
1/26 2/26 3/26 4/26 5/26 6/26
$perbushel
Corn - Active Contract
Source: Bloomberg
Last Change % Chg. YTD % Last Change % Chg. YTD %
DJ UBS Comm. Idx. 93.29 -4.28 -4.39% -10.58% Platinum Spot $987.41 -$7.35 -0.74% -18.30%
Rogers Int. Comm. Idx. 2478.52 -92.30 -3.59% -11.25% Corn 402.75 -28.50 -6.61% -4.33%
Crude Oil $48.09 -$3.08 -6.01% -16.30% Wheat 511.75 -42.25 -7.63% -15.38%
Natural Gas $2.78 -$0.09 -3.10% -8.10% Soybeans 965.00 -41.75 -4.15% -4.03%
Gasoline ($/Gal.) $2.73 -$0.03 -0.98% 21.96% Sugar 11.24 -0.72 -6.02% -28.27%
Heating Oil 163.28 -3.13 -1.88% -11.75% Orange Juice 123.00 3.05 2.54% -13.62%
Gold Spot $1,099.61 -$34.38 -3.03% -7.14% Aluminum 1,636.00 -61.00 -3.59% -11.69%
Silver Spot $14.68 -$0.20 -1.37% -6.54% Copper 5,272.50 -207.50 -3.79% -16.31%
Source: Bloomberg; % change is based on price.
SELECTED COMMODITY MARKET PERFORMANCE
PMC Weekly Market Review July 24, 2015
ALTERNATIVE INVESTMENTS
11
1,205
1,210
1,215
1,220
1,225
1,230
1,235
1,240
1,245
1,250
1,255
1,260
4/27 5/11 5/25 6/8 6/22 7/6 7/20
Index
HFRX Global Hedge Fund Index - Trailing 90 Days
Source: Bloomberg
970
975
980
985
990
995
1,000
1,005
4/27 5/11 5/25 6/8 6/22 7/6 7/20
Index
HFRX Equity Market Neutral - Trailing 90 Days
Source: Bloomberg
1,340
1,350
1,360
1,370
1,380
1,390
1,400
1,410
4/27 5/11 5/25 6/8 6/22 7/6 7/20
Index
IQ Fixed Income Beta Arb Index - Trailing 90 Days
Source: Bloomberg
1,150
1,160
1,170
1,180
1,190
1,200
1,210
1,220
1,230
1,240
4/27 5/11 5/25 6/8 6/22 7/6 7/20
Index
HFRX Equity Hedge Index - Trailing 90 Days
Source: Bloomberg
Last Change % Chg. YTD % Last Change % Chg. YTD %
HFRX Global Hedge Fund Index 1241.82 -5.68 -0.46% 1.55% HFRX Distressed Index 1020.05 -4.27 -0.42% 0.60%
HFRX Equity Market Neutral 999.76 0.45 0.04% 1.44% HFRX Merger Arbitrage Index 1670.58 -1.41 -0.08% 4.05%
HFRX Equity Hedge Index 1216.13 -3.89 -0.32% 2.77% HFRX Convertible Arbitrage Index 723.10 -0.35 -0.05% 2.94%
HFRX Event-Driven Index 1533.36 -16.85 -1.10% 0.15% HFRX Macro CTA Index 1201.92 0.22 0.02% 1.07%
HFRX Absolute Return Index 1019.75 0.81 0.08% 2.39% IQ Fixed Income Beta Arb Index 1370.96 4.61 0.34% -1.20%
SELECTED ALTERNATIVE INVESTMENT INDEX PERFORMANCE
Source: Bloomberg; Index % change is based on price.
PMC Weekly Market Review
2.95
3.00
3.05
3.10
3.15
3.20
3.25
3.30
3.35
3.40
1/26 2/26 3/26 4/26 5/26 6/26
Index
S&P 500/MSCI EAFE - Trailing 180 Days
Source: Bloomberg
1.40
1.45
1.50
1.55
1.60
1.65
1.70
1.75
1/26 2/26 3/26 4/26 5/26 6/26
Index
MSCI EAFE/MSCI EM - Trailing 180 Days
Source: Bloomberg
0.36
0.37
0.37
0.38
0.38
0.39
0.39
0.40
0.40
1/26 2/26 3/26 4/26 5/26 6/26
Index
Large Cap/Small Cap - Trailing 180 Days
Source: Bloomberg
0.73
0.74
0.75
0.76
0.77
0.78
0.79
0.80
0.81
0.82
0.83
1/26 2/26 3/26 4/26 5/26 6/26
Index
Growth/Value - Trailing 180 Days
Source: Bloomberg
July 24, 2015
12
PORTFOLIO CONSTRUCTION
3.00
3.50
4.00
4.50
5.00
5.50
6.00
1/26 2/26 3/26 4/26 5/26 6/26
Index
S&P 500/MSCI EM - Trailing 180 Days
Source: Bloomberg
PMC Weekly Market Review
0.300
0.305
0.310
0.315
0.320
0.325
0.330
0.335
0.340
1/26 2/26 3/26 4/26 5/26 6/26
Index High Yield/Inv. Grade Bonds - Trailing 180 Days
Source: Bloomberg
0.192
0.194
0.196
0.198
0.200
0.202
0.204
0.206
0.208
1/26 2/26 3/26 4/26 5/26 6/26
Index
Info Tech/S&P 500 - Trailing 180 Days
Source: Bloomberg
1.72
1.74
1.76
1.78
1.80
1.82
1.84
1.86
1.88
1.90
1/26 2/26 3/26 4/26 5/26 6/26
Index
Inv. Grade Bonds/Int. Govt. Bonds - Trailing 180
Days
Source: Bloomberg
0.57
0.58
0.58
0.59
0.59
0.60
0.60
0.61
0.61
0.62
1/26 2/26 3/26 4/26 5/26 6/26
Index
High Yield Bonds/Int. Govt. Bonds - Trailing 180 Days
Source: Bloomberg
July 24, 2015
13
PORTFOLIO CONSTRUCTION (cont’d.)
PMC Weekly Market Review
14
July 24, 2015
The Relative Strength Matrix provides an indication of how the various asset classes have performed relative to one another
over the past 30 days. A number greater than 1.0 indicates that the asset class in the far left column has outperformed the
corresponding asset class in the top row over the past 30 days. A number below 1.0 means the asset class on the left has
underperformed the asset class at the top. The green shading indicates outperformance, and the red shading indicates
underperformance.
Source: Bloomberg
Large Cap
Core
Large Cap
Growth
Large Cap
Value
Mid Cap
Core
Mid Cap
Growth
Mid Cap
Value
Small Cap
Core
Small Cap
Growth
Small Cap
Value
Int'l.
Developed
Emerging
Markets REITs Comm. Int. Bond High Yield
Large Cap Core 1.00 0.95 1.08 1.13 1.04 1.23 1.09 0.99 1.25 1.04 1.36 1.06 1.42 1.05 1.50
Large Cap Growth 1.06 1.00 1.14 1.19 1.10 1.30 1.15 1.04 1.32 1.10 1.43 1.12 1.50 1.11 1.59
Large Cap Value 0.93 0.88 1.00 1.04 0.96 1.14 1.01 0.91 1.15 0.97 1.26 0.98 1.32 0.97 1.39
Mid Cap Core 0.89 0.84 0.96 1.00 0.92 1.09 0.97 0.88 1.11 0.93 1.21 0.94 1.26 0.93 1.33
Mid Cap Growth 0.96 0.91 1.04 1.08 1.00 1.18 1.05 0.95 1.20 1.00 1.31 1.02 1.37 1.01 1.44
Mid Cap Value 0.81 0.77 0.88 0.92 0.85 1.00 0.89 0.80 1.01 0.85 1.11 0.86 1.16 0.85 1.22
Small Cap Core 0.92 0.87 0.99 1.04 0.96 1.13 1.00 0.91 1.15 0.96 1.25 0.97 1.31 0.96 1.38
Small Cap Growth 1.01 0.96 1.09 1.14 1.05 1.24 1.10 1.00 1.26 1.06 1.38 1.07 1.44 1.06 1.52
Small Cap Value 0.80 0.76 0.87 0.90 0.83 0.99 0.87 0.79 1.00 0.84 1.09 0.85 1.14 0.84 1.21
Int'l. Developed 0.96 0.91 1.04 1.08 1.00 1.18 1.04 0.95 1.20 1.00 1.30 1.02 1.36 1.01 1.44
Emerging Markets 0.74 0.70 0.79 0.83 0.77 0.90 0.80 0.73 0.92 0.77 1.00 0.78 1.05 0.77 1.11
REITs 0.95 0.89 1.02 1.06 0.98 1.16 1.03 0.93 1.18 0.98 1.28 1.00 1.34 0.99 1.42
Commodities 0.70 0.67 0.76 0.79 0.73 0.86 0.77 0.69 0.88 0.73 0.96 0.74 1.00 0.74 1.06
Int. Bond 0.95 0.90 1.03 1.07 0.99 1.17 1.04 0.94 1.19 0.99 1.30 1.01 1.36 1.00 1.43
High Yield 0.67 0.63 0.72 0.75 0.69 0.82 0.72 0.66 0.83 0.69 0.90 0.70 0.95 0.70 1.00
RELATIVE STRENGTH MATRIX (BASED ON 30-DAY RSI)
5/7 5/14 5/21 5/28 6/4 6/11 6/18 6/25 7/2 7/9 7/16 7/23
Large Cap
(R200)
0.08% 1.65% 0.43% -0.49% -1.18% 0.66% 0.56% -0.85% -1.14% -1.23% 3.86% -0.95%
Small Cap
(R2000)
0.44% 1.60% 0.93% -0.29% -0.14% 1.41% 1.24% -0.11% -2.73% -1.13% 3.13% -2.19%
MSCI EAFE -1.32% 2.61% 0.31% -1.79% -0.52% -0.42% -0.75% 1.53% -2.81% -2.17% 4.28% -0.89%
MSCI Em.
Mkts.
-2.18% 1.06% -0.30% -2.24% -2.13% -1.14% 0.08% 1.08% -1.69% -5.32% 2.38% -1.93%
BarCap Agg.
(AGG)
-0.84% -0.17% 0.15% 0.20% -1.00% -0.29% 0.15% -0.37% -0.03% 0.37% -0.06% 0.33%
High Yield
(JNK)
-0.63% 0.56% -0.20% 0.13% -1.24% -0.26% -0.15% -0.05% -0.88% -0.73% 0.66% -1.36%
DJ UBS Index -0.62% 2.32% -1.65% -3.46% -0.10% 1.44% -0.88% 0.30% 0.96% -2.77% -0.97% -3.76%
Hedge Funds
(HFRX Global)
-0.39% 0.27% 0.47% 0.00% -0.24% 0.04% -0.17% 0.08% -1.02% -0.59% 1.21% -0.36%
60/40* -0.57% 1.07% 0.30% -0.48% -0.96% 0.10% 0.23% -0.11% -1.17% -0.98% 2.25% -0.69%
48/32/20
(w/Alts.)**
-0.53% 0.91% 0.33% -0.39% -0.82% 0.09% 0.15% -0.07% -1.14% -0.90% 2.04% -0.62%
Source: Bloomberg; *60/40 portfolio =30% Large Cap/10% Small Cap/15% EAFE/5% Emerging Markets/35% BarCap Agg./5% High Yield.
**48/32/20 portfolio =24% Large Cap/8% Small Cap/12% EAFE/4% Emerging Markets/28% BarCap Agg./4% High Yield/20% HFRX Global Index.
WEEKLY ASSET CLASS PERFORMANCE (Prior 12 weeks ending Thursday)
Alternatives
Asset Allocation
Domestic
Equity
Int'l.
Equity
Fixed Income
Commodities
Equity
PMC Weekly Market Review July 24, 2015
15
INDEX OVERVIEW & KEY DEFINITIONS
Fed, The Fed or FED refers to the Federal Reserve System, the central bank of the United States. The Federal Open Market Committee (FOMC) is the monetary
policymaking body of the Federal Reserve System. Fed Funds Rate, the interest rate at which a depository institution lends funds maintained at the Federal Reserve
to another depository institution overnight. The European Central Bank (ECB) is the central bank for Europe's single currency, the euro. The ECB’s main task is to
maintain the euro's purchasing power and thus price stability in the euro area. The euro area comprises the 19 European Union countries that have introduced the
euro since 1999. The Gross Domestic Product (GDP) rate is a measurement of the output of goods and services produced by labor and property located in the
United States. Basis Point(s) is a unit that is equal to 1/100th of 1%, and is used to denote the change in a financial instrument. The basis point is commonly used for
calculating changes in interest rates, equity indexes and the yield of a fixed-income security. A separately managed account (SMA) is an individual managed
investment account offered typically by a brokerage firm through one of their brokers or financial consultants and managed by independent investment
management firms (often called money managers for short) and have varying fee structures. The Consumer Price Index (CPI) measures the change in the cost of a
fixed basket of products and services. The Producer Price Index (PPI) program measures the average change over time in the selling prices received by domestic
producers for their output. The prices included in the PPI are from the first commercial transaction for many products and some services.
The Dow Jones Industrial Average (DOW or DJIA) is an unmanaged index of 30 common stocks comprised of 30 actively traded blue chip stocks, primarily industrials
and assumes reinvestment of dividends. The S&P 500 Index is an unmanaged index comprised of 500 widely held securities considered to be representative of the
stock market in general. The S&P/Case-Shiller Home Price Indices measure the residential housing market, tracking changes in the value of the residential real
estate market in 20 metropolitan regions across the United States. The Nasdaq Composite Index is a stock market index of the common stocks and similar securities
listed on the NASDAQ stock market. The US Dollar Index is a measure of the value of the United States dollar relative to a basket of foreign currencies. It is a
weighted geometric mean of the dollar's value relative to other select currencies (Euro, Japanese yen, Pound sterling, Canadian dollar, Swedish krona (SEK) & Swiss
franc). The Nikkei Index (Nikkei 225 or Nikkei) is a stock market index for the Tokyo Stock Exchange calculated daily by the Nihon Keizai Shimbun (Nikkei) newspaper
since 1950. It is a price-weighted index (the unit is yen), and the components are reviewed once a year. The FTSE 100 Index (FTSE 100) is a share index of the 100
companies listed on the London Stock Exchange (LSE) with the highest market capitalization. The Bloomberg Commodity Index (formerly the Dow Jones-UBS
Commodity Index) tracks prices of futures contracts on physical commodities on the commodity markets and is designed to minimize concentration in any one
commodity or sector (currently 22 commodity futures in seven sectors). The Barclays Capital US Credit Index is an unmanaged index considered representative of
publicly issued, SEC-registered US corporate and specified foreign debentures and secured notes. The Barclays Capital US Aggregate Bond Index is a market
capitalization-weighted index of investment-grade, fixed-rate debt issues, including government, corporate, asset-backed, and mortgage-backed securities, with
maturities of at least one year. The Barclays Capital US Corporate High Yield Index covers the USD-denominated, non-investment grade, fixed-rate, taxable
corporate bond market. Securities are classified as high-yield if the middle rating of Moody’s, Fitch and S&P is Ba1/BB+/BB+ or below. The index may include
emerging market debt. The Barclays Capital Municipal Bond Index is an unmanaged index comprised of investment-grade, fixed-rate municipal securities
representative of the tax-exempt bond market in general. The Barclays Capital US Treasury Total Return Index is an unmanaged index of public obligations of the US
Treasury with a remaining maturity of one year or more. The Barclays Capital Global Aggregate ex-U.S. Index is a market capitalization-weighted index, meaning the
securities in the index are weighted according to the market size of each bond type. Most U.S. traded investment grade bonds are represented. Municipal bonds,
and Treasury Inflation-Protected Securities are excluded, due to tax treatment issues. The index includes Treasury securities, Government agency bonds, Mortgage-
backed bonds, Corporate bonds, and a small amount of foreign bonds traded in U.S. The Barclays Capital U.S. 5-10 Year Corporate Bond Index measures the
investment return of U.S. dollar denominated, investment-grade, fixed rate, taxable securities issued by industrial, utility, and financial companies with maturities
between 5 and 10 years. Treasury securities, mortgage-backed securities (MBS) foreign bonds, government agency bonds and corporate bonds are some of the
categories included in the index. The Barclays Capital U.S Corporate High-Yield Index is composed of fixed-rate, publicly issued, non-investment grade debt. The
Barclays Capital U.S. Corporate 5-10 Year Index includes U.S. dollar-denominated, investment-grade, fixed-rate, taxable securities issued by industrial, utility, &
financial companies, with maturities between 5 & 10 years. The Citigroup World Government Bond Index measures the performance of fixed-rate, local currency,
investment grade sovereign bonds and comprises sovereign debt from over 20 countries, denominated in a variety of currencies. The DJ-UBS Commodity Index
Total Return SM measures the collateralized returns from a basket of 19 commodity futures contracts representing the energy, precious metals, industrial metals,
grains, softs and livestock sectors. The Russell 1000 Index is a market capitalization-weighted benchmark index made up of the 1000 largest U.S. companies in the
Russell 3000 Index. The Russell 1000 Growth Index is an unmanaged index considered representative of large-cap growth stocks. The Russell 1000 Value Index is an
unmanaged index considered representative of large-cap value stocks. The Russell 2000 Index is an unmanaged index considered representative of small-cap stocks.
The Russell 2000 Growth Index is an unmanaged index considered representative of small-cap growth stocks. The Russell 2000 Growth Index is an unmanaged index
considered representative of small-cap value stocks. The Russell 3000 Index is an unmanaged index considered representative of the US stock market. The Russell
Midcap Index is a subset of the Russell 1000 Index. It includes approximately 800 of the smallest securities based on a combination of their market cap and current
index membership. The Russell Midcap Growth Index is an unmanaged index considered representative of mid-cap growth stocks. The Russell Midcap Value Index
is an unmanaged index considered representative of mid-cap value stocks. The HFRX Indices are a series of benchmarks of hedge fund industry performance which
are engineered to achieve representative performance of a larger universe of hedge fund strategies. Hedge Fund Research, Inc. employs the HFRX Methodology
(UCITS compliant), a proprietary and highly quantitative process by which hedge funds are selected as constituents for the HFRX Indices. The University of Michigan
Consumer Sentiment Index (MCSI) is a survey of consumer confidence conducted by the University of Michigan using telephone surveys to gather information on
consumer expectations regarding the overall economy. The ISM Non-Manufacturing Index is an index based on surveys of more than 400 non-manufacturing firms'
purchasing and supply executives, within 60 sectors across the nation, by the Institute of Supply Management (ISM). The ISM Non-Manufacturing Index tracks
economic data, like the ISM Non-Manufacturing Business Activity Index. A composite diffusion index is created based on the data from these surveys that monitors
economic conditions of the nation. The ISM Manufacturing Index is an index based on surveys of more than 300 manufacturing firms by the Institute of Supply
Management – the index monitors employment, production inventories, new orders and supplier deliveries. A composite diffusion index is created that monitors
conditions in national manufacturing based on the data from these surveys. The CBOE Volatility Index (VIX) is an up-to-the-minute market estimate of expected
volatility that is calculated by using real-time S&P 500 Index option bid/ask quotes. The Index uses nearby and second nearby options with at least 8 days left to
expiration and then weights them to yield a constant, 30-day measure of the expected volatility of the S&P 500 Index. The MSCI EAFE Index is designed to measure
the equity market performance of developed markets outside of the U.S. & Canada. The MSCI EAFE Growth Index is an unmanaged index considered representative
of growth stocks of Europe, Australasia and the Far East. The MSCI EAFE Value Index is an unmanaged index considered representative of value stocks of Europe,
Australasia and the Far East. The MSCI EM (Emerging Markets) Latin America Index is a free float-adjusted market capitalization weighted index that is designed to
measure the equity market performance of emerging markets in Latin America. The MSCI World ex-U.S. Index captures large and mid-cap representation across 22
of 23 Developed Markets (DM) countries - excluding the US. With 1,002 constituents, the index covers approximately 85% of the free float-adjusted market
capitalization in each country. (DM countries include: Australia, Austria, Belgium, Canada, Denmark, Finland, France, Germany, Hong Kong, Ireland, Israel, Italy,
Japan, Netherlands, New Zealand, Norway, Portugal, Singapore, Spain, Sweden, Switzerland and the UK.) The MSCI Japan Index is designed to measure the
performance of the large and mid-cap segments of the Japanese market. With 320 constituents, the index covers approximately 85% of the free float-adjusted
market capitalization in Japan. The MSCI Emerging Markets Index is a free float-adjusted market capitalization index that is designed to measure equity market
performance in the global emerging markets. The MSCI Europe Index is an unmanaged index considered representative of stocks of developed European countries.
The MSCI Pacific Index is a free float-adjusted market capitalization weighted index that is designed to measure the equity market performance of the developed
markets in the Pacific region.
(07/17/15)
PMC Weekly Market Review July 24, 2015
16
The information, analysis, and opinions expressed herein are for general and educational purposes only. Nothing contained in this
weekly review is intended to constitute legal, tax, accounting, securities, or investment advice, nor an opinion regarding the
appropriateness of any investment, nor a solicitation of any type. All investments carry a certain risk, and there is no assurance that
an investment will provide positive performance over any period of time. An investor may experience loss of principal. Investment
decisions should always be made based on the investor’s specific financial needs and objectives, goals, time horizon, and risk
tolerance. The asset classes and/or investment strategies described may not be suitable for all investors and investors should
consult with an investment advisor to determine the appropriate investment strategy. Past performance is not indicative of future
results.
Information obtained from third party sources are believed to be reliable but not guaranteed. Envestnet|PMC™ makes no
representation regarding the accuracy or completeness of information provided herein. All opinions and views constitute our
judgments as of the date of writing and are subject to change at any time without notice.
Investments in smaller companies carry greater risk than is customarily associated with larger companies for various reasons such
as volatility of earnings and prospects, higher failure rates, and limited markets, product lines or financial resources. Investing
overseas involves special risks, including the volatility of currency exchange rates and, in some cases, limited geographic focus,
political and economic instability, and relatively illiquid markets. Income (bond) securities are subject to interest rate risk, which is
the risk that debt securities in a portfolio will decline in value because of increases in market interest rates.
Exchange Traded Funds (ETFs) are subject to risks similar to those of stocks, such as market risk. Investing in ETFs may bear indirect
fees and expenses charged by ETFs in addition to its direct fees and expenses, as well as indirectly bearing the principal risks of
those ETFs. ETFs may trade at a discount to their net asset value and are subject to the market fluctuations of their underlying
investments. Investing in commodities can be volatile and can suffer from periods of prolonged decline in value and may not be
suitable for all investors.
Index Performance is presented for illustrative purposes only and does not represent the performance of any specific investment
product or portfolio. An investment cannot be made directly into an index.
Alternative Investments may have complex terms and features that are not easily understood and are not suitable for all investors.
You should conduct your own due diligence to ensure you understand the features of the product before investing. Alternative
investment strategies may employ a variety of hedging techniques and non-traditional instruments such as inverse and leveraged
products. Certain hedging techniques include matched combinations that neutralize or offset individual risks such as merger
arbitrage, long/short equity, convertible bond arbitrage and fixed-income arbitrage. Leveraged products are those that employ
financial derivatives and debt to try to achieve a multiple (for example two or three times) of the return or inverse return of a
stated index or benchmark over the course of a single day. Inverse products utilize short selling, derivatives trading, and other
leveraged investment techniques, such as futures trading to achieve their objectives, mainly to track the inverse of their
benchmarks. As with all investments, there is no assurance that any investment strategies will achieve their objectives or protect
against losses.
Neither Envestnet, Envestnet|PMC™ nor its representatives render tax, accounting or legal advice. Any tax statements contained
herein are not intended or written to be used, and cannot be used, for the purpose of avoiding U.S. federal, state, or local tax
penalties. Taxpayers should always seek advice based on their own particular circumstances from an independent tax advisor.
© 2015 Envestnet Asset Management, Inc. All rights reserved.
ABOUT ENVESTNET®
Envestnet, Inc. (NYSE: ENV) is a leading provider of unified wealth management technology and services to investment advisors.
Our open-architecture platforms unify and fortify the wealth management process, delivering unparalleled flexibility, accuracy,
performance and value. Envestnet solutions enable the transformation of wealth management into a transparent, objective,
independent and fully-aligned standard of care, and empower advisors to deliver better results.
Envestnet's Advisor Suite® software empowers financial advisors to better manage client outcomes and strengthen their practice.
Envestnet provides institutional-quality research and advanced portfolio solutions through our Portfolio Management Consultants
group, Envestnet | PMC®. Envestnet | Tamarac provides leading rebalancing, reporting and practice management software.
For more information on Envestnet, please visit www.envestnet.com.
07.17.15

Más contenido relacionado

La actualidad más candente

Will this risk rally be derailed in March?
Will this risk rally be derailed in March?Will this risk rally be derailed in March?
Will this risk rally be derailed in March?Hantec Markets
 
Before the Open June 12 2017
Before the Open June 12 2017Before the Open June 12 2017
Before the Open June 12 2017John Pendrith
 
Current Thinking, Q1 2015
Current Thinking, Q1 2015Current Thinking, Q1 2015
Current Thinking, Q1 2015Kevin Lenox
 
US dollar strengthening once more as focus remains on the data this week
US dollar strengthening once more as focus remains on the data this weekUS dollar strengthening once more as focus remains on the data this week
US dollar strengthening once more as focus remains on the data this weekHantec Markets
 
WEEKLY ANALYSIS REPORT 20 JULY - 24 JULY, 2020
WEEKLY ANALYSIS REPORT 20 JULY - 24 JULY, 2020WEEKLY ANALYSIS REPORT 20 JULY - 24 JULY, 2020
WEEKLY ANALYSIS REPORT 20 JULY - 24 JULY, 2020TPGlobalFX
 
Trump's tariffs driving a significant impact through markets
Trump's tariffs driving a significant impact through marketsTrump's tariffs driving a significant impact through markets
Trump's tariffs driving a significant impact through marketsHantec Markets
 
Newsletter 102615 Final Volume 1 Issue 18
Newsletter 102615 Final Volume 1 Issue 18Newsletter 102615 Final Volume 1 Issue 18
Newsletter 102615 Final Volume 1 Issue 18Jonathan M. Lamb
 
Newsletter 08302016 Final Volume 2 Issue 6
Newsletter 08302016 Final Volume 2 Issue 6Newsletter 08302016 Final Volume 2 Issue 6
Newsletter 08302016 Final Volume 2 Issue 6Jonathan M. Lamb
 
The magnificienty 7 and equity markets review 8
The magnificienty 7 and equity markets   review 8The magnificienty 7 and equity markets   review 8
The magnificienty 7 and equity markets review 8Markets Beyond
 
Final Paper Submission
Final Paper SubmissionFinal Paper Submission
Final Paper SubmissionMike Farkas
 
Dollar still gains despite geopolitics impacting markets once more
Dollar still gains despite geopolitics impacting markets once moreDollar still gains despite geopolitics impacting markets once more
Dollar still gains despite geopolitics impacting markets once moreRichard Perry
 
Epic research daily commodity report 16 march 2015
Epic research daily commodity report  16 march 2015Epic research daily commodity report  16 march 2015
Epic research daily commodity report 16 march 2015Epic Research Limited
 
The Swedish Economy, No. 3, 31 March 2011
The Swedish Economy, No. 3, 31 March 2011 The Swedish Economy, No. 3, 31 March 2011
The Swedish Economy, No. 3, 31 March 2011 Swedbank
 
Weekly outlook may 11 2015
Weekly outlook   may 11   2015Weekly outlook   may 11   2015
Weekly outlook may 11 2015Hantec Markets
 
Energy Industry Report: Energy Perspectives - January 2015
Energy Industry Report: Energy Perspectives - January 2015Energy Industry Report: Energy Perspectives - January 2015
Energy Industry Report: Energy Perspectives - January 2015Duff & Phelps
 

La actualidad más candente (20)

Will this risk rally be derailed in March?
Will this risk rally be derailed in March?Will this risk rally be derailed in March?
Will this risk rally be derailed in March?
 
Before the Open June 12 2017
Before the Open June 12 2017Before the Open June 12 2017
Before the Open June 12 2017
 
Current Thinking, Q1 2015
Current Thinking, Q1 2015Current Thinking, Q1 2015
Current Thinking, Q1 2015
 
US dollar strengthening once more as focus remains on the data this week
US dollar strengthening once more as focus remains on the data this weekUS dollar strengthening once more as focus remains on the data this week
US dollar strengthening once more as focus remains on the data this week
 
WEEKLY ANALYSIS REPORT 20 JULY - 24 JULY, 2020
WEEKLY ANALYSIS REPORT 20 JULY - 24 JULY, 2020WEEKLY ANALYSIS REPORT 20 JULY - 24 JULY, 2020
WEEKLY ANALYSIS REPORT 20 JULY - 24 JULY, 2020
 
Trump's tariffs driving a significant impact through markets
Trump's tariffs driving a significant impact through marketsTrump's tariffs driving a significant impact through markets
Trump's tariffs driving a significant impact through markets
 
2017 Economic Outlook
2017 Economic Outlook2017 Economic Outlook
2017 Economic Outlook
 
Newsletter 102615 Final Volume 1 Issue 18
Newsletter 102615 Final Volume 1 Issue 18Newsletter 102615 Final Volume 1 Issue 18
Newsletter 102615 Final Volume 1 Issue 18
 
Newsletter 08302016 Final Volume 2 Issue 6
Newsletter 08302016 Final Volume 2 Issue 6Newsletter 08302016 Final Volume 2 Issue 6
Newsletter 08302016 Final Volume 2 Issue 6
 
The magnificienty 7 and equity markets review 8
The magnificienty 7 and equity markets   review 8The magnificienty 7 and equity markets   review 8
The magnificienty 7 and equity markets review 8
 
Final Paper Submission
Final Paper SubmissionFinal Paper Submission
Final Paper Submission
 
2016_Outlook
2016_Outlook2016_Outlook
2016_Outlook
 
Looking Bach 1508
Looking Bach 1508Looking Bach 1508
Looking Bach 1508
 
Dollar still gains despite geopolitics impacting markets once more
Dollar still gains despite geopolitics impacting markets once moreDollar still gains despite geopolitics impacting markets once more
Dollar still gains despite geopolitics impacting markets once more
 
PMCWeeklyReview_082115
PMCWeeklyReview_082115PMCWeeklyReview_082115
PMCWeeklyReview_082115
 
Epic research daily commodity report 16 march 2015
Epic research daily commodity report  16 march 2015Epic research daily commodity report  16 march 2015
Epic research daily commodity report 16 march 2015
 
aa_sp15
aa_sp15aa_sp15
aa_sp15
 
The Swedish Economy, No. 3, 31 March 2011
The Swedish Economy, No. 3, 31 March 2011 The Swedish Economy, No. 3, 31 March 2011
The Swedish Economy, No. 3, 31 March 2011
 
Weekly outlook may 11 2015
Weekly outlook   may 11   2015Weekly outlook   may 11   2015
Weekly outlook may 11 2015
 
Energy Industry Report: Energy Perspectives - January 2015
Energy Industry Report: Energy Perspectives - January 2015Energy Industry Report: Energy Perspectives - January 2015
Energy Industry Report: Energy Perspectives - January 2015
 

Destacado

Outdoor Advertising Options in Vellore - Hoarding Options in Vellore
Outdoor Advertising Options in Vellore - Hoarding Options in VelloreOutdoor Advertising Options in Vellore - Hoarding Options in Vellore
Outdoor Advertising Options in Vellore - Hoarding Options in VellorePan India Hoardings
 
Preferences Specification
Preferences SpecificationPreferences Specification
Preferences SpecificationHagan Rivers
 
Nora Möttönen_mastersthesis_abstract
Nora Möttönen_mastersthesis_abstractNora Möttönen_mastersthesis_abstract
Nora Möttönen_mastersthesis_abstractNora Möttönen
 
Hildamar CummingsResume
Hildamar CummingsResumeHildamar CummingsResume
Hildamar CummingsResumeHilda Cummings
 
Take Action on Care Coordination: Webinar April 13, 2016
Take Action on Care Coordination: Webinar April 13, 2016Take Action on Care Coordination: Webinar April 13, 2016
Take Action on Care Coordination: Webinar April 13, 2016LucilePackardFoundation
 
Communication
CommunicationCommunication
CommunicationUtchi
 
HLEG thematic workshop on "Intra-generational and Inter-generational Sustaina...
HLEG thematic workshop on "Intra-generational and Inter-generational Sustaina...HLEG thematic workshop on "Intra-generational and Inter-generational Sustaina...
HLEG thematic workshop on "Intra-generational and Inter-generational Sustaina...StatsCommunications
 
Strategic Workforce Planning Masterclass Brochure 2015
Strategic Workforce Planning Masterclass Brochure 2015Strategic Workforce Planning Masterclass Brochure 2015
Strategic Workforce Planning Masterclass Brochure 2015Kienco
 
Aprendisaje autónomo
Aprendisaje autónomoAprendisaje autónomo
Aprendisaje autónomoSaul Solis
 
Cuadrado En El Pais Redondo
Cuadrado En El Pais RedondoCuadrado En El Pais Redondo
Cuadrado En El Pais Redondomarenas
 

Destacado (16)

Spaun uniseqc
Spaun uniseqcSpaun uniseqc
Spaun uniseqc
 
CKimmet CV April 2016
CKimmet CV April 2016CKimmet CV April 2016
CKimmet CV April 2016
 
Outdoor Advertising Options in Vellore - Hoarding Options in Vellore
Outdoor Advertising Options in Vellore - Hoarding Options in VelloreOutdoor Advertising Options in Vellore - Hoarding Options in Vellore
Outdoor Advertising Options in Vellore - Hoarding Options in Vellore
 
Preferences Specification
Preferences SpecificationPreferences Specification
Preferences Specification
 
Anluan SA
Anluan SAAnluan SA
Anluan SA
 
Nora Möttönen_mastersthesis_abstract
Nora Möttönen_mastersthesis_abstractNora Möttönen_mastersthesis_abstract
Nora Möttönen_mastersthesis_abstract
 
Hildamar CummingsResume
Hildamar CummingsResumeHildamar CummingsResume
Hildamar CummingsResume
 
Take Action on Care Coordination: Webinar April 13, 2016
Take Action on Care Coordination: Webinar April 13, 2016Take Action on Care Coordination: Webinar April 13, 2016
Take Action on Care Coordination: Webinar April 13, 2016
 
Tectonic plates
Tectonic platesTectonic plates
Tectonic plates
 
Communication
CommunicationCommunication
Communication
 
HLEG thematic workshop on "Intra-generational and Inter-generational Sustaina...
HLEG thematic workshop on "Intra-generational and Inter-generational Sustaina...HLEG thematic workshop on "Intra-generational and Inter-generational Sustaina...
HLEG thematic workshop on "Intra-generational and Inter-generational Sustaina...
 
Strategic Workforce Planning Masterclass Brochure 2015
Strategic Workforce Planning Masterclass Brochure 2015Strategic Workforce Planning Masterclass Brochure 2015
Strategic Workforce Planning Masterclass Brochure 2015
 
Aprendisaje autónomo
Aprendisaje autónomoAprendisaje autónomo
Aprendisaje autónomo
 
Médias sociaux et communication touristique '' Soutenance''
Médias sociaux et communication touristique '' Soutenance'' Médias sociaux et communication touristique '' Soutenance''
Médias sociaux et communication touristique '' Soutenance''
 
Cuadrado En El Pais Redondo
Cuadrado En El Pais RedondoCuadrado En El Pais Redondo
Cuadrado En El Pais Redondo
 
Pronosticos de Demanda
Pronosticos de DemandaPronosticos de Demanda
Pronosticos de Demanda
 

Similar a PMCWeeklyReview_072415

Before the Open April 12 2017
Before the Open April 12 2017Before the Open April 12 2017
Before the Open April 12 2017John Pendrith
 
Before the Open April 11 2017
Before the Open April 11 2017Before the Open April 11 2017
Before the Open April 11 2017John Pendrith
 
Before the Open March 30 2017
Before the Open March 30 2017Before the Open March 30 2017
Before the Open March 30 2017John Pendrith
 
Before the Open June 14 2017
Before the Open June 14 2017Before the Open June 14 2017
Before the Open June 14 2017John Pendrith
 
Special report 10 apr 2019 epic research
Special report 10 apr 2019 epic researchSpecial report 10 apr 2019 epic research
Special report 10 apr 2019 epic researchEpic Research
 
Before the Open April 17 2017
Before the Open April 17 2017Before the Open April 17 2017
Before the Open April 17 2017John Pendrith
 
Before the Open July 18 2017
Before the Open July 18 2017Before the Open July 18 2017
Before the Open July 18 2017John Pendrith
 
Before the Open August 11 2017
Before the Open August 11 2017Before the Open August 11 2017
Before the Open August 11 2017John Pendrith
 
Before the Open April 27 2017
Before the Open April 27 2017Before the Open April 27 2017
Before the Open April 27 2017John Pendrith
 
Before the open february 14 2017
Before the open february 14 2017Before the open february 14 2017
Before the open february 14 2017John Pendrith
 
Before the Open June 2 2017
Before the Open June 2 2017Before the Open June 2 2017
Before the Open June 2 2017John Pendrith
 
Special report-27-feb-2019-epic-research
Special report-27-feb-2019-epic-researchSpecial report-27-feb-2019-epic-research
Special report-27-feb-2019-epic-researchEpic Research Limited
 
Before the open February 22 2017
Before the open February 22 2017Before the open February 22 2017
Before the open February 22 2017John Pendrith
 
Special report-13-feb-2019-epic-research
Special report-13-feb-2019-epic-researchSpecial report-13-feb-2019-epic-research
Special report-13-feb-2019-epic-researchEpic Research Limited
 

Similar a PMCWeeklyReview_072415 (20)

Before the Open April 12 2017
Before the Open April 12 2017Before the Open April 12 2017
Before the Open April 12 2017
 
Before the Open April 11 2017
Before the Open April 11 2017Before the Open April 11 2017
Before the Open April 11 2017
 
Global Economics Report - September 2014
Global Economics Report - September 2014Global Economics Report - September 2014
Global Economics Report - September 2014
 
PMCWeeklyReview_050815
PMCWeeklyReview_050815PMCWeeklyReview_050815
PMCWeeklyReview_050815
 
Before the Open March 30 2017
Before the Open March 30 2017Before the Open March 30 2017
Before the Open March 30 2017
 
Before the Open June 14 2017
Before the Open June 14 2017Before the Open June 14 2017
Before the Open June 14 2017
 
Special report 10 apr 2019 epic research
Special report 10 apr 2019 epic researchSpecial report 10 apr 2019 epic research
Special report 10 apr 2019 epic research
 
Before the Open April 17 2017
Before the Open April 17 2017Before the Open April 17 2017
Before the Open April 17 2017
 
Weekly Market Review - August 9, 2013
Weekly Market Review - August 9, 2013Weekly Market Review - August 9, 2013
Weekly Market Review - August 9, 2013
 
Before the Open July 18 2017
Before the Open July 18 2017Before the Open July 18 2017
Before the Open July 18 2017
 
Global Economics Update - July 2015
Global Economics Update - July 2015Global Economics Update - July 2015
Global Economics Update - July 2015
 
Global Economics Update - November 2014
Global Economics Update - November 2014Global Economics Update - November 2014
Global Economics Update - November 2014
 
Before the Open August 11 2017
Before the Open August 11 2017Before the Open August 11 2017
Before the Open August 11 2017
 
Global Economics Update - December 2014
Global Economics Update - December 2014Global Economics Update - December 2014
Global Economics Update - December 2014
 
Before the Open April 27 2017
Before the Open April 27 2017Before the Open April 27 2017
Before the Open April 27 2017
 
Before the open february 14 2017
Before the open february 14 2017Before the open february 14 2017
Before the open february 14 2017
 
Before the Open June 2 2017
Before the Open June 2 2017Before the Open June 2 2017
Before the Open June 2 2017
 
Special report-27-feb-2019-epic-research
Special report-27-feb-2019-epic-researchSpecial report-27-feb-2019-epic-research
Special report-27-feb-2019-epic-research
 
Before the open February 22 2017
Before the open February 22 2017Before the open February 22 2017
Before the open February 22 2017
 
Special report-13-feb-2019-epic-research
Special report-13-feb-2019-epic-researchSpecial report-13-feb-2019-epic-research
Special report-13-feb-2019-epic-research
 

PMCWeeklyReview_072415

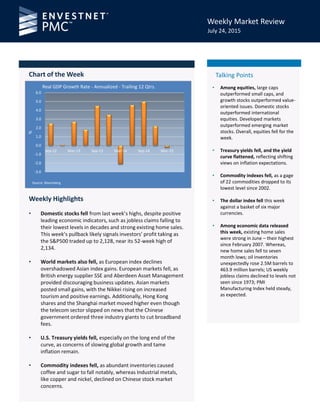
  • 1. Weekly Market Review Talking Points Weekly Highlights • Domestic stocks fell from last week’s highs, despite positive leading economic indicators, such as jobless claims falling to their lowest levels in decades and strong existing home sales. This week’s pullback likely signals investors’ profit taking as the S&P500 traded up to 2,128, near its 52-week high of 2,134. • World markets also fell, as European index declines overshadowed Asian index gains. European markets fell, as British energy supplier SSE and Aberdeen Asset Management provided discouraging business updates. Asian markets posted small gains, with the Nikkei rising on increased tourism and positive earnings. Additionally, Hong Kong shares and the Shanghai market moved higher even though the telecom sector slipped on news that the Chinese government ordered three industry giants to cut broadband fees. • U.S. Treasury yields fell, especially on the long end of the curve, as concerns of slowing global growth and tame inflation remain. • Commodity indexes fell, as abundant inventories caused coffee and sugar to fall notably, whereas Industrial metals, like copper and nickel, declined on Chinese stock market concerns. Chart of the Week July 24, 2015 • Among equities, large caps outperformed small caps, and growth stocks outperformed value- oriented issues. Domestic stocks outperformed international equities. Developed markets outperformed emerging market stocks. Overall, equities fell for the week. • Treasury yields fell, and the yield curve flattened, reflecting shifting views on inflation expectations. • Commodity indexes fell, as a gage of 22 commodities dropped to its lowest level since 2002. • The dollar index fell this week against a basket of six major currencies. • Among economic data released this week, existing home sales were strong in June – their highest since February 2007. Whereas, new home sales fell to seven month lows; oil inventories unexpectedly rose 2.5M barrels to 463.9 million barrels; US weekly jobless claims declined to levels not seen since 1973; PMI Manufacturing Index held steady, as expected. 0.0 50.0 100.0 150.0 200.0 250.0 300.0 350.0 400.0 450.0 Jul-14 Sep-14 Nov-14 Jan-15 Mar-15 May-15 % Non-Farm Payrolls - Trailing 12 Months Source: Bloomberg -3.0 -2.0 -1.0 0.0 1.0 2.0 3.0 4.0 5.0 6.0 Sep-12 Mar-13 Sep-13 Mar-14 Sep-14 Mar-15 % Real GDP Growth Rate - Annualized - Trailing 12 Qtrs. Source: Bloomberg 17,000 17,200 17,400 17,600 17,800 18,000 18,200 18,400 Apr-15 May-15 Jun-15 Index Dow Jones Industrial Average - Trailing 90 Days Source: Bloomberg -3.0 -2.0 -1.0 0.0 1.0 2.0 3.0 4.0 5.0 6.0 Sep-12 Mar-13 Sep-13 Mar-14 Sep-14 Mar-15 % Real GDP Growth Rate - Annualized - Trailing 12 Qtrs. Source: Bloomberg
  • 2. PMC Weekly Market Review 2 July 24, 2015 MARKET DASHBOARD 0.7 0.8 0.9 1 1.1 1.2 1.3 1.4 Jun-13 Aug-13 Oct-13 Dec-13 Feb-14 Apr-14 Jun-14 Aug-14 Oct-14 Dec-14 Feb-15 Apr-15 Jun-15 Source: Bloomberg Wealth Index|Growth of $1: Trailing 24 Months S&P 500 Dow Industrials Small Cap EAFE Emerging Mkts. L S Source: Bloomberg -2.38% -2.33% -2.29% -2.17% -1.82% -1.48% 7.57%1.77%-3.93% One Week Value Growth -3.55% -3.24% -2.95% YTD Value Growth -2.75% 1.52% 5.80% -2.37% 0.86% 4.00% 1900 1950 2000 2050 2100 2150 1/26 2/9 2/23 3/9 3/23 4/6 4/20 5/4 5/18 6/1 6/15 6/29 7/13 Source: Bloomberg S&P 500 Index: Trailing 180 Days % Wgt in S&P 500 Week % Chg. YTD % Chg. Consumer Discretionary 13.1 -0.46% 9.1% Consumer Staples 9.6 -0.92% 2.0% Energy 7.2 -4.07% -13.0% Financials 16.9 -1.01% 1.5% Health Care 15.4 -2.76% 9.2% Industrials 9.8 -3.81% -6.3% Information Technology 20.0 -2.45% 2.6% Materials 2.9 -5.47% -7.4% Telecom Services 2.2 -3.04% -1.9% Utilities 2.8 -2.37% -10.5% Source: Bloomberg Sector Performance: S&P/Global Industry Classification Sectors (GICS) 10 12 14 16 18 20 22 Jan-15 Feb-15 Mar-15 Apr-15 May-15 Jun-15 Source: Bloomberg VIX Index: Trailing 180 Days Last Price Change % Chg. YTD % Last Price Change % Chg. YTD % S&P 500 2,079.65 -46.99 -2.21% 1.0% Russell Global EM 2,962.90 -49.37 -1.67% -2.3% Dow Industrials 17,568.53 -517.92 -2.86% -1.4% 10-Year US Treas. 2.27 -8 bps NM NM Nasdaq 5,088.63 -121.51 -2.33% 7.4% DJ UBS Comm. Idx. 93.29 -4.28 -4.39% -10.6% Russell 2000 1,225.99 -41.10 -3.24% 1.8% Gold $1,099.61 -$34.38 -3.03% -7.1% Euro Stoxx Index 394.64 -11.04 -2.72% 15.2% Crude Oil $48.09 -$3.08 -6.01% -16.3% Shanghai Composite 4,070.91 113.56 2.87% 25.9% Dollar Index 97.26 -0.60 -0.61% 7.7% Russell Global 1,792.67 -19.17 -1.07% 2.6% VIX Index 13.74 1.79 14.98% -28.4% Source: Bloomberg; Index %change is based on price.
  • 3. PMC Weekly Market Review 3 July 24, 2015 134 135 136 137 138 139 140 141 142 143 144 Dec-10 Feb-11 Apr-11 Jun-11 Aug-11 Oct-11 Index S&P/Case-Shiller Home Price Index-Trailing 12 Mos. Source: Bloomberg THE ECONOMY AND MARKETS An Upbeat Start to Earnings Season In the first quarter of 2015 reported earnings per share (EPS) were $21.51 for the S&P 500 Index, representing a decline of 14.23% from the prior year. The Materials and the Industrials sectors were the worst performers, with year-over-year EPS declining over 40%. Although Utilities and Financials were bright spots, gaining 40% and 20% year over year, respectively, many corporations provided overall lower guidance, and Wall Street analysts lowered second quarter earnings expectations. Thomson Reuters’ data forecasted a 5.9% gain in earnings for Q2 in January for the S&P 500 Index, and by June these estimates were revised to a loss of 1.5%. Bob Doll of Nuveen Investments stated in a quarterly conference call earlier this week that second quarter earnings estimates were cut too far, in his opinion, and that many companies will exceed Wall Street consensus. So far, that holds true. Corporate earnings releases kicked off unofficially on July 8th, when Alcoa (ticker: AA) reported solid second quarter profits. Through the market close on Tuesday, July 21st, 102 companies (roughly 20%) in the S&P 500 Index have reported earnings. Seventy percent beat earnings expectations, and 55% exceeded revenue forecasts. On the heels of a report that existing home sales were strong in June, reaching highs not seen since February 2007, it is no surprise that housing companies posted positive earnings. Specifically, Lennar Corp (ticker: LEN) reported $0.79 per diluted share, versus last year’s $0.61 per diluted share. Corporations that did not perform as well typically had revenue exposure overseas, and were hurt by a strong dollar, which reduces income derived outside of the US. Although the Technology sector posted year-over-year gains last quarter of 8.90%, tech companies surprised the market this week with lackluster earnings, with names like Qualcomm Corp (ticker: QCOM), Apple (ticker: AAPL), SanDisk Corp (ticker: SNDK), IBM and Microsoft (ticker: MSFT) missing expectations in one way or another. For example, Qualcomm reported a 47% decline in quarterly profits; Apple’s iPhone sales were lower than anticipated; SanDisk reported a drop in both revenue and profit; IBM’s operating EPS fell 13%; Microsoft earnings and revenue beat expectations, but had a loss for the quarter when previously disclosed restructuring charges were included. Despite the soft spot in the Technology sector, the overall earnings season has started out well. In fact, we’re seen growth across Basic Materials, Consumer Goods, and Financials, with names like Bank of America (ticker: BAC) and Citigroup (ticker: C) beating expectations. Additionally, Walgreens Boots Alliance (ticker: WBA), Monsanto Co (ticker: MON), Constellation Brands (ticker: STZ), Darden Restaurants (ticker: DRI), and UnitedHealth Group (ticker: UNH) all posted EPS growth of 57%, 48%, 30%, 26%, and 15%, respectively. Should earnings continue to beat expectations, the US Equity market may extend its gains and even tolerate a future rate hike by the Fed. Stephanie Hagglund Investment Analyst
  • 4. PMC Weekly Market Review 4 July 24, 2015 134 135 136 137 138 139 140 141 142 143 144 Dec-10 Feb-11 Apr-11 Jun-11 Aug-11 Oct-11 Index S&P/Case-Shiller Home Price Index-Trailing 12 Mos. Source: Bloomberg ECONOMIC DATA 5.0 5.2 5.4 5.6 5.8 6.0 6.2 6.4 Jul-14 Sep-14 Nov-14 Jan-15 Mar-15 May-15 % Unemployment Rate-Trailing 12 Mos. Source: Bloomberg -0.8 -0.6 -0.4 -0.2 0 0.2 0.4 0.6 Jul-14 Sep-14 Nov-14 Jan-15 Mar-15 May-15 Monthly%Chg. Consumer Price Index-Trailing 12 Mos. Headline CPI Core CPISource: Bloomberg 80.0 85.0 90.0 95.0 100.0 105.0 Jul-14 Sep-14 Nov-14 Jan-15 Mar-15 May-15 Index Consumer Board Confidence Index - Trailing 12 Mos. Source: Bloomberg 0 50 100 150 200 250 300 350 400 450 Jul-14 Sep-14 Nov-14 Jan-15 Mar-15 May-15 Thousands Non-Farm Payrolls-Trailing 12 Mos. Source: Bloomberg -3.0 -2.0 -1.0 0.0 1.0 2.0 3.0 4.0 5.0 6.0 Sep-12 Mar-13 Sep-13 Mar-14 Sep-14 Mar-15 % Real GDP Growth Rate - Annualized - 12 Qtrs. Source: Bloomberg 230 240 250 260 270 280 290 300 5/1 5/15 5/29 6/12 6/26 7/10 Thousands Initial Jobless Claims-Trailing 12 Wks. Source: Bloomberg
  • 5. PMC Weekly Market Review July 24, 2015 EUROZONE 5 Last Change % Chg. YTD % Last Change % Chg. YTD % Germany 10-Yr. Govt. 0.69 9 bps NM NM France 10-Yr. Govt. 0.97 10 bps NM NM Greece 10-Yr. Govt. 11.33 44 bps NM NM Ireland 10-Yr. Govt. 1.25 14 bps NM NM Italy 10-Yr. Govt. 1.87 5 bps NM NM Portugal 10-Yr. Govt. 2.50 12 bps NM NM Spain 10-Yr. Govt. 1.90 3 bps NM NM Netherlands 10-Yr. Govt. 0.85 10 bps NM NM Belgium 10-Yr. Govt. 0.98 11 bps NM NM U.K. 10-Yr. Govt. 1.93 14 bps NM NM SELECTED EUROPEAN SOVEREIGN YIELD PERFORMANCE Source: Bloomberg Basis points (bps) 0.00 0.20 0.40 0.60 0.80 1.00 1.20 4/27 5/11 5/25 6/8 6/22 7/6 7/20 % Germany 10-Year Government Bond Yield Source: Bloomberg 1.0 1.2 1.4 1.6 1.8 2.0 2.2 2.4 2.6 4/27 5/11 5/25 6/8 6/22 7/6 7/20 % Spain 10-Year Government Bond Yield Source: Bloomberg 1.1 1.3 1.5 1.7 1.9 2.1 2.3 2.5 4/27 5/11 5/25 6/8 6/22 7/6 7/20 % Italy 10-Year Government Bond Yield Source: Bloomberg 4.0 6.0 8.0 10.0 12.0 14.0 16.0 18.0 20.0 4/27 5/11 5/25 6/8 6/22 7/6 7/20 % Greece 10-Year Government Bond Yield Source: Bloomberg
  • 6. PMC Weekly Market Review July 24, 2015 EQUITIES 6 4,700 4,750 4,800 4,850 4,900 4,950 5,000 5,050 5,100 5,150 5,200 5,250 4/27 5/11 5/25 6/8 6/22 7/6 7/20 Index Nasdaq Composite-Trailing 90 Days Source: Bloomberg 2,000 2,500 3,000 3,500 4,000 4,500 5,000 5,500 4/27 5/11 5/25 6/8 6/22 7/6 7/20 Index Shanghai Composite Index-Trailing 90 Days Source: Bloomberg 300 320 340 360 380 400 420 4/27 5/11 5/25 6/8 6/22 7/6 7/20 Index Euro Stoxx Index-Trailing 90 Days Source: Bloomberg 17,000 17,200 17,400 17,600 17,800 18,000 18,200 18,400 4/27 5/11 5/25 6/8 6/22 7/6 7/20 Index Dow Jones Industrial Average -Trailing 90 Days Source: Bloomberg Last Change % Chg. YTD % Last Change % Chg. YTD % S&P 500 2,079.65 -46.99 -2.21% 1.01% Swiss Market Index 9,322.97 -123.20 -1.30% 3.78% Dow Industrials 17,568.53 -517.92 -2.86% -1.43% CAC 40 Index (France) 5,057.36 -67.03 -1.31% 18.36% Nasdaq Composite 5,088.63 -121.51 -2.33% 7.44% DAX Index (Germany) 11,347.45 -325.97 -2.79% 15.72% Russell Global 1,792.67 -19.17 -1.07% 2.6% Irish Overall Index 6,482.53 1.66 0.03% 24.08% Russell Global EM 2,962.90 -49.37 -1.67% -2.3% Nikkei 225 20,544.53 -55.59 -0.27% 17.73% S&P/TSX (Canada) 14,186.24 -456.60 -3.12% -3.05% Hang Seng Index 25,128.51 -286.76 -1.13% 6.45% Mexico IPC 44,249.49 -1075.89 -2.37% 2.56% Shanghai Composite 4,070.91 113.56 2.87% 25.85% Brazil Bovespa 49,245.85 -3095.95 -5.91% -1.52% Kospi Index (S. Korea) 2,045.96 -30.83 -1.48% 6.81% Euro Stoxx 600 394.64 -11.04 -2.72% 15.21% Taiwan Taiex Index 8,767.86 -278.12 -3.07% -5.80% FTSE 100 6,579.81 -195.27 -2.88% 0.21% Tel Aviv 25 Index 1,702.05 7.98 0.47% 16.18% IBEX 35 (Spain) 11,309.30 -171.40 -1.49% 10.02% MICEX Index (Russia) 1,595.61 -54.47 -3.30% 14.25% WORLD MARKET PERFORMANCE Source: Bloomberg; Index %change is based on price.
  • 7. PMC Weekly Market Review July 24, 2015 EQUITIES – EMERGING AND FRONTIER MARKETS 7 Last Change % Chg. YTD % Last Change % Chg. YTD % Mexico IPC 44,249.49 -1075.89 -2.4% 2.6% Hang Seng Index 25,128.51 -286.76 -1.1% 6.5% Brazil (Bovespa Index) 49,245.85 -3095.95 -5.9% -1.5% India (Sensex 30) 28,112.31 -351.00 -1.2% 2.2% MICEX Index (Russia) 1,595.61 -54.47 -3.3% 14.2% Malaysia (KLCI Index) 1,720.76 -5.97 -0.3% -2.3% Czech Republic (Prague) 1,030.83 5.89 0.6% 8.9% Singapore (Straits Times Index) 3,352.65 -0.80 0.0% -0.4% Turkey (Istanbul) 78,712.06 -4077.71 -4.9% -8.2% Thailand (SET Index) 1,438.08 -41.23 -2.8% -4.0% Egypt (Hermes Index) 719.14 4.23 0.6% -13.8% Indonesia (Jakarta) 4,856.60 -37.32 -0.8% -7.1% Kenya (Nairobi 20 Index) 4,500.43 -138.01 -3.0% -12.0% Pakistan (Karachi KSE 100) 35,815.20 -72.46 -0.2% 11.5% Saudi Arabia (TASI Index) 9,372.74 119.33 1.3% 12.5% Vietnam (Ho Chi Minh) 631.26 2.63 0.4% 15.7% Lebanon (Beirut BLOM Index) 1,190.61 0.89 0.1% 1.7% Sri Lanka (Colombo) 7,269.05 107.09 1.5% -0.4% Palestine 480.96 -1.52 -0.3% -4.3% Cambodia (Laos) 1,313.15 -12.80 -1.0% -7.1% EMERGING AND FRONTIER MARKET PERFORMANCE Source: Bloomberg; Index %change is based on price. 42,000 44,000 46,000 48,000 50,000 52,000 54,000 56,000 58,000 60,000 4/27 5/11 5/25 6/8 6/22 7/6 7/20 Index Brazil (Bovespa Index)-Trailing 90 Days Source: Bloomberg 25,000 25,500 26,000 26,500 27,000 27,500 28,000 28,500 29,000 4/27 5/11 5/25 6/8 6/22 7/6 7/20 Index India (Sensex Index)-Trailing 90 Days Source: Bloomberg 400 450 500 550 600 650 700 750 800 850 4/26 5/10 5/24 6/7 6/21 7/5 7/19 Index Egypt (Hermes Index)-Trailing 90 Days Source: Bloomberg 3,100 3,150 3,200 3,250 3,300 3,350 3,400 3,450 3,500 3,550 4/27 5/11 5/25 6/8 6/22 7/6 7/20 Index Singapore (Straits Times Index)-Trailing 90 Days Source: Bloomberg
  • 8. PMC Weekly Market Review July 24, 2015 INTEREST RATES YIELD CURVES 8 Last Change % Chg. YTD % Last Change % Chg. YTD % 2-Yr. U.S. Treasury 0.68% 0 bps NM NM Prime Rate 3.25% 0.00 NM NM 5-Yr. U.S. Treasury 1.62% -5 bps NM NM Fed Funds Rate 0.25% 0.00 NM NM 10-Yr. U.S. Treasury 2.27% -8 bps NM NM Discount Rate 0.75% 0.00 NM NM 30-Yr. U.S. Treasury 2.97% -11 bps NM NM LIBOR (3 Mo.) 0.30% 0 bps NM NM German 10-Yr. Govt. 0.69% 9 bps NM NM Bond Buyer 40 Muni 4.12% -11 bps NM NM France 10-Yr. 0.97% 10 bps NM NM Bond Buyer 40 G.O. 3.75% NA NM NM Italy 10-Yr. 1.87% 5 bps NM NM Bond Buyer 40 Rev. 4.15% NA NM NM Fed 5-Yr Fwd BE Inf. 2.10% 0 bps NM NM SELECTED INTEREST RATES Source: Bloomberg 1M 1Y 3Y 5Y 8Y 10Y 15Y 20Y 30Y 0.00 1.00 2.00 3.00 4.00 5.00 6.00 US Treasury Actives Curve 20150718 US Treasury Actives Curve 20150725 USD US Industrial (BB) BFV Cur 20150725 USD Composite (BBB) BFV Curve 20150725 1.50 1.70 1.90 2.10 2.30 2.50 2.70 1/26 2/26 3/26 4/26 5/26 6/26 Yield% 10-Year Treasury Yield - Trailing 180 Days Source: Bloomberg 1.00 1.10 1.20 1.30 1.40 1.50 1.60 1.70 1.80 1.90 2.00 1/26 2/26 3/26 4/26 5/26 6/26 Index BBB/Baa- 10-Yr Treas. Spread Rising Line = Risk Aversion Source: Bloomberg Source: Bloomberg
  • 9. PMC Weekly Market Review July 24, 2015 CURRENCIES 9 88 90 92 94 96 98 100 102 1/26 2/26 3/26 4/26 5/26 6/26 U.S. Dollar Index - Trailing Six Months Source: Bloomberg 0.80 0.85 0.90 0.95 1.00 1.05 1.10 1.15 1.20 1/26 2/26 3/26 4/26 5/26 6/26 Euro - U.S. Dollars per Euro Source: Bloomberg 112.00 114.00 116.00 118.00 120.00 122.00 124.00 126.00 128.00 1/26 2/26 3/26 4/26 5/26 6/26 Japanese yen - Yen per U.S. Dollar Source: Bloomberg Last Change % Chg. YTD % Last Change % Chg. YTD % Dollar Index 97.26 -0.601 -0.61% 7.75% Chinese Yuan 6.21 0.000 0.00% -0.06% Euro 1.10 0.015 1.39% -9.24% Swiss Franc 0.96 0.001 -0.06% 3.35% Japanese Yen 123.80 -0.290 0.23% -3.25% New Zealand Dollar 0.66 0.005 0.78% -15.63% British Pound 1.55 -0.009 -0.60% -0.46% Brazilian Real 3.35 0.156 -4.67% -20.54% Canadian Dollar 1.30 0.007 -0.51% -10.87% Mexican Peso 16.26 0.334 -2.05% -9.28% SELECTED CURRENCY PERFORMANCE Source: Bloomberg 6.14 6.16 6.18 6.20 6.22 6.24 6.26 6.28 6.30 1/26 2/26 3/26 4/26 5/26 6/26 Chinese yuan - yuan per U.S. Dollar Source: Bloomberg
  • 10. PMC Weekly Market Review July 24, 2015 COMMODITIES 10 40 45 50 55 60 65 1/26 2/26 3/26 4/26 5/26 6/26 $perbarrel Crude Oil - Light Crude ($ per barrel) Source: Bloomberg 1,100 1,150 1,200 1,250 1,300 1,350 1/26 2/26 3/26 4/26 5/26 6/26 $perounce Gold - Spot gold price ($ per ounce) Source: Bloomberg 5,000 5,200 5,400 5,600 5,800 6,000 6,200 6,400 6,600 1/26 2/25 3/27 4/26 5/26 6/25 Index Copper Source: Bloomberg 320 340 360 380 400 420 440 460 1/26 2/26 3/26 4/26 5/26 6/26 $perbushel Corn - Active Contract Source: Bloomberg Last Change % Chg. YTD % Last Change % Chg. YTD % DJ UBS Comm. Idx. 93.29 -4.28 -4.39% -10.58% Platinum Spot $987.41 -$7.35 -0.74% -18.30% Rogers Int. Comm. Idx. 2478.52 -92.30 -3.59% -11.25% Corn 402.75 -28.50 -6.61% -4.33% Crude Oil $48.09 -$3.08 -6.01% -16.30% Wheat 511.75 -42.25 -7.63% -15.38% Natural Gas $2.78 -$0.09 -3.10% -8.10% Soybeans 965.00 -41.75 -4.15% -4.03% Gasoline ($/Gal.) $2.73 -$0.03 -0.98% 21.96% Sugar 11.24 -0.72 -6.02% -28.27% Heating Oil 163.28 -3.13 -1.88% -11.75% Orange Juice 123.00 3.05 2.54% -13.62% Gold Spot $1,099.61 -$34.38 -3.03% -7.14% Aluminum 1,636.00 -61.00 -3.59% -11.69% Silver Spot $14.68 -$0.20 -1.37% -6.54% Copper 5,272.50 -207.50 -3.79% -16.31% Source: Bloomberg; % change is based on price. SELECTED COMMODITY MARKET PERFORMANCE
  • 11. PMC Weekly Market Review July 24, 2015 ALTERNATIVE INVESTMENTS 11 1,205 1,210 1,215 1,220 1,225 1,230 1,235 1,240 1,245 1,250 1,255 1,260 4/27 5/11 5/25 6/8 6/22 7/6 7/20 Index HFRX Global Hedge Fund Index - Trailing 90 Days Source: Bloomberg 970 975 980 985 990 995 1,000 1,005 4/27 5/11 5/25 6/8 6/22 7/6 7/20 Index HFRX Equity Market Neutral - Trailing 90 Days Source: Bloomberg 1,340 1,350 1,360 1,370 1,380 1,390 1,400 1,410 4/27 5/11 5/25 6/8 6/22 7/6 7/20 Index IQ Fixed Income Beta Arb Index - Trailing 90 Days Source: Bloomberg 1,150 1,160 1,170 1,180 1,190 1,200 1,210 1,220 1,230 1,240 4/27 5/11 5/25 6/8 6/22 7/6 7/20 Index HFRX Equity Hedge Index - Trailing 90 Days Source: Bloomberg Last Change % Chg. YTD % Last Change % Chg. YTD % HFRX Global Hedge Fund Index 1241.82 -5.68 -0.46% 1.55% HFRX Distressed Index 1020.05 -4.27 -0.42% 0.60% HFRX Equity Market Neutral 999.76 0.45 0.04% 1.44% HFRX Merger Arbitrage Index 1670.58 -1.41 -0.08% 4.05% HFRX Equity Hedge Index 1216.13 -3.89 -0.32% 2.77% HFRX Convertible Arbitrage Index 723.10 -0.35 -0.05% 2.94% HFRX Event-Driven Index 1533.36 -16.85 -1.10% 0.15% HFRX Macro CTA Index 1201.92 0.22 0.02% 1.07% HFRX Absolute Return Index 1019.75 0.81 0.08% 2.39% IQ Fixed Income Beta Arb Index 1370.96 4.61 0.34% -1.20% SELECTED ALTERNATIVE INVESTMENT INDEX PERFORMANCE Source: Bloomberg; Index % change is based on price.
  • 12. PMC Weekly Market Review 2.95 3.00 3.05 3.10 3.15 3.20 3.25 3.30 3.35 3.40 1/26 2/26 3/26 4/26 5/26 6/26 Index S&P 500/MSCI EAFE - Trailing 180 Days Source: Bloomberg 1.40 1.45 1.50 1.55 1.60 1.65 1.70 1.75 1/26 2/26 3/26 4/26 5/26 6/26 Index MSCI EAFE/MSCI EM - Trailing 180 Days Source: Bloomberg 0.36 0.37 0.37 0.38 0.38 0.39 0.39 0.40 0.40 1/26 2/26 3/26 4/26 5/26 6/26 Index Large Cap/Small Cap - Trailing 180 Days Source: Bloomberg 0.73 0.74 0.75 0.76 0.77 0.78 0.79 0.80 0.81 0.82 0.83 1/26 2/26 3/26 4/26 5/26 6/26 Index Growth/Value - Trailing 180 Days Source: Bloomberg July 24, 2015 12 PORTFOLIO CONSTRUCTION 3.00 3.50 4.00 4.50 5.00 5.50 6.00 1/26 2/26 3/26 4/26 5/26 6/26 Index S&P 500/MSCI EM - Trailing 180 Days Source: Bloomberg
  • 13. PMC Weekly Market Review 0.300 0.305 0.310 0.315 0.320 0.325 0.330 0.335 0.340 1/26 2/26 3/26 4/26 5/26 6/26 Index High Yield/Inv. Grade Bonds - Trailing 180 Days Source: Bloomberg 0.192 0.194 0.196 0.198 0.200 0.202 0.204 0.206 0.208 1/26 2/26 3/26 4/26 5/26 6/26 Index Info Tech/S&P 500 - Trailing 180 Days Source: Bloomberg 1.72 1.74 1.76 1.78 1.80 1.82 1.84 1.86 1.88 1.90 1/26 2/26 3/26 4/26 5/26 6/26 Index Inv. Grade Bonds/Int. Govt. Bonds - Trailing 180 Days Source: Bloomberg 0.57 0.58 0.58 0.59 0.59 0.60 0.60 0.61 0.61 0.62 1/26 2/26 3/26 4/26 5/26 6/26 Index High Yield Bonds/Int. Govt. Bonds - Trailing 180 Days Source: Bloomberg July 24, 2015 13 PORTFOLIO CONSTRUCTION (cont’d.)
  • 14. PMC Weekly Market Review 14 July 24, 2015 The Relative Strength Matrix provides an indication of how the various asset classes have performed relative to one another over the past 30 days. A number greater than 1.0 indicates that the asset class in the far left column has outperformed the corresponding asset class in the top row over the past 30 days. A number below 1.0 means the asset class on the left has underperformed the asset class at the top. The green shading indicates outperformance, and the red shading indicates underperformance. Source: Bloomberg Large Cap Core Large Cap Growth Large Cap Value Mid Cap Core Mid Cap Growth Mid Cap Value Small Cap Core Small Cap Growth Small Cap Value Int'l. Developed Emerging Markets REITs Comm. Int. Bond High Yield Large Cap Core 1.00 0.95 1.08 1.13 1.04 1.23 1.09 0.99 1.25 1.04 1.36 1.06 1.42 1.05 1.50 Large Cap Growth 1.06 1.00 1.14 1.19 1.10 1.30 1.15 1.04 1.32 1.10 1.43 1.12 1.50 1.11 1.59 Large Cap Value 0.93 0.88 1.00 1.04 0.96 1.14 1.01 0.91 1.15 0.97 1.26 0.98 1.32 0.97 1.39 Mid Cap Core 0.89 0.84 0.96 1.00 0.92 1.09 0.97 0.88 1.11 0.93 1.21 0.94 1.26 0.93 1.33 Mid Cap Growth 0.96 0.91 1.04 1.08 1.00 1.18 1.05 0.95 1.20 1.00 1.31 1.02 1.37 1.01 1.44 Mid Cap Value 0.81 0.77 0.88 0.92 0.85 1.00 0.89 0.80 1.01 0.85 1.11 0.86 1.16 0.85 1.22 Small Cap Core 0.92 0.87 0.99 1.04 0.96 1.13 1.00 0.91 1.15 0.96 1.25 0.97 1.31 0.96 1.38 Small Cap Growth 1.01 0.96 1.09 1.14 1.05 1.24 1.10 1.00 1.26 1.06 1.38 1.07 1.44 1.06 1.52 Small Cap Value 0.80 0.76 0.87 0.90 0.83 0.99 0.87 0.79 1.00 0.84 1.09 0.85 1.14 0.84 1.21 Int'l. Developed 0.96 0.91 1.04 1.08 1.00 1.18 1.04 0.95 1.20 1.00 1.30 1.02 1.36 1.01 1.44 Emerging Markets 0.74 0.70 0.79 0.83 0.77 0.90 0.80 0.73 0.92 0.77 1.00 0.78 1.05 0.77 1.11 REITs 0.95 0.89 1.02 1.06 0.98 1.16 1.03 0.93 1.18 0.98 1.28 1.00 1.34 0.99 1.42 Commodities 0.70 0.67 0.76 0.79 0.73 0.86 0.77 0.69 0.88 0.73 0.96 0.74 1.00 0.74 1.06 Int. Bond 0.95 0.90 1.03 1.07 0.99 1.17 1.04 0.94 1.19 0.99 1.30 1.01 1.36 1.00 1.43 High Yield 0.67 0.63 0.72 0.75 0.69 0.82 0.72 0.66 0.83 0.69 0.90 0.70 0.95 0.70 1.00 RELATIVE STRENGTH MATRIX (BASED ON 30-DAY RSI) 5/7 5/14 5/21 5/28 6/4 6/11 6/18 6/25 7/2 7/9 7/16 7/23 Large Cap (R200) 0.08% 1.65% 0.43% -0.49% -1.18% 0.66% 0.56% -0.85% -1.14% -1.23% 3.86% -0.95% Small Cap (R2000) 0.44% 1.60% 0.93% -0.29% -0.14% 1.41% 1.24% -0.11% -2.73% -1.13% 3.13% -2.19% MSCI EAFE -1.32% 2.61% 0.31% -1.79% -0.52% -0.42% -0.75% 1.53% -2.81% -2.17% 4.28% -0.89% MSCI Em. Mkts. -2.18% 1.06% -0.30% -2.24% -2.13% -1.14% 0.08% 1.08% -1.69% -5.32% 2.38% -1.93% BarCap Agg. (AGG) -0.84% -0.17% 0.15% 0.20% -1.00% -0.29% 0.15% -0.37% -0.03% 0.37% -0.06% 0.33% High Yield (JNK) -0.63% 0.56% -0.20% 0.13% -1.24% -0.26% -0.15% -0.05% -0.88% -0.73% 0.66% -1.36% DJ UBS Index -0.62% 2.32% -1.65% -3.46% -0.10% 1.44% -0.88% 0.30% 0.96% -2.77% -0.97% -3.76% Hedge Funds (HFRX Global) -0.39% 0.27% 0.47% 0.00% -0.24% 0.04% -0.17% 0.08% -1.02% -0.59% 1.21% -0.36% 60/40* -0.57% 1.07% 0.30% -0.48% -0.96% 0.10% 0.23% -0.11% -1.17% -0.98% 2.25% -0.69% 48/32/20 (w/Alts.)** -0.53% 0.91% 0.33% -0.39% -0.82% 0.09% 0.15% -0.07% -1.14% -0.90% 2.04% -0.62% Source: Bloomberg; *60/40 portfolio =30% Large Cap/10% Small Cap/15% EAFE/5% Emerging Markets/35% BarCap Agg./5% High Yield. **48/32/20 portfolio =24% Large Cap/8% Small Cap/12% EAFE/4% Emerging Markets/28% BarCap Agg./4% High Yield/20% HFRX Global Index. WEEKLY ASSET CLASS PERFORMANCE (Prior 12 weeks ending Thursday) Alternatives Asset Allocation Domestic Equity Int'l. Equity Fixed Income Commodities Equity
  • 15. PMC Weekly Market Review July 24, 2015 15 INDEX OVERVIEW & KEY DEFINITIONS Fed, The Fed or FED refers to the Federal Reserve System, the central bank of the United States. The Federal Open Market Committee (FOMC) is the monetary policymaking body of the Federal Reserve System. Fed Funds Rate, the interest rate at which a depository institution lends funds maintained at the Federal Reserve to another depository institution overnight. The European Central Bank (ECB) is the central bank for Europe's single currency, the euro. The ECB’s main task is to maintain the euro's purchasing power and thus price stability in the euro area. The euro area comprises the 19 European Union countries that have introduced the euro since 1999. The Gross Domestic Product (GDP) rate is a measurement of the output of goods and services produced by labor and property located in the United States. Basis Point(s) is a unit that is equal to 1/100th of 1%, and is used to denote the change in a financial instrument. The basis point is commonly used for calculating changes in interest rates, equity indexes and the yield of a fixed-income security. A separately managed account (SMA) is an individual managed investment account offered typically by a brokerage firm through one of their brokers or financial consultants and managed by independent investment management firms (often called money managers for short) and have varying fee structures. The Consumer Price Index (CPI) measures the change in the cost of a fixed basket of products and services. The Producer Price Index (PPI) program measures the average change over time in the selling prices received by domestic producers for their output. The prices included in the PPI are from the first commercial transaction for many products and some services. The Dow Jones Industrial Average (DOW or DJIA) is an unmanaged index of 30 common stocks comprised of 30 actively traded blue chip stocks, primarily industrials and assumes reinvestment of dividends. The S&P 500 Index is an unmanaged index comprised of 500 widely held securities considered to be representative of the stock market in general. The S&P/Case-Shiller Home Price Indices measure the residential housing market, tracking changes in the value of the residential real estate market in 20 metropolitan regions across the United States. The Nasdaq Composite Index is a stock market index of the common stocks and similar securities listed on the NASDAQ stock market. The US Dollar Index is a measure of the value of the United States dollar relative to a basket of foreign currencies. It is a weighted geometric mean of the dollar's value relative to other select currencies (Euro, Japanese yen, Pound sterling, Canadian dollar, Swedish krona (SEK) & Swiss franc). The Nikkei Index (Nikkei 225 or Nikkei) is a stock market index for the Tokyo Stock Exchange calculated daily by the Nihon Keizai Shimbun (Nikkei) newspaper since 1950. It is a price-weighted index (the unit is yen), and the components are reviewed once a year. The FTSE 100 Index (FTSE 100) is a share index of the 100 companies listed on the London Stock Exchange (LSE) with the highest market capitalization. The Bloomberg Commodity Index (formerly the Dow Jones-UBS Commodity Index) tracks prices of futures contracts on physical commodities on the commodity markets and is designed to minimize concentration in any one commodity or sector (currently 22 commodity futures in seven sectors). The Barclays Capital US Credit Index is an unmanaged index considered representative of publicly issued, SEC-registered US corporate and specified foreign debentures and secured notes. The Barclays Capital US Aggregate Bond Index is a market capitalization-weighted index of investment-grade, fixed-rate debt issues, including government, corporate, asset-backed, and mortgage-backed securities, with maturities of at least one year. The Barclays Capital US Corporate High Yield Index covers the USD-denominated, non-investment grade, fixed-rate, taxable corporate bond market. Securities are classified as high-yield if the middle rating of Moody’s, Fitch and S&P is Ba1/BB+/BB+ or below. The index may include emerging market debt. The Barclays Capital Municipal Bond Index is an unmanaged index comprised of investment-grade, fixed-rate municipal securities representative of the tax-exempt bond market in general. The Barclays Capital US Treasury Total Return Index is an unmanaged index of public obligations of the US Treasury with a remaining maturity of one year or more. The Barclays Capital Global Aggregate ex-U.S. Index is a market capitalization-weighted index, meaning the securities in the index are weighted according to the market size of each bond type. Most U.S. traded investment grade bonds are represented. Municipal bonds, and Treasury Inflation-Protected Securities are excluded, due to tax treatment issues. The index includes Treasury securities, Government agency bonds, Mortgage- backed bonds, Corporate bonds, and a small amount of foreign bonds traded in U.S. The Barclays Capital U.S. 5-10 Year Corporate Bond Index measures the investment return of U.S. dollar denominated, investment-grade, fixed rate, taxable securities issued by industrial, utility, and financial companies with maturities between 5 and 10 years. Treasury securities, mortgage-backed securities (MBS) foreign bonds, government agency bonds and corporate bonds are some of the categories included in the index. The Barclays Capital U.S Corporate High-Yield Index is composed of fixed-rate, publicly issued, non-investment grade debt. The Barclays Capital U.S. Corporate 5-10 Year Index includes U.S. dollar-denominated, investment-grade, fixed-rate, taxable securities issued by industrial, utility, & financial companies, with maturities between 5 & 10 years. The Citigroup World Government Bond Index measures the performance of fixed-rate, local currency, investment grade sovereign bonds and comprises sovereign debt from over 20 countries, denominated in a variety of currencies. The DJ-UBS Commodity Index Total Return SM measures the collateralized returns from a basket of 19 commodity futures contracts representing the energy, precious metals, industrial metals, grains, softs and livestock sectors. The Russell 1000 Index is a market capitalization-weighted benchmark index made up of the 1000 largest U.S. companies in the Russell 3000 Index. The Russell 1000 Growth Index is an unmanaged index considered representative of large-cap growth stocks. The Russell 1000 Value Index is an unmanaged index considered representative of large-cap value stocks. The Russell 2000 Index is an unmanaged index considered representative of small-cap stocks. The Russell 2000 Growth Index is an unmanaged index considered representative of small-cap growth stocks. The Russell 2000 Growth Index is an unmanaged index considered representative of small-cap value stocks. The Russell 3000 Index is an unmanaged index considered representative of the US stock market. The Russell Midcap Index is a subset of the Russell 1000 Index. It includes approximately 800 of the smallest securities based on a combination of their market cap and current index membership. The Russell Midcap Growth Index is an unmanaged index considered representative of mid-cap growth stocks. The Russell Midcap Value Index is an unmanaged index considered representative of mid-cap value stocks. The HFRX Indices are a series of benchmarks of hedge fund industry performance which are engineered to achieve representative performance of a larger universe of hedge fund strategies. Hedge Fund Research, Inc. employs the HFRX Methodology (UCITS compliant), a proprietary and highly quantitative process by which hedge funds are selected as constituents for the HFRX Indices. The University of Michigan Consumer Sentiment Index (MCSI) is a survey of consumer confidence conducted by the University of Michigan using telephone surveys to gather information on consumer expectations regarding the overall economy. The ISM Non-Manufacturing Index is an index based on surveys of more than 400 non-manufacturing firms' purchasing and supply executives, within 60 sectors across the nation, by the Institute of Supply Management (ISM). The ISM Non-Manufacturing Index tracks economic data, like the ISM Non-Manufacturing Business Activity Index. A composite diffusion index is created based on the data from these surveys that monitors economic conditions of the nation. The ISM Manufacturing Index is an index based on surveys of more than 300 manufacturing firms by the Institute of Supply Management – the index monitors employment, production inventories, new orders and supplier deliveries. A composite diffusion index is created that monitors conditions in national manufacturing based on the data from these surveys. The CBOE Volatility Index (VIX) is an up-to-the-minute market estimate of expected volatility that is calculated by using real-time S&P 500 Index option bid/ask quotes. The Index uses nearby and second nearby options with at least 8 days left to expiration and then weights them to yield a constant, 30-day measure of the expected volatility of the S&P 500 Index. The MSCI EAFE Index is designed to measure the equity market performance of developed markets outside of the U.S. & Canada. The MSCI EAFE Growth Index is an unmanaged index considered representative of growth stocks of Europe, Australasia and the Far East. The MSCI EAFE Value Index is an unmanaged index considered representative of value stocks of Europe, Australasia and the Far East. The MSCI EM (Emerging Markets) Latin America Index is a free float-adjusted market capitalization weighted index that is designed to measure the equity market performance of emerging markets in Latin America. The MSCI World ex-U.S. Index captures large and mid-cap representation across 22 of 23 Developed Markets (DM) countries - excluding the US. With 1,002 constituents, the index covers approximately 85% of the free float-adjusted market capitalization in each country. (DM countries include: Australia, Austria, Belgium, Canada, Denmark, Finland, France, Germany, Hong Kong, Ireland, Israel, Italy, Japan, Netherlands, New Zealand, Norway, Portugal, Singapore, Spain, Sweden, Switzerland and the UK.) The MSCI Japan Index is designed to measure the performance of the large and mid-cap segments of the Japanese market. With 320 constituents, the index covers approximately 85% of the free float-adjusted market capitalization in Japan. The MSCI Emerging Markets Index is a free float-adjusted market capitalization index that is designed to measure equity market performance in the global emerging markets. The MSCI Europe Index is an unmanaged index considered representative of stocks of developed European countries. The MSCI Pacific Index is a free float-adjusted market capitalization weighted index that is designed to measure the equity market performance of the developed markets in the Pacific region. (07/17/15)
  • 16. PMC Weekly Market Review July 24, 2015 16 The information, analysis, and opinions expressed herein are for general and educational purposes only. Nothing contained in this weekly review is intended to constitute legal, tax, accounting, securities, or investment advice, nor an opinion regarding the appropriateness of any investment, nor a solicitation of any type. All investments carry a certain risk, and there is no assurance that an investment will provide positive performance over any period of time. An investor may experience loss of principal. Investment decisions should always be made based on the investor’s specific financial needs and objectives, goals, time horizon, and risk tolerance. The asset classes and/or investment strategies described may not be suitable for all investors and investors should consult with an investment advisor to determine the appropriate investment strategy. Past performance is not indicative of future results. Information obtained from third party sources are believed to be reliable but not guaranteed. Envestnet|PMC™ makes no representation regarding the accuracy or completeness of information provided herein. All opinions and views constitute our judgments as of the date of writing and are subject to change at any time without notice. Investments in smaller companies carry greater risk than is customarily associated with larger companies for various reasons such as volatility of earnings and prospects, higher failure rates, and limited markets, product lines or financial resources. Investing overseas involves special risks, including the volatility of currency exchange rates and, in some cases, limited geographic focus, political and economic instability, and relatively illiquid markets. Income (bond) securities are subject to interest rate risk, which is the risk that debt securities in a portfolio will decline in value because of increases in market interest rates. Exchange Traded Funds (ETFs) are subject to risks similar to those of stocks, such as market risk. Investing in ETFs may bear indirect fees and expenses charged by ETFs in addition to its direct fees and expenses, as well as indirectly bearing the principal risks of those ETFs. ETFs may trade at a discount to their net asset value and are subject to the market fluctuations of their underlying investments. Investing in commodities can be volatile and can suffer from periods of prolonged decline in value and may not be suitable for all investors. Index Performance is presented for illustrative purposes only and does not represent the performance of any specific investment product or portfolio. An investment cannot be made directly into an index. Alternative Investments may have complex terms and features that are not easily understood and are not suitable for all investors. You should conduct your own due diligence to ensure you understand the features of the product before investing. Alternative investment strategies may employ a variety of hedging techniques and non-traditional instruments such as inverse and leveraged products. Certain hedging techniques include matched combinations that neutralize or offset individual risks such as merger arbitrage, long/short equity, convertible bond arbitrage and fixed-income arbitrage. Leveraged products are those that employ financial derivatives and debt to try to achieve a multiple (for example two or three times) of the return or inverse return of a stated index or benchmark over the course of a single day. Inverse products utilize short selling, derivatives trading, and other leveraged investment techniques, such as futures trading to achieve their objectives, mainly to track the inverse of their benchmarks. As with all investments, there is no assurance that any investment strategies will achieve their objectives or protect against losses. Neither Envestnet, Envestnet|PMC™ nor its representatives render tax, accounting or legal advice. Any tax statements contained herein are not intended or written to be used, and cannot be used, for the purpose of avoiding U.S. federal, state, or local tax penalties. Taxpayers should always seek advice based on their own particular circumstances from an independent tax advisor. © 2015 Envestnet Asset Management, Inc. All rights reserved. ABOUT ENVESTNET® Envestnet, Inc. (NYSE: ENV) is a leading provider of unified wealth management technology and services to investment advisors. Our open-architecture platforms unify and fortify the wealth management process, delivering unparalleled flexibility, accuracy, performance and value. Envestnet solutions enable the transformation of wealth management into a transparent, objective, independent and fully-aligned standard of care, and empower advisors to deliver better results. Envestnet's Advisor Suite® software empowers financial advisors to better manage client outcomes and strengthen their practice. Envestnet provides institutional-quality research and advanced portfolio solutions through our Portfolio Management Consultants group, Envestnet | PMC®. Envestnet | Tamarac provides leading rebalancing, reporting and practice management software. For more information on Envestnet, please visit www.envestnet.com. 07.17.15