

Recomendados
Más contenido relacionado
La actualidad más candente
America reyes garay 8 pernos
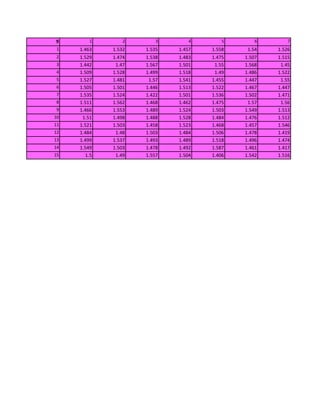
- 1. 9 1 2 3 4 5 6 7 1 1.463 1.532 1.535 1.457 1.558 1.54 1.526 2 1.529 1.474 1.538 1.483 1.475 1.507 1.515 3 1.442 1.47 1.567 1.501 1.55 1.568 1.45 4 1.509 1.528 1.499 1.518 1.49 1.486 1.522 5 1.527 1.481 1.57 1.541 1.455 1.447 1.55 6 1.505 1.501 1.446 1.513 1.522 1.467 1.447 7 1.535 1.524 1.422 1.501 1.536 1.502 1.471 8 1.511 1.562 1.468 1.462 1.475 1.57 1.56 9 1.466 1.553 1.489 1.524 1.503 1.549 1.513 10 1.51 1.498 1.488 1.528 1.484 1.476 1.512 11 1.521 1.503 1.458 1.523 1.468 1.457 1.546 12 1.484 1.48 1.503 1.484 1.506 1.478 1.419 13 1.499 1.537 1.493 1.489 1.518 1.496 1.474 14 1.549 1.503 1.478 1.492 1.587 1.461 1.417 15 1.5 1.49 1.557 1.504 1.406 1.542 1.516
- 3. 8 9 10 11 12 13 14 15 1.493 1.509 1.522 1.464 1.512 1.457 1.528 1.562 1.481 1.503 1.519 1.539 1.475 1.521 1.446 1.464 1.514 1.531 1.56 1.461 1.496 1.524 1.492 1.474 1.489 1.442 1.469 1.488 1.505 1.469 1.452 1.569 1.503 1.53 1.535 1.472 1.47 1.493 1.421 1.473 1.48 1.503 1.529 1.466 1.479 1.496 1.519 1.487 1.469 1.497 1.527 1.5 1.471 1.538 1.482 1.409 1.522 1.484 1.536 1.531 1.445 1.496 1.466 1.512 1.515 1.436 1.503 1.475 1.474 1.443 1.491 1.49 1.452 1.494 1.492 1.476 1.551 1.501 1.529 1.487 1.512 1.461 1.488 1.506 1.495 1.518 1.441 1.528 1.475 1.513 1.447 1.479 1.473 1.504 1.54 1.464 1.494 1.477 1.557 1.488 1.497 1.484 1.518 1.494 1.49 1.506 1.482 1.487 1.555 1.523 1.468 1.574 1.526 1.473 1.518 1.534 1.464 1.464 1.545 1.519
- 5. 16 17 18 19 20 DATOS AGRUPADOS 1.515 1.479 1.526 1.478 1.457 maximo: 1.587 1.393 1.473 1.547 1.532 1.483 mínimo: 1.393 1.423 1.486 1.488 1.571 1.486 rango: 0.194 1.571 1.488 1.488 1.537 1.472 1.548 1.53 1.463 1.49 1.459 intervalo: 9 1.485 1.452 1.468 1.499 1.407 1.476 1.554 1.539 1.467 1.494 tamaño del intervalo 1.48 1.515 1.47 1.454 1.448 rango/inter. 0.02155556 1.567 1.513 1.471 1.523 1.477 redondea a: 0.022 1.468 1.51 1.482 1.497 1.548 1.45 1.481 1.506 1.512 1.483 1.533 1.441 1.533 1.518 1.478 1.452 1.501 1.467 1.447 1.53 1.557 1.524 1.531 1.55 1.504 1.58 1.468 1.559 1.496 1.488
- 7. INTERVALOS APARENTES INTERVALOS REALES L. INFERIOR L. SUPERIOR L. INFERIOR L. SUPERIOR 1 1.393 1.414 0.001 1 1.3925 1.4145 2 1.415 1.436 0.0005 2 1.4145 1.4365 3 1.437 1.458 3 1.4365 1.4585 4 1.459 1.48 4 1.4585 1.4805 5 1.481 1.502 5 1.4805 1.5025 6 1.503 1.524 6 1.5025 1.5245 7 1.525 1.546 7 1.5245 1.5465 8 1.547 1.568 8 1.5465 1.5685 9 1.569 1.59 9 1.5685 1.5905 1.3925 1.4145 1.4365 1.4585 1.4805 1.5025 1.5245 1.5465 1.5685 1.5605
- 9. MARCAS DE CLASE FRECUENCIAS Xi Fi Fai Fri Frai X i * Fi (Xi-X)*Fi 1.4035 4 4 0.01333333 0.01333333 5.614 0.379866667 1.4255 6 10 0.02 0.03333333 8.553 0.4378 1.4475 26 36 0.08666667 0.12 37.635 1.325133333 1.4695 63 99 0.21 0.33 92.5785 1.8249 1.4915 69 168 0.23 0.56 102.9135 0.4807 1.5135 60 228 0.2 0.76 90.81 0.902 1.5355 40 268 0.13333333 0.89333333 61.42 1.481333333 1.5575 24 292 0.08 0.97333333 37.38 1.4168 1.5795 8 300 0.02666667 1 12.636 0.648266667 totales: 449.54 8.8968 media: 1.49846667 D. media: 0.029656 varianza: D. estandar: 1.3705 1.6125 1.3485 1.6345 1.3265 1.6565 1.3045 1.6785 1.2825 1.7005 1.2605 1.7225 grafico de cajas 1.587 1.587 1.393 1.393 1.587 1.393 1.587 1.393 1.6
- 11. grafico histograma 1 1.4145 0 80 (Xi-X)^2*Fi 1 1.4145 4 0.03607467 2 1.4365 4 70 0.03194481 2 1.4365 0 0.06753763 2 1.4365 6 60 0.05286127 3 1.4585 6 0.00334888 3 1.4585 0 50 0.01356007 3 1.4585 26 0.05485871 4 1.4805 26 40 0.08363843 4 1.4805 0 0.05253121 4 1.4805 63 0.39635567 5 1.5025 63 30 5 1.5025 0 5 1.5025 69 20 0.00132119 6 1.5245 69 0.03634812 6 1.5245 0 10 6 1.5245 60 7 1.5465 60 0 1.2605 1.2825 1.3045 1.3265 1.3485 1.3705 1.3925 7 1.5465 0 7 1.5465 40 8 1.5685 40 SI ES ACEPTADO EL TRABAJO A REAL 8 1.5685 0 NECE 8 1.5685 24 9 1.5905 24 9 1.5905 0 9 1.5905 8 1.5905 0 1.49846667 0 1.49846667 1.49846667 90 0.03634812 1.53481478 0 grafico de cajas 1.53481478 90 1.587 8 1.5711629 0 1.5711629 90 1.393 8 1.60751102 0 1.60751102 90 1.393 1.587 1.46211855 0 1.46211855 90 8 8 1.42577043 0 1.42577043 90 5
- 12. 5 1.38942232 0 1.38942232 90 12 1.49846667 1.35 0 1.35 90 1.5 0 1.5 90 1.65 0 1.65 90
- 13. 1.4145 1.4145 GRAFICA D 1.4365 1.4365 80 1.4365 70 1.4585 1.4585 60 1.4585 50 1.4805 1.4805 40 1.4805 30 1.5025 20 1.5025 1.5025 10 1.5245 0 1.5245 1.5245 1.5465 1.5465 1.5465 1.5685 1.3925 1.4145 1.4365 1.4585 1.4805 1.5025 1.5245 1.5465 1.5685 1.5905 1.6125 1.6345 1.6565 1.6785 1.7005 1.7225 1.5685 GRAFIC 350 300 ADO EL TRABAJO A REALIZAR PORQUE ESTA ENTRE LOS LIMITES 250 NECESARIOS 200 150 100 50 0
- 15. GRAFICA DE BARRAS GRAFICA DE PAST GRAFICA DE BARRAS GRAFICA OJIVA GRAFICA DE 13 12 11 10 9 8 7 GRAFICA OJIVA 6 5 4 3 2 1 1.2 1.3 1.4
- 17. AFICA DE PASTEL 1.4035 1.4255 1.4475 1.4695 1.4915 1.5135 1.5355 1.5575 GRAFICA DE BIGOTES GRAFICA DE BIGOTES 1.4 1.5 1.6