2017 - Comparison of nitrifying microbial communities of two full-scale membrane bioreactors treating wastewaters from municipal solid wastes using 16S rDNA gene amplicon sequencing
•
1 recomendación•457 vistas

Barbarroja, P., Moreno-Mesonero, L., Zornoza, A., Fernández-Navarro, J., Alonso, J.L., Muñagorri, F., García, C., Álvarez, C. (2017) Comparison of nitrifying microbial communities of two full-scale membrane bioreactors treating wastewaters from municipal solid wastes using 16S rDNA gene amplicon sequencing. 7th congress of European microbiologists FEMS 2017, Valencia, Spain, 9-13 July 2017.
Recomendados

Recomendados
Más contenido relacionado
La actualidad más candente
La actualidad más candente (20)
Similar a 2017 - Comparison of nitrifying microbial communities of two full-scale membrane bioreactors treating wastewaters from municipal solid wastes using 16S rDNA gene amplicon sequencing
Similar a 2017 - Comparison of nitrifying microbial communities of two full-scale membrane bioreactors treating wastewaters from municipal solid wastes using 16S rDNA gene amplicon sequencing (20)
Más de WALEBUBLÉ
Más de WALEBUBLÉ (20)
Último
Último (20)
2017 - Comparison of nitrifying microbial communities of two full-scale membrane bioreactors treating wastewaters from municipal solid wastes using 16S rDNA gene amplicon sequencing
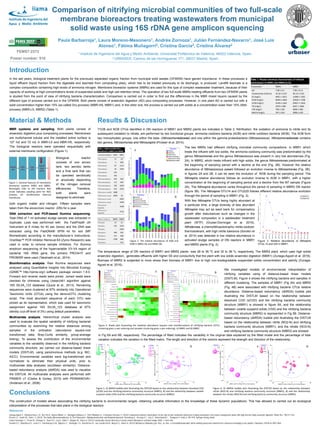
- 1. FEMS7-2373 Poster number: 518 Comparison of nitrifying microbial communities of two full-scale membrane bioreactors treating wastewaters from municipal solid waste using 16S rDNA gene amplicon squencing Paula Barbarroja1, Laura Moreno-Mesonero1, Andrés Zornoza1, Julián Fernández-Navarro1, José Luis Alonso1, Fátima Muñagorri2, Cristina García2, Cristina Álvarez2 1 Instituto de Ingeniería del Agua y Medio Ambiente, Universitat Politècnica de València, 46022 Valencia, Spain. 2 URBASER, Camino de las Hormigueras 171, 28031 Madrid, Spain Introduction In the last years, biological treatment plants for the previously separated organic fraction from municipal solid wastes (OFMSW) have gained importance. In these processes a liquid effluent (liquid fraction from the digestate and leachate from composting piles), which has to be treated previously to its discharge, is produced. Landfill leachate is a complex composition containing high levels of ammonia nitrogen. Membrane bioreactor systems (MBRs) are used for this type of complex wastewater treatment, because of their capacity of working at high concentrations levels of suspended solids and high cell retention times. The operation of two full-scale MBRs treating effluents from two OFMSW plants is studied from the point of view of nitrifying bacteria characterization. Comparison is carried out in order to find out the differences in the MBR mixed liquors caused by the different type of process carried out in the OFMSW. Both plants consist of anaerobic digestion (AD) plus composting processes. However, in one plant AD is carried out with a solid concentration higher than 15% (so-called Dry-process) (MBR-HS, MBR1) and, in the other one, the process is carried out with solids at a concentration lower than 10% (Wet- process) (MBR-LS, MBR2) (Table 1). Material & Methods MBR systems and sampling: Both plants consist of anaerobic digestion plus composting processes. Membranes are multichannel tubular and the installed active surface is 127 m2 and 72 m2 in MBR-LS and MBR-HS, respectively. The biological reactors were operated sequentially with external membrane configuration (Figure 1). both organic matter and nitrogen. Fifteen samples were taken from the anoxic/oxic reactor (DN) for a year. DNA extraction and PCR-based Illumina sequencing: Total DNA of 1 ml activated sludge sample was extracted in duplicate. Lysis was performed with the FastPrep® -24 instrument at 6 m/sec for 40 sec (twice) and the DNA was extracted using the FastDNA® SPIN kit for soil (MP Biomedicals) according to the manufacturer’s instructions. OneStep™ PCR Inhibitor Removal Kit (Zymo Research) was used in order to remove sample inhibitors. For Illumina amplicon sequencing of the hypervariable V3–V4 region of bacterial 16S rRNA gene, the primers PRO341F and PRO805R were used (Takahashi et al., 2014) . Bioinformatics analysis: Raw Illumina sequences were analysed using Quantitative Insights Into Microbial Ecology (QIIME™ http://qiime.org/) software package version 1.8.0. Forward and reverse reads were joined. Joined reads were ckecked for chimeras using Usearch61 algorithm against 16S SILVA_123 database (Quast et al., 2013). Remaining sequences were clustered at 97% similarity into Operational Taxonomic Units (OTUs) using the denovoOTU clustering script. The most abundant sequence of each OTU was picked as its representative, which was used for taxonomic assignment against 16S SILVA_123 database at 97% identity (cut-off level of 3%) using default parameters. Multivariate analysis: Hierarchical cluster analysis was used to evaluate the spatial variability of nitrifying bacterial communities by examining the relative distances among samples in the ordination (abundance square-root transformed data; Bray-Curtis similarity; group-average linking). To assess the contribution of the environmental variables to the variability observed in the nitrifying bacteria community structure, we carried out distance-based linear models (DISTLM), using parsimonious methods (e.g. BIC, AICC). Environmental variables were log-transformed and normalized to eliminate their physical units, prior to multivariate data analyses (euclidean similarity). Distance- based redundancy analysis (dbRDA) was used to visualize the DISTLM. All multivariate analyses were performed with PRIMER v7 (Clarke & Gorley, 2015) with PERMANOVA+ (Anderson et al., 2008). Results & Discussion TAOB and NOB OTUs identified in DN reactors of MBR1 and MBR2 plants are indicated in Table 2. Nitrification, the oxidation of ammonia to nitrite and its subsequent oxidation to nitrate, are performed by two functional groups. ammonia oxidizers bacteria (AOB) and nitrite oxidizers bacteria (NOB). The AOB form two monophyletic groups, one within the beta- (Nitrosomonadaceae) and one within the gamma-proteobacteria (Nitrosococcus). Nitrosomonadaceae contains two genera, Nitrosomonas and Nitrosospira (Prosser et al. 2014). Conclusions The construction of models allows associating the nitrifying bacteria to environmental ranges, obtaining valuable information to the knowledge of these dynamic populations. This has allowed to carried out an ecological interpretation of the processes that take place in the biological reactors References b Figure 1. General features of membrane bioreactor systems MBR1 and MBR2. Rectangles refer to the reactors. Red arrow indicates sanpling point for NGS analysis. UF: ultraflitration external membrane. The two MBRs had different nitrifying microbial community compositions. In MBR1 which treats the influent with low solids, the ammonia oxidizing community was predominated by the genus Nitrosomonas and the genus Nitrosococcus was present in very low abundances (Fig. 2A). In MBR2, which treats influent with high solids, the genus Nitrosomonas predominated at the beginning of sampling period with a decline at the end (Fig. 2B). However the relative abundance of Nitrosococcus oceani followed an evolution inverse to Nitrosomonas (Fig. 2B). In figures 2A and 2B, it can be seen the evolution of NOB during the sampling period. The Nitrospira relative abundance follows an evolution inverse to AOB in MBR1, with a higher concentration at the beginning of sampling period and a decline from the M7 sample (Figure 2A). The Nitrospira abundance varies throughout the period of sampling in MBR2 DN reactor (figure 3B). The Nitrospira OTU14 and OTU225 follows different relative abundance evolution through the period of sampling in MBR1 (Fig. 3). a b Table 1. Physico-chemical characteristics of influent wastewaters to MBR1 and MBR2 (n=6). Parameters MBR1 MBR2 pH 7,99 ± 0.1 7.99 ± 0.11 Conductivity (mS/cm) 16.26 ± 6.97 40.13 ± 4.65 SS (mg/L) 4401 ± 1812 12940 ± 1301 tCOD (mg/L) 9430 ± 5944 32910 ± 7106 sCOD (mg/L) 3140 ± 1262 20927 ± 7635 TN (mg/L) 1879 ± 990 6267 ± 2666 sTN (mg/L) 790 ± 320 4890 ± 406 NH4-N (mg/L) 767 ± 324 3990 ± 410 Zuriaga-Agustí E., Mendoza-Roca J.A., Bes-Piá A., Alonso-Molina J.L., Muñagorri-Mañueco F., Ortiz-Villalobos G., Fernández-Giménez E. (2016) Comparison between mixed liquors of two side-stream membrane bioreactors treating wastewaters from waste management plants with high and low solids anaerobic digestion. Water Res. 100:517-525. Prosser J.I., Head I.M., Stein L.Y. (2014). The family Nitrosomonadaceae. In The Prokaryotes- Alphaproteobacteria and Betaproteobacteria. Rosenberg E., DeLong E.F., Lory S., Stackebrandt E., Thompson F. (eds), p. 901-918. Springer-Verlag, Berlin. Gruber-Dorninger C., Pester M., Kitzinger K., Savio D.F., Loy A., Rattei T., Wagner M., Daims H. (2015) Functionally relevant diversity of closely related Nitrospira in activated sludge ISME J. 9:643-655. Sorokin D.Y., Vejmelkova D., Lücker S., Streshiskaya G.M., Rijpstra I.C., Sinninghe J.S., Kleerbezem R., van Loosdrecht M., Muyzer G., Daims H. (2014) Nitrolancea hollandica gen. Nov., sp. Nov., a chemolithoautotrophic nitrite-oxidizing bacterium isolated from a bioreactor belonging to the phylum Chloroflexi. IJSEM 64:1859-1865. Biological reactor consists of one anoxic tank, two aerobic tanks and a final tank that can be operated aerobically or anoxically depending of the nitrogen removal efficiencies. Therefore, both plants were designed to eliminate Table 1. AOB and NOB OTUs identified in a MBR1 and MBR2 Ammonia oxidizers MBR1 MBR2 Nitrosomonas 28 20 Nitrosomonas 74 908 Nitrosomonas 92 1115 Nitrosomonas 10 1963 Nitrosomonas 102 - Nitrosomonas 203 - Nitrosomonadaceae 103 349 Nitrosomonadaceae 112 409 Nitrosomonadaceae 339 1004 Nitrosomonadaceae 419 1059 Nitrosococcus mobilis 3608 - Nitrosococcus oceani 6040 18 Nitrosococcus oceani - 2001 Nitrosococcus oceani - 3200 Nitrosococcus halophilus - 1938 Nitrosococcus halophilus - 2123 Nitrite oxidizers MBR1 MBR2 Nitrospira 14 13 Nitrospira 225 1423 Nitrospira - 2964 Nitrolancea 499 205 Nitrolancea 511 308 Nitrolancea 2789 486 Nitrolancea - 510 Figure 2. The relative abundance of AOB and NOB in MBR1 (A) and MBR2 (B). b With few Nitrospira OTUs being highly abundant at a particular time, a large diversity of less abundant Nitrospira may act as seed bank for compensatory growth after disturbances such as changes in the wastewater compositon in a wastewater treatment plant (WTP) (Gruber-Dorninger et al. 2015). Nitrolancea, a chemolitthoautotrophic nitrite-oxidizer, thermotolerant, with high nitrite tolerance (Sorokin et al. 2014) was detected in low relative abundance in activated sludge samples of DN reactors in MBR1 and MBR2 plants (Fig. 2). The temperature range of DN reactors of MBR1 and MBR2 plants was 28 to 36 ºC and 32 to 38 ºc, respectively. The MBR2 plant, which uses high solids anaerobic digestion, generates effluents with higher SS and conductivity that the plant with low solids anaerobic digestion (MBR1) (Zuriaga-Agustí et al. 2016). Biomass of MBR2 is subjected to more stress than biomass of MBR1 due to high non-biodegradable suspended solids concentration and salinity (Zuriaga- Agustí et al. 2016). d Figure 4. Shade plot illustrating the realative abundance (square root transformation) of nitrifying bacteria (OTUs clustering gives y-axis ordering and samples clustering gives x-axis ordering). A) MBR1 and B) MBR2. We investigated models of environmental interpretation of nitrifying variables using of distance-based linear models (DISTLM). Figure 4 shows the nitrifying bacteria and samples in different clustering. The samples of MBR1 (Fig 4A) and MBR2 (Fig. 4B) were associated with nitrifying bacteria OTUs relative abundance. Distance-based redundancy (dbRDA) bubble plot illustrating the DISTLM based on the relationship between dissolved COD (sCOD) and the nitrifying bacteria community structure (MBR1) is showed in figure 5A, and the relationship between volatile suspend solids (VSS) and the nitrifying bacteria community structure (MBR2) is represented in Fig 5B. Distance- based redundancy (dbRDA) bubble plot illustrating the DISTLM based on the relationship between nitrite (NO2-N) and nitrifying bacteria community structure (MBR1), and the nitrate (NO3-N) and nitrifying bacteria community structure (MBR2) are showed in Fig 6A and 6B, respectively. The percentage of fitted indicates the variability in the original data explained by the fitted model and the percentage of total variation indicates the variation in the fitted matrix. The length and direction of the vectors represent the strength and direction of the relationship. Figure 5. A) dbRDA bubble plot illustrating the DISTLM based on the relationship between dissolved COD (sCOD) and the nitrifying bacteria community structure (MBR1), B) and the relationhip between volatile suspend solids (VSS) and the nitrifying bacteria community structure (MBR2). Figure 6. A) dbRDA bubble plot illustrating the DISTLM based on the relationship between nitrite (NO2-N) and nitrifying bacteria community structure (MBR1), B) and the relationship between the nitrate (NO3-N) and nitrifying bacteria community structure (MBR2). Figure 3. Relative abundance of Nitrospira OTUs 14 and 225 in MBR1.