Spectral CT - Head to Toe Poster
•
2 recomendaciones•901 vistas

Review of current applications of spectral CT from head to toe. Contact info: Garry Choy MD MSc, Department of Radiology, Massachusetts General Hospital, Harvard Medical School, Boston, MA

Recomendados
Más contenido relacionado
La actualidad más candente
La actualidad más candente (20)
Similar a Spectral CT - Head to Toe Poster
Similar a Spectral CT - Head to Toe Poster (20)
Más de Garry Choy MD MBA
Más de Garry Choy MD MBA (7)
Último
Último (20)
Spectral CT - Head to Toe Poster
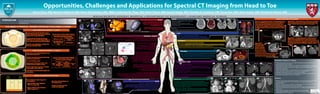
- 1. Figure 1A -- Myocardial Infraction with DSDECT. Images acquired by DSDECT demonstrate improved visualization of delayed enhancement in setting of myocardial infarction (arrows) Figure 1B -- Myocardial Profusion with DSDECT. Filling defects (arrow) in myocardial ischemia are better visualized with DSDECT Figures 8A-B -- Differentiation of Hemorrhage from Contrast with DSDECT. Virtual non-contrast images which can enable differentiation of hyperdense hemorrhage (arrow) from contrast enhancement. Figures 9A-B -- Beam Hardening Artifact Reduction from Posterior Fossa. 70keV image (B) shows beam hardening artifacts from posterior fossa (arrow) which can hinder evaluation of brain stem. In 140keV monochromatic image (B) reduction of artifacts (arrow) is seen. Figures 12A-B -- Pancreatic Necrosis Assessment with DSDECT. 120kvP weighted image (A) shows a hypoattenuating area (arrow) in the pancreatic tail region of pig induced by EUS guided microsphere injection representative of necrosis. Iodine overlay image (B) shows absence of iodine signal within necrotic area (arrow). Figures 11A-B -- Adrenal Lesion Characterization with DSDECT. Axial average weighted Dual Energy CT image (A) shows solid left adrenal mass (circle). The density is 42.3 HU. Virtual non contrast image (B) at same slice position show mass (circle) to be hypoattenuating with density of 1.2 HU which is consistent with adrenal adenoma. This can essentially eliminate need of unenhanced CT. Dual source CT is a 64-slice CT with two X-ray tubes and two detector assembly mounted onto a gantry with an angle of 90 degrees Image Based Reconstruction Technology Both tubes can be operated independently or in unison with respect to their kV and mA settings. Tube A has larger FOV of 50cm and Tube B has relatively smaller FOV of 29cm Data from the two acquisitions (80 and 140 kVp) Three Material Decomposition Algorithm Soft Tissue, Fat, Iodine Water, Uric Acid, Calcium Iodine Distribution and Virtual Unenhanced Image Stone Analysis The new detector consists of upper and lower scintillators – Upper scintillator stops and detects the lower-energy X-rays – Bottom scintillator stops and detects higher-energy X-rays Signals from both scintillators can be combined as well A single X-ray tube is used with simultaneous acquisition Single-source ultra-fast kVp switching and near- perfect helical registration Projection Based Reconstruction Technology Full 50cm Scan Field of View 101 user selectable energies Acquires up to 128 slices per rotation when using the Gemstone Spectral Imaging Derives images for the separation of materials such as calcium, iodine and water Reduces Beam Hardening artifacts by 50% and metal artifacts Data from single acquisitions (80 and 140 kVp) Post-Processing of Dual Energy Data 140kVp Image Monochromatic Images Selectable over Range of 40-140 keV Material Density Images Derived from Two Material Decomposition Effective Z Image Garry Choy, MD; Naveen Kulkarni, MD; Brian Ghoshhajra, MD, MBA; Catherine M. Phan, MD; Efren Flores, MD; Anand Singh, MD; Onofrio A. Catalano, MD; Sung Kim, MD; Rajiv Gupta, MD; Dushyant Sahani, MD Opportunities, Challenges and Applications for Spectral CT Imaging from Head to Toe MASSACHUSETTS GENERAL HOSPITAL • Department of Radiology • HARVARD MEDICAL SCHOOL PURPOSE/AIM To review advances in spectral imaging technology with dual-source (DS) and Gemstone Spectral Imaging (GSI) and the wide spectrum of new CT applications in imaging of various organ systems from head to toe. Challenges in Spectral CT Imaging 1. Processed material density images have a different appearance than the standard images and familiarity with these is needed. 2. By minimizing the number of phases of CT acquisition such as eliminating the unenhanced and early phase, the effective dose of Dual Engery CT can be substantially lowered. However, if similar phase acquisition is performed as Singular Energy CT, the radiation dose can be higher with Dual Engery CT. 3. In Dual-source Dual Engery CT, a smaller field of view with tube B and large body habitus remains a limitation to exploit benefits for all body parts and patient sizes. 4. Confident characterization of lesions < 5mm in size can be difficult. 5. Image processing and reconstruction of multiple image series from Dual Energy data and their analysis can also impact the overall CT work flow. Summary 1. Spectral CT is an exciting technology that empowers CT with new and improved capabilities for material differentiation, hence a more efficient tissue characterization and lesion detection method. 2. Spectral CT has the potential to simplify CT acquisition protocols as well as contrast media utilization while providing desired information and details. 3. Appropriate selection of patients and clinical indications for spectral CT imaging is crucial to meet the dual objectives of providing high quality care without additional significant radiation risk. 4. As spectral imaging matures with continued clinical research and becomes widely available, radiologists will be able to truly harness the power of this technology in the realm of clinical care. Figure 10 -- Lung Perfusion Imaging with DSDECT. DSDECT images of lung perfusion demonstrate perfusion defect consistent with compromised perfusion in the setting of pulmonary embolism (arrows). Figures 13A-B -- Differentiating Hemorrhage vs Enhancement in patient with post RF ablation for HCC with SSDECT. Contrast enhanced 70keV monochromatic image (A) shows hyperdensity within post radiofrequency ablation bed (arrow) which could be attributed to hemorrhage secondary to coagulation necrosis or enhancement. Iodine image (B) does not show enhancement within ablation bed (arrow) ruling out local recurrence. Figure 14 -- Stent Patency with SSDECT. Iodine image confirms stent patency (arrow) even when Dual Energy scan was performed with low contrast dose of only 30ml. Figures 15A-B-- Increased Conspicuity of Lesion with Low Energy Monochromatic Image. 40keV monochromatic image (A) shows increased conspicuity of hepatic lesion (arrow) which is almost indistinct on 70keV image (B). Figures 2A-B -- Renal Stone Composition with DSDECT. Color coded images derived from three material decomposition technique showing uric acid stone (arrow) encoded in red (A) and non uric acid stone (arrow) encoded in blue color (B). Figures 3A-B -- Renal Mass Characterization using SSDECT. 120 kvP image (A) shows a complex exophytic lesion with calcification (arrow) and subtle hyperdensity in lower pole of right kidney. Iodine image (B) does not show any enhancement of lesion (arrow). Figures 4A-E -- Stone Composition with SSDECT. On water images (A & C) pure uric acid stones (arrow) embedded in potatoes and bovine kidney are seen. Same stones however are not appreciated on iodine image (B & D). Water and iodine images thus help in differentiating uric acid from non uric acid stone. The graph displaying effective Z vs HU value (E) further helps differentiating non uric acid stones based on their effective Z value. Figures 5A-C -- Renal Lesion Characterization with SSDECT. Contrast enhanced 70keV image (A) showing exophytic cyst (arrow) with hyperdensity which is suspicious for malignancy or could be secondary to hyperdense cyst. Iodine image (B) and color overlay map (C) shows that the lesion does not enhance (arrow). Figures 6A-B -- Evaluation of Hematuria with SSDECT. Axial monochromatic image in excretory phase (A) shows contrast agent in the left renal collecting system in 50-year-old evaluated for hematuria. In the same patient water image (B) reconstructed from SSDECT excretory phase shows a 3mm calculi in calyx (arrow). Water image can essentially eliminate need of unenhanced CT in detection of urinary tract calculi and can reduced total radiation dose. Figures 16A-B -- Increased Sensitivity of Endoleak Detection using SSDECT. On 140kVp image (A) the endoleak (white arrow) and contrast enhancement within stent (red arrow) are less conspicuous. On 40keV monochromatic image (B) reconstructed from Dual Energy data endoleak (white arrow) and aortic enhancement (red arrow) is more conspicuous. Dual Energy CT can thus salvage contrast dose required for CTA but still achieve optimal contrast enhancement. Figures 17A-B -- Separation of Calcified Plaque from Contrast with DSDECT. MIP images of abdominal aorta and iliac arteries before (A) and after (B) subtraction of calcified plaques enables better quantification of plaque burden and lumen patency. Figures 7A-C -- Evaluation of Gout with DSDECT. Images created with post-processing software specifically for gout based on a three material decomposition algorithm allowing the characterization of uric acid (colored in green and arrow) from bone (colored in blue) and bone marrow (colored in pink) for the 2D images. For the 3D image, uric acid is colored in green. (Image Courtesy of Rajiv Gupta and Catherine Phan) Figure 18 -- Material Differentiation using Spectral Attenuation Curve with SSDECT. Spectral attenuation curves of three different materials are for contrast in abdominal aorta, fat and soft tissue - corresponding ROI marked in CT. The spectral attenuation curve may be a signature sign of individual material and may help differentiate two different materials having similar attenuation values on Single Energy CT. Figure 19A-B -- Artifact Reduction using Metal Artifact Reduction Algorithm (MARS) using SSDECT. 70 keV monochromatic image (A) shows artifacts caused by coils in left iliac artery aneurysm obscuring adjacent structure. MARS image (B) reconstructed from Dual Energy data shows significant reduction in streak artifacts. Figure 20A-B -- Artifact Reduction on Iodine Image from SSDECT. Artifacts caused by surgical clip in 70 keV mono (A) are significantly reduced in iodine image (B) processed from Dual Energy data. Figure 21A-B -- Small Lesion Detection on Water Image from SSDECT. Water image (A) derived from contrast enhanced series shows two small hepatic lesions (arrows). On routine unenhanced CT (B) these lesions (arrows) are appreciate as well. Water images can thus obviate need of unenhanced CT phase in detection of lesion in solid organs. Dual Energy CT Principles – Different approaches to Dual Energy ScanningDual Energy CT Principles – Different approaches to Dual Energy Scanning Dual Source Dual Energy CT - DSDECTDual Source Dual Energy CT - DSDECT Single Source Dual Energy CT - SSDECTSingle Source Dual Energy CT - SSDECT Energy Discriminating DetectorsEnergy Discriminating Detectors WHOLE-BODY WIDE APPLICATIONS HEART BRAIN ADRENALS BONE ABDOMEN - KIDNEYS VASCULAR ABDOMEN - LIVER PANCREAS LUNG 1A 1B2A 2B 3A 3B 4A 4B 4C 4D 4E Uric Acid Crystals 5A 5B 5C 6A 6B 7A 7B 7C 8A 8B 9A 9B 10 11A 11B 12A 12B 13A 13B 14 15A 15B 16A 16B 17A 17B 18 19A 19B 21A 21B 20A 20B Uric Acid Stone Non Uric Acid Stone Subtle Hyperdensity No Enhancement 120 kvP MD Iodine MD Water Potatoes Uric Acid Stones Non Uric Acid Stones MD Iodine Potatoes Uric Acid Stones Non Uric Acid Stones MD Water Bovine Kidney Non Uric Acid Stones Uric Acid Stones MD Iodine Bovine Kidney Non Uric Acid Stones Uric Acid Stones E- Effective-Z vs HU graph to differentiate stones based on Z value Hyperdensity Cyst No Enhancement No Color Uptake 70keV Mono MD Iodine Color Overlay 70keV Mono MD Water derived from excretory phase CT 70keV Mono 140keV Mono Artifacts more conspicuous Artifacts less conspicuous Average weighted DECT Artifacts from Coils Iodine Map120kvP 70keV Mono MD Iodine Hyperdensity in RFA site-Hemorrhage/ Enhancement No Enhancement MD Iodine Stent Patency 40keV Mono Increased Lesion Conspicuity Same Lesion is Inconspicuous 140keV Endoleak Less Conspicuous 70keV Mono 40keV Mono Endoleak More Conspicuous Before Calcium Subtraction After Calcium Subtraction 70keV Mono 70keV Mono MARS 70keV Mono MD Iodine 120 kvPMD Water Reducted Artifacts Delayed Enhancement Perfusion Defect Hemmorrhage Enhancement Perfusion Defects Virtual non-contrast Artifacts from Clips Reducted Artifacts