Datos de la población mundial 2015. (Population Reference Bureau) 2015 world-population-data-sheet eng
•
1 recomendación•4,784 vistas

Datos de la Población Mundial en 2015. Datos de todos los países del Mundo. gráficos, pirámides de población, natalidad, mortalidad, fecundidad, esperanza de vida, maternidad, envejecimiento, previsiones mundiales, etc.

Recomendados
Recomendados
Más contenido relacionado
La actualidad más candente
La actualidad más candente (20)
Destacado
Destacado (20)
Similar a Datos de la población mundial 2015. (Population Reference Bureau) 2015 world-population-data-sheet eng
Similar a Datos de la población mundial 2015. (Population Reference Bureau) 2015 world-population-data-sheet eng (20)
Más de Juan Martín Martín
Más de Juan Martín Martín (20)
Último
Último (20)
Datos de la población mundial 2015. (Population Reference Bureau) 2015 world-population-data-sheet eng
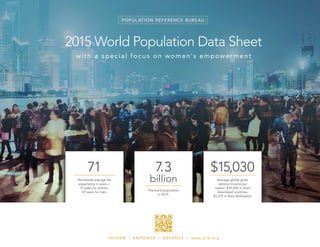
- 1. POPUL ATION REFERENCE BUREAU 2015 World Population Data Sheet with a special focus on women’s empowerment 71 Worldwide average life expectancy in years— 73 years for women, 69 years for men. 7.3 billion The world population in 2015. $15,030 Average global gross national income per capita—$39,020 in more developed countries, $2,270 in least developed. I N F O R M | E M P O W E R | A D VA N C E | w w w. p r b . o r g
- 2. © 2015 Population Reference Bureau See notes on page 21 2015 WORLD POPULATION DATA SHEET 2 NOTE: 2015 data refer to latest data available. MOST POPULOUS COUNTRIES, 2015 AND 2050 2014 2050 COUNTRY, 2050 POPULATION (MILLIONS) India 1,660 China 1,366 United States 398 Nigeria 397 Indonesia 366 Pakistan 344 Brazil 226 Bangladesh 202 Congo, Dem. Rep. 194 Ethiopia 165 COUNTRY, 2015 POPULATION (MILLIONS) China 1,372 India 1,314 United States 321 Indonesia 256 Brazil 205 Pakistan 199 Nigeria 182 Bangladesh 160 Russia 144 Mexico 127 COUNTRIES WITH THE HIGHEST AND LOWEST TOTAL FERTILITY RATES HIGHEST 2015 Niger 7.6 South Sudan 6.9 Congo, Dem. Rep. 6.6 Somalia 6.6 Chad 6.5 Burundi 6.2 Central African Republic 6.2 Angola 6.1 Burkina Faso 6.0 Mali 5.9 Mozambique 5.9 Uganda 5.9 LOWEST 2015 Bosnia-Herzegovina 1.2 Korea, South 1.2 Portugal 1.2 Taiwan 1.2 Greece 1.3 Moldova 1.3 Poland 1.3 Romania 1.3 Singapore 1.3 Spain 1.3
- 3. © 2015 Population Reference Bureau See notes on page 21 2015 WORLD POPULATION DATA SHEET 3 POPULATION CLOCK, 2015 WORLD MORE DEVELOPED COUNTRIES LESS DEVELOPED COUNTRIES Population 7,336,435,000 1,254,199,000 6,082,235,000 Births per Year 145,973,000 13,760,000 132,213,000 Day 399,926 37,700 362,226 Minute 278 26 252 Deaths per Year 57,052,000 12,283,000 44,769,000 Day 156,306 33,652 122,654 Minute 109 23 85 Natural increase per Year 88,921,000 1,477,000 87,444,000 Day 243,620 4,047 239,573 Minute 169 3 166 Infant deaths per Year 5,351,000 73,000 5,278,000 Day 14,660 201 14,459 Minute 10 0.1 10
- 4. © 2015 Population Reference Bureau 2015 WORLD POPULATION DATA SHEET 4 W O R L D P O P U L AT I O N H I G H L I G H T S FO CUS O N WO MEN ’S EMPOW ERMENT Large PurchasesOwn Health 2012– 2013 20062001 201120062001 2013– 2014 20072001– 2002 20122004– 2006 2000 201220072002 NepalMali Zambia Peru Jordan 0 10 20 30 40 50 60 70 80 90 100 17 20 18 15 18 32 27 47 53 66 57 37 42 65 74 66 75 83 74 84 88 91 71 77 89 64 79 72 56 17 Kenya Egypt Philippines Jordan 64 41 58 71 40 36 31 43 52 47 80 Rates of Early Marriage Fall, Particularly Among Those Under 15 Early marriage (before age 18) undermines the rights and livelihood opportunities of adolescent girls by leaving them vulnerable to the health risks of early pregnancy and childbearing, and prematurely ending their schooling. Rates of early marriage have declined broadly in the past 20 years, particularly among girls who are under age 15. Part of the overall decline reflects improvements in girls’ access to education: As girls educational attainment improves, the proportion marrying early tends to fall. Better employment opportunities for women and girls also can help delay marriages. In Bangladesh, expanded employment in the garment industry is linked to notably lower rates of marriage among rural migrants under age 15. The percentage of Bangladeshi girls married by age 18 has declined much more slowly as the youngest potential brides tend to postpone marriage by only a few years. The majority of Bangladeshi girls continue to marry before age 18. Women Post Uneven Gains in Household Decisionmaking Power Married women in many countries are increasingly likely to have a say in household decisions, but these gains do not necessarily apply to every type of decision. When women are included in decisions about household spending, more money tends to be spent for the benefit of women and children. And when women are able to make decisions about their health care, they are less vulnerable to preventable diseases. Progress in these areas has varied by country, and even in countries showing notable gains, many women still do not engage in all types of important decisions. For example, in Nepal, only 66 percent of women have a say about their own health care decisions. The same percentage of Zambian women have the opportunity to make decisions about large household purchases. Family Planning Needs Increasingly Met by Modern Methods, but More Progress Needed “Demand for family planning satisfied with modern methods” has emerged as a key indicator of contraceptive availability and use. The indicator measures the proportion of women who want to delay or limit childbearing and who are using modern methods of contraception. Family planning experts have urged countries to strive for meeting at least 75 percent of demand with modern methods. Over the past two decades, a significant number of less developed countries have seen increases in the share of demand satisfied with modern methods, but many countries remain far below the proposed 75 percent benchmark. They will need to accelerate progress over the coming decade so that increased contraceptive use can translate into improved maternal and child health, slower population growth, increased economic well-being, and environmental sustainability. Source: ICF International, Demographic and Health Surveys. Source: ICF International, Demographic and Health Surveys. Percent of Young Women Married by Age 15 (numbers in white) and Age 18 (numbers in black) Percent of Demand for Family Planning Satisfied by Modern Contraceptive Methods Percent of Currently Married Women Who Have a Say in Decisions About This Topic 83 76 73 65 49 41 27 17 18 19 20121991– 1992 201419922011200020111993– 1994 20121992 PeruEgyptEthiopiaBangladeshNiger 47 28 47 29 19 16 7 2 3 3 Percent Who Agree That Husband Is Justified Beating Wife if She Leaves the House Without Informing Him Acceptance of Wife Beating Recedes Violence against women poses a serious challenge to women’s empowerment. Combating such violence often requires changing the attitudes and beliefs of both men and women. In fact, in some countries, substantial percentages of women actually agree that a husband has the right to beat a wife under certain circumstances. Many of these women believe a husband is justified in hitting a wife who goes out on her own without telling the husband. It is encouraging that these beliefs appear to be moderating in most countries. For example, in 2013, 13 percent of Nigerian men and 25 percent of Nigerian women viewed a wife leaving home without telling the husband as justification for wife beating, down from 19 percent and 32 percent, respectively, in 2008. Zambia also showed notable drops for both men and women between 2007 and 2013-2014. Globally, however, there is still a long path to achieve zero global tolerance of this harmful practice. MenWomen 20112006 Uganda 20132008 Nigeria 40 26 52 38 32 25 19 13 W O R L D P O P U L AT I O N FO CUS ON WOMEN ’S EMPO 22001 M 0 10 20 30 40 50 60 70 80 90 100 17 17 Rates of Early Marriage Fall, Particularly Among Those Under 15 Early marriage (before age 18) undermines the rights and livelihood opportunities of adolescent girls by leaving them vulnerable to the health risks of early pregnancy and childbearing, and prematurely ending their schooling. Rates of early marriage have declined broadly in the past 20 years, particularly among girls who are under age 15. Part of the overall decline reflects improvements in girls’ access to education: As girls educational attainment improves, the proportion marrying early tends to fall. Better employment opportunities for women and girls also can help delay marriages. In Bangladesh, expanded employment in the garment industry is linked to notably lower rates of marriage among rural migrants under age 15. The percentage of Bangladeshi girls married by age 18 has declined much more slowly as the youngest potential brides tend to postpone marriage by only a few years. The majority of Bangladeshi girls continue to marry before age 18. Women Married women in every type of dec women and child Progress in these of important deci percentage of Za Family Planning Needs Increasingly Met by Modern Methods, Source: ICF International, Demographic and Health Surveys. Source: ICF Intern Percent of Young Women Married by Age 15 (numbers in white) and Age 18 (numbers in black) Percent of Curr 83 76 73 65 49 41 27 17 18 19 20121991– 1992 201419922011200020111993– 1994 20121992 PeruEgyptEthiopiaBangladeshNiger 47 28 47 29 19 16 7 2 3 3 Accepta OPULATION (MILLIONS) 1,660 1,366 398 397 366 344 226 202 194 165 EVELOPED COUNTRIES 082,235,000 132,213,000 362,226 252 2015 1.2 1.2 1.2 1.2 1.3 1.3 1.3 1.3 1.3 1.3
- 5. © 2015 Population Reference Bureau 2015 WORLD POPULATION DATA SHEET 5 W O R L D P O P U L AT I O N H I G H L I G H T S FO CUS O N WO MEN ’S EMPOW ERMENT Large PurchasesOwn Health 2012– 2013 20062001 201120062001 2013– 2014 20072001– 2002 20122004– 2006 2000 201220072002 NepalMali Zambia Peru Jordan 0 10 20 30 40 50 60 70 80 90 100 17 20 18 15 18 32 27 47 53 66 57 37 42 65 74 66 75 83 74 84 88 91 71 77 89 64 79 72 56 17 Kenya Egypt Philippines Jordan 64 41 58 71 40 36 31 43 52 47 80 Rates of Early Marriage Fall, Particularly Among Those Under 15 Early marriage (before age 18) undermines the rights and livelihood opportunities of adolescent girls by leaving them vulnerable to the health risks of early pregnancy and childbearing, and prematurely ending their schooling. Rates of early marriage have declined broadly in the past 20 years, particularly among girls who are under age 15. Part of the overall decline reflects improvements in girls’ access to education: As girls educational attainment improves, the proportion marrying early tends to fall. Better employment opportunities for women and girls also can help delay marriages. In Bangladesh, expanded employment in the garment industry is linked to notably lower rates of marriage among rural migrants under age 15. The percentage of Bangladeshi girls married by age 18 has declined much more slowly as the youngest potential brides tend to postpone marriage by only a few years. The majority of Bangladeshi girls continue to marry before age 18. Women Post Uneven Gains in Household Decisionmaking Power Married women in many countries are increasingly likely to have a say in household decisions, but these gains do not necessarily apply to every type of decision. When women are included in decisions about household spending, more money tends to be spent for the benefit of women and children. And when women are able to make decisions about their health care, they are less vulnerable to preventable diseases. Progress in these areas has varied by country, and even in countries showing notable gains, many women still do not engage in all types of important decisions. For example, in Nepal, only 66 percent of women have a say about their own health care decisions. The same percentage of Zambian women have the opportunity to make decisions about large household purchases. Family Planning Needs Increasingly Met by Modern Methods, but More Progress Needed “Demand for family planning satisfied with modern methods” has emerged as a key indicator of contraceptive availability and use. The indicator measures the proportion of women who want to delay or limit childbearing and who are using modern methods of contraception. Family planning experts have urged countries to strive for meeting at least 75 percent of demand with modern methods. Over the past two decades, a significant number of less developed countries have seen increases in the share of demand satisfied with modern methods, but many countries remain far below the proposed 75 percent benchmark. They will need to accelerate progress over the coming decade so that increased contraceptive use can translate into improved maternal and child health, slower population growth, increased economic well-being, and environmental sustainability. Source: ICF International, Demographic and Health Surveys. Source: ICF International, Demographic and Health Surveys. Percent of Young Women Married by Age 15 (numbers in white) and Age 18 (numbers in black) Percent of Demand for Family Planning Satisfied by Modern Contraceptive Methods Percent of Currently Married Women Who Have a Say in Decisions About This Topic 83 76 73 65 49 41 27 17 18 19 20121991– 1992 201419922011200020111993– 1994 20121992 PeruEgyptEthiopiaBangladeshNiger 47 28 47 29 19 16 7 2 3 3 Percent Who Agree That Husband Is Justified Beating Wife if She Leaves the House Without Informing Him Acceptance of Wife Beating Recedes Violence against women poses a serious challenge to women’s empowerment. Combating such violence often requires changing the attitudes and beliefs of both men and women. In fact, in some countries, substantial percentages of women actually agree that a husband has the right to beat a wife under certain circumstances. Many of these women believe a husband is justified in hitting a wife who goes out on her own without telling the husband. It is encouraging that these beliefs appear to be moderating in most countries. For example, in 2013, 13 percent of Nigerian men and 25 percent of Nigerian women viewed a wife leaving home without telling the husband as justification for wife beating, down from 19 percent and 32 percent, respectively, in 2008. Zambia also showed notable drops for both men and women between 2007 and 2013-2014. Globally, however, there is still a long path to achieve zero global tolerance of this harmful practice. MenWomen 20112006 Uganda 20132008 Nigeria 40 26 52 38 32 25 19 13 L AT I O N H I G H L I G H T S WOMEN ’S EMPOW ERMENT Large PurchasesOwn Health 2012– 2013 20062001 201120062001 2013– 2014 20072001– 2002 20122004– 2006 2000 201220072002 NepalMali Zambia Peru Jordan 0 10 20 30 40 50 60 70 80 90 100 17 20 18 15 18 32 27 47 53 66 57 37 42 65 74 66 75 83 74 84 88 91 71 77 89 64 79 72 56 17 der 15 le to the health adly in the past ducation: As n and girls of marriage as the youngest e 18. Women Post Uneven Gains in Household Decisionmaking Power Married women in many countries are increasingly likely to have a say in household decisions, but these gains do not necessarily apply to every type of decision. When women are included in decisions about household spending, more money tends to be spent for the benefit of women and children. And when women are able to make decisions about their health care, they are less vulnerable to preventable diseases. Progress in these areas has varied by country, and even in countries showing notable gains, many women still do not engage in all types of important decisions. For example, in Nepal, only 66 percent of women have a say about their own health care decisions. The same percentage of Zambian women have the opportunity to make decisions about large household purchases. hods, Source: ICF International, Demographic and Health Surveys. Percent of Currently Married Women Who Have a Say in Decisions About This Topic 19 2012– Peru 3 Acceptance of Wife Beating Recedes
- 6. © 2015 Population Reference Bureau 2015 WORLD POPULATION DATA SHEET 6 W O R L D P O P U L AT I O N H I G H L I G H T S FO CUS O N WO MEN ’S EMPOW ERMENT Large PurchasesOwn Health 2012– 2013 20062001 201120062001 2013– 2014 20072001– 2002 20122004– 2006 2000 201220072002 NepalMali Zambia Peru Jordan 0 10 20 30 40 50 60 70 80 90 100 17 20 18 15 18 32 27 47 53 66 57 37 42 65 74 66 75 83 74 84 88 91 71 77 89 64 79 72 56 17 Kenya Egypt Philippines Jordan 64 41 58 71 40 36 31 43 52 47 80 Rates of Early Marriage Fall, Particularly Among Those Under 15 Early marriage (before age 18) undermines the rights and livelihood opportunities of adolescent girls by leaving them vulnerable to the health risks of early pregnancy and childbearing, and prematurely ending their schooling. Rates of early marriage have declined broadly in the past 20 years, particularly among girls who are under age 15. Part of the overall decline reflects improvements in girls’ access to education: As girls educational attainment improves, the proportion marrying early tends to fall. Better employment opportunities for women and girls also can help delay marriages. In Bangladesh, expanded employment in the garment industry is linked to notably lower rates of marriage among rural migrants under age 15. The percentage of Bangladeshi girls married by age 18 has declined much more slowly as the youngest potential brides tend to postpone marriage by only a few years. The majority of Bangladeshi girls continue to marry before age 18. Women Post Uneven Gains in Household Decisionmaking Power Married women in many countries are increasingly likely to have a say in household decisions, but these gains do not necessarily apply to every type of decision. When women are included in decisions about household spending, more money tends to be spent for the benefit of women and children. And when women are able to make decisions about their health care, they are less vulnerable to preventable diseases. Progress in these areas has varied by country, and even in countries showing notable gains, many women still do not engage in all types of important decisions. For example, in Nepal, only 66 percent of women have a say about their own health care decisions. The same percentage of Zambian women have the opportunity to make decisions about large household purchases. Family Planning Needs Increasingly Met by Modern Methods, but More Progress Needed “Demand for family planning satisfied with modern methods” has emerged as a key indicator of contraceptive availability and use. The indicator measures the proportion of women who want to delay or limit childbearing and who are using modern methods of contraception. Family planning experts have urged countries to strive for meeting at least 75 percent of demand with modern methods. Over the past two decades, a significant number of less developed countries have seen increases in the share of demand satisfied with modern methods, but many countries remain far below the proposed 75 percent benchmark. They will need to accelerate progress over the coming decade so that increased contraceptive use can translate into improved maternal and child health, slower population growth, increased economic well-being, and environmental sustainability. Source: ICF International, Demographic and Health Surveys. Source: ICF International, Demographic and Health Surveys. Percent of Young Women Married by Age 15 (numbers in white) and Age 18 (numbers in black) Percent of Demand for Family Planning Satisfied by Modern Contraceptive Methods Percent of Currently Married Women Who Have a Say in Decisions About This Topic 83 76 73 65 49 41 27 17 18 19 20121991– 1992 201419922011200020111993– 1994 20121992 PeruEgyptEthiopiaBangladeshNiger 47 28 47 29 19 16 7 2 3 3 Percent Who Agree That Husband Is Justified Beating Wife if She Leaves the House Without Informing Him Acceptance of Wife Beating Recedes Violence against women poses a serious challenge to women’s empowerment. Combating such violence often requires changing the attitudes and beliefs of both men and women. In fact, in some countries, substantial percentages of women actually agree that a husband has the right to beat a wife under certain circumstances. Many of these women believe a husband is justified in hitting a wife who goes out on her own without telling the husband. It is encouraging that these beliefs appear to be moderating in most countries. For example, in 2013, 13 percent of Nigerian men and 25 percent of Nigerian women viewed a wife leaving home without telling the husband as justification for wife beating, down from 19 percent and 32 percent, respectively, in 2008. Zambia also showed notable drops for both men and women between 2007 and 2013-2014. Globally, however, there is still a long path to achieve zero global tolerance of this harmful practice. MenWomen 20112006 Uganda 20132008 Nigeria 40 26 52 38 32 25 19 13 students. Data are from 14. der Parity Index gross enrollment ratio the tertiary gross en. An index less than n are more represented an women, while an index ates that women are ta are from UNESCO or Force e labor force participation e. The labor force efined as the proportion 15 years and older active, including those oyed. A ratio less than male labor force eater than the female ore than one indicates greater than the male e World Bank for 2013. nagricultural s in wage employment sector who are women. Financial Inclusion of Women Expands 22001 M 0 Kenya Egypt Philippines Pakistan Jordan Senegal Nigeria 2014201020062002199819941990 64 41 58 71 40 36 21 13 31 43 13 52 47 80 Family Planning Needs Increasingly Met by Modern Methods, but More Progress Needed “Demand for family planning satisfied with modern methods” has emerged as a key indicator of contraceptive availability and use. The indicator measures the proportion of women who want to delay or limit childbearing and who are using modern methods of contraception. Family planning experts have urged countries to strive for meeting at least 75 percent of demand with modern methods. Over the past two decades, a significant number of less developed countries have seen increases in the share of demand satisfied with modern methods, but many countries remain far below the proposed 75 percent benchmark. They will need to accelerate progress over the coming decade so that increased contraceptive use can translate into improved maternal and child health, slower population growth, increased economic well-being, and environmental sustainability. U.S. Gen Note: Data points are for each corresponding survey year. Source: ICF International, Demographic and Health Surveys. Source: ICF International, Demographic and Health Surveys. Source: ICF Intern Percent of Demand for Family Planning Satisfied by Modern Contraceptive Methods 20121991– 1992 201419922011200020111993– 1994 20121992 PeruEgyptEthiopiaBangladeshNiger 2 Percent Who Ag Accepta Violence against w the attitudes and husband has the r who goes out on For example, in 20 husband as justific drops for both me tolerance of this h Source: ICF Interna 5 4 EVELOPED OUNTRIES 82,235,000 132,213,000 362,226 252 44,769,000 122,654 85 87,444,000 239,573 166 5,278,000 14,459 10
- 7. © 2015 Population Reference Bureau 2015 WORLD POPULATION DATA SHEET 7 W O R L D P O P U L AT I O N H I G H L I G H T S FO CUS O N WO MEN ’S EMPOW ERMENT Large PurchasesOwn Health 2012– 2013 20062001 201120062001 2013– 2014 20072001– 2002 20122004– 2006 2000 201220072002 NepalMali Zambia Peru Jordan 0 10 20 30 40 50 60 70 80 90 100 17 20 18 15 18 32 27 47 53 66 57 37 42 65 74 66 75 83 74 84 88 91 71 77 89 64 79 72 56 17 Kenya Egypt Philippines Jordan 64 41 58 71 40 36 31 43 52 47 80 Rates of Early Marriage Fall, Particularly Among Those Under 15 Early marriage (before age 18) undermines the rights and livelihood opportunities of adolescent girls by leaving them vulnerable to the health risks of early pregnancy and childbearing, and prematurely ending their schooling. Rates of early marriage have declined broadly in the past 20 years, particularly among girls who are under age 15. Part of the overall decline reflects improvements in girls’ access to education: As girls educational attainment improves, the proportion marrying early tends to fall. Better employment opportunities for women and girls also can help delay marriages. In Bangladesh, expanded employment in the garment industry is linked to notably lower rates of marriage among rural migrants under age 15. The percentage of Bangladeshi girls married by age 18 has declined much more slowly as the youngest potential brides tend to postpone marriage by only a few years. The majority of Bangladeshi girls continue to marry before age 18. Women Post Uneven Gains in Household Decisionmaking Power Married women in many countries are increasingly likely to have a say in household decisions, but these gains do not necessarily apply to every type of decision. When women are included in decisions about household spending, more money tends to be spent for the benefit of women and children. And when women are able to make decisions about their health care, they are less vulnerable to preventable diseases. Progress in these areas has varied by country, and even in countries showing notable gains, many women still do not engage in all types of important decisions. For example, in Nepal, only 66 percent of women have a say about their own health care decisions. The same percentage of Zambian women have the opportunity to make decisions about large household purchases. Family Planning Needs Increasingly Met by Modern Methods, but More Progress Needed “Demand for family planning satisfied with modern methods” has emerged as a key indicator of contraceptive availability and use. The indicator measures the proportion of women who want to delay or limit childbearing and who are using modern methods of contraception. Family planning experts have urged countries to strive for meeting at least 75 percent of demand with modern methods. Over the past two decades, a significant number of less developed countries have seen increases in the share of demand satisfied with modern methods, but many countries remain far below the proposed 75 percent benchmark. They will need to accelerate progress over the coming decade so that increased contraceptive use can translate into improved maternal and child health, slower population growth, increased economic well-being, and environmental sustainability. Source: ICF International, Demographic and Health Surveys. Source: ICF International, Demographic and Health Surveys. Percent of Young Women Married by Age 15 (numbers in white) and Age 18 (numbers in black) Percent of Demand for Family Planning Satisfied by Modern Contraceptive Methods Percent of Currently Married Women Who Have a Say in Decisions About This Topic 83 76 73 65 49 41 27 17 18 19 20121991– 1992 201419922011200020111993– 1994 20121992 PeruEgyptEthiopiaBangladeshNiger 47 28 47 29 19 16 7 2 3 3 Percent Who Agree That Husband Is Justified Beating Wife if She Leaves the House Without Informing Him Acceptance of Wife Beating Recedes Violence against women poses a serious challenge to women’s empowerment. Combating such violence often requires changing the attitudes and beliefs of both men and women. In fact, in some countries, substantial percentages of women actually agree that a husband has the right to beat a wife under certain circumstances. Many of these women believe a husband is justified in hitting a wife who goes out on her own without telling the husband. It is encouraging that these beliefs appear to be moderating in most countries. For example, in 2013, 13 percent of Nigerian men and 25 percent of Nigerian women viewed a wife leaving home without telling the husband as justification for wife beating, down from 19 percent and 32 percent, respectively, in 2008. Zambia also showed notable drops for both men and women between 2007 and 2013-2014. Globally, however, there is still a long path to achieve zero global tolerance of this harmful practice. MenWomen 20112006 Uganda 20132008 Nigeria 40 26 52 38 32 25 19 13 2012– 2013 20062001 201120062001 2013– 2014 20072001– 2002 20122004– 2006 2000 201220072002 NepalMali Zambia Peru Jordan 0 2014 71 31 43 52 80 hods, use. The ontraception. r the past two methods, ming decade ed economic U.S. Gender Gap in College Completion Eases; Source: ICF International, Demographic and Health Surveys. 2012– Peru Percent Who Agree That Husband Is Justified Beating Wife if She Leaves the House Without Informing Him Acceptance of Wife Beating Recedes Violence against women poses a serious challenge to women’s empowerment. Combating such violence often requires changing the attitudes and beliefs of both men and women. In fact, in some countries, substantial percentages of women actually agree that a husband has the right to beat a wife under certain circumstances. Many of these women believe a husband is justified in hitting a wife who goes out on her own without telling the husband. It is encouraging that these beliefs appear to be moderating in most countries. For example, in 2013, 13 percent of Nigerian men and 25 percent of Nigerian women viewed a wife leaving home without telling the husband as justification for wife beating, down from 19 percent and 32 percent, respectively, in 2008. Zambia also showed notable drops for both men and women between 2007 and 2013-2014. Globally, however, there is still a long path to achieve zero global tolerance of this harmful practice. Source: ICF International, Demographic and Health Surveys. MenWomen 20112006 Uganda 20132008 Nigeria Zambia 20122007 Indonesia 40 26 52 38 32 25 19 13 11 12 24 24 2013- 2014 30 16 2007 42 32
- 8. © 2015 Population Reference Bureau 2015 WORLD POPULATION DATA SHEET 8 W O R L D P O P U L AT I O N H I G H L I G H T S FO CUS O N WO MEN ’S EMPOW ERMENT Large PurchasesOwn Health 2012– 2013 20062001 201120062001 2013– 2014 20072001– 2002 20122004– 2006 2000 201220072002 NepalMali Zambia Peru Jordan 0 10 20 30 40 50 60 70 80 90 100 17 20 18 15 18 32 27 47 53 66 57 37 42 65 74 66 75 83 74 84 88 91 71 77 89 64 79 72 56 17 Kenya Egypt Philippines Jordan 64 41 58 71 40 36 31 43 52 47 80 Rates of Early Marriage Fall, Particularly Among Those Under 15 Early marriage (before age 18) undermines the rights and livelihood opportunities of adolescent girls by leaving them vulnerable to the health risks of early pregnancy and childbearing, and prematurely ending their schooling. Rates of early marriage have declined broadly in the past 20 years, particularly among girls who are under age 15. Part of the overall decline reflects improvements in girls’ access to education: As girls educational attainment improves, the proportion marrying early tends to fall. Better employment opportunities for women and girls also can help delay marriages. In Bangladesh, expanded employment in the garment industry is linked to notably lower rates of marriage among rural migrants under age 15. The percentage of Bangladeshi girls married by age 18 has declined much more slowly as the youngest potential brides tend to postpone marriage by only a few years. The majority of Bangladeshi girls continue to marry before age 18. Women Post Uneven Gains in Household Decisionmaking Power Married women in many countries are increasingly likely to have a say in household decisions, but these gains do not necessarily apply to every type of decision. When women are included in decisions about household spending, more money tends to be spent for the benefit of women and children. And when women are able to make decisions about their health care, they are less vulnerable to preventable diseases. Progress in these areas has varied by country, and even in countries showing notable gains, many women still do not engage in all types of important decisions. For example, in Nepal, only 66 percent of women have a say about their own health care decisions. The same percentage of Zambian women have the opportunity to make decisions about large household purchases. Family Planning Needs Increasingly Met by Modern Methods, but More Progress Needed “Demand for family planning satisfied with modern methods” has emerged as a key indicator of contraceptive availability and use. The indicator measures the proportion of women who want to delay or limit childbearing and who are using modern methods of contraception. Family planning experts have urged countries to strive for meeting at least 75 percent of demand with modern methods. Over the past two decades, a significant number of less developed countries have seen increases in the share of demand satisfied with modern methods, but many countries remain far below the proposed 75 percent benchmark. They will need to accelerate progress over the coming decade so that increased contraceptive use can translate into improved maternal and child health, slower population growth, increased economic well-being, and environmental sustainability. Source: ICF International, Demographic and Health Surveys. Source: ICF International, Demographic and Health Surveys. Percent of Young Women Married by Age 15 (numbers in white) and Age 18 (numbers in black) Percent of Demand for Family Planning Satisfied by Modern Contraceptive Methods Percent of Currently Married Women Who Have a Say in Decisions About This Topic 83 76 73 65 49 41 27 17 18 19 20121991– 1992 201419922011200020111993– 1994 20121992 PeruEgyptEthiopiaBangladeshNiger 47 28 47 29 19 16 7 2 3 3 Percent Who Agree That Husband Is Justified Beating Wife if She Leaves the House Without Informing Him Acceptance of Wife Beating Recedes Violence against women poses a serious challenge to women’s empowerment. Combating such violence often requires changing the attitudes and beliefs of both men and women. In fact, in some countries, substantial percentages of women actually agree that a husband has the right to beat a wife under certain circumstances. Many of these women believe a husband is justified in hitting a wife who goes out on her own without telling the husband. It is encouraging that these beliefs appear to be moderating in most countries. For example, in 2013, 13 percent of Nigerian men and 25 percent of Nigerian women viewed a wife leaving home without telling the husband as justification for wife beating, down from 19 percent and 32 percent, respectively, in 2008. Zambia also showed notable drops for both men and women between 2007 and 2013-2014. Globally, however, there is still a long path to achieve zero global tolerance of this harmful practice. MenWomen 20112006 Uganda 20132008 Nigeria 40 26 52 38 32 25 19 13 15 years and older active, including those oyed. A ratio less than male labor force eater than the female ore than one indicates greater than the male e World Bank for 2013. agricultural s in wage employment sector who are women. ountries the definition the following: the pulation in nonagriculture, l employment in aid employment, and blic sector. Data are 8-2013. iament Members ts in a country’s single gher and lower chambers ent, or other national men. Data are from the ion from May 1, 2015. Population Data Sheet sh, French, and b.org. Also online: ata Dashboard where multiple indicators for ries. on what the data ate of women’s orld map illustrating c variables by country cations (discounts rders): rb.org. @prb.org. 0-877-9881. 937. necticut Ave., NW, hington, DC 20009. RB demographers d Kristin Bietsch. ce Bureau. ISSN 0085-8315 : © Jörg Dickmann, Men Women 11 15 4 4 Men Women 9 13 3 5 Men Women 34 44 25 36 Men Women 42 62 26 44 Men Women 52 54 39 44 Men Women Cambodia Congo, Dem. Rep. Colombia India Ukraine Canada 99 99 97 94 Numbers in white show percent in 2011 Numbers in black show percent in 2014 Financial Inclusion of Women Expands Financial inclusion—making appropriate, affordable, and convenient financial services available to all people—is a global development priority. For women, access to savings, credit, and other services can help them gain more financial independence, better manage and leverage their resources, and build capital to support income-generating activities. A core measure of financial inclusion is whether an individual uses an account at a bank or other formal financial institution. In most countries, even many least developed ones, the share of women with such accounts has increased over the past few years. Gaps remain between men and women, but these have narrowed in many cases, and most developed countries show effective gender parity at high levels of usage. Rapid expansion of mobile money and other financial services available via mobile devices, particularly in Africa, provide a convenient way for both men and women to access such services. Women are currently using mobile more than other formal accounts in several African countries (see table). Source: World Bank, Global Findex Database. 2014201020062002199819941990 0 5 10 15 20 25 30 35 40 19741970 Wom Men U.S. Gen Earnings Educational attain ages 25 and older college degree qu actually started ou ages 25 and older earnings gap pers degrees in higher- only 26 percent of year-round worker Note: Data points are for each corresponding survey year. Source: ICF International, Demographic and Health Surveys. Source: U.S. Censu Survey; American Co Percent Who Ha Percent Who Have Used an Account at a Formal Financial Institution in the Past 12 Months, 2011 and 2014 Percent of Women Using Financial Services by Type, 2014 Mobile Financial Services Other Formal Financial Institution Côte d'Ivoire 20 12 Uganda 29 23 Tanzania 26 17 Zimbabwe 19 15 Source: ICF Interna
- 9. © 2015 Population Reference Bureau 2015 WORLD POPULATION DATA SHEET 9 W O R L D P O P U L AT I O N H I G H L I G H T S FO CUS O N WO MEN ’S EMPOW ERMENT Large PurchasesOwn Health 2012– 2013 20062001 201120062001 2013– 2014 20072001– 2002 20122004– 2006 2000 201220072002 NepalMali Zambia Peru Jordan 0 10 20 30 40 50 60 70 80 90 100 17 20 18 15 18 32 27 47 53 66 57 37 42 65 74 66 75 83 74 84 88 91 71 77 89 64 79 72 56 17 Kenya Egypt Philippines Jordan 64 41 58 71 40 36 31 43 52 47 80 Rates of Early Marriage Fall, Particularly Among Those Under 15 Early marriage (before age 18) undermines the rights and livelihood opportunities of adolescent girls by leaving them vulnerable to the health risks of early pregnancy and childbearing, and prematurely ending their schooling. Rates of early marriage have declined broadly in the past 20 years, particularly among girls who are under age 15. Part of the overall decline reflects improvements in girls’ access to education: As girls educational attainment improves, the proportion marrying early tends to fall. Better employment opportunities for women and girls also can help delay marriages. In Bangladesh, expanded employment in the garment industry is linked to notably lower rates of marriage among rural migrants under age 15. The percentage of Bangladeshi girls married by age 18 has declined much more slowly as the youngest potential brides tend to postpone marriage by only a few years. The majority of Bangladeshi girls continue to marry before age 18. Women Post Uneven Gains in Household Decisionmaking Power Married women in many countries are increasingly likely to have a say in household decisions, but these gains do not necessarily apply to every type of decision. When women are included in decisions about household spending, more money tends to be spent for the benefit of women and children. And when women are able to make decisions about their health care, they are less vulnerable to preventable diseases. Progress in these areas has varied by country, and even in countries showing notable gains, many women still do not engage in all types of important decisions. For example, in Nepal, only 66 percent of women have a say about their own health care decisions. The same percentage of Zambian women have the opportunity to make decisions about large household purchases. Family Planning Needs Increasingly Met by Modern Methods, but More Progress Needed “Demand for family planning satisfied with modern methods” has emerged as a key indicator of contraceptive availability and use. The indicator measures the proportion of women who want to delay or limit childbearing and who are using modern methods of contraception. Family planning experts have urged countries to strive for meeting at least 75 percent of demand with modern methods. Over the past two decades, a significant number of less developed countries have seen increases in the share of demand satisfied with modern methods, but many countries remain far below the proposed 75 percent benchmark. They will need to accelerate progress over the coming decade so that increased contraceptive use can translate into improved maternal and child health, slower population growth, increased economic well-being, and environmental sustainability. Source: ICF International, Demographic and Health Surveys. Source: ICF International, Demographic and Health Surveys. Percent of Young Women Married by Age 15 (numbers in white) and Age 18 (numbers in black) Percent of Demand for Family Planning Satisfied by Modern Contraceptive Methods Percent of Currently Married Women Who Have a Say in Decisions About This Topic 83 76 73 65 49 41 27 17 18 19 20121991– 1992 201419922011200020111993– 1994 20121992 PeruEgyptEthiopiaBangladeshNiger 47 28 47 29 19 16 7 2 3 3 Percent Who Agree That Husband Is Justified Beating Wife if She Leaves the House Without Informing Him Acceptance of Wife Beating Recedes Violence against women poses a serious challenge to women’s empowerment. Combating such violence often requires changing the attitudes and beliefs of both men and women. In fact, in some countries, substantial percentages of women actually agree that a husband has the right to beat a wife under certain circumstances. Many of these women believe a husband is justified in hitting a wife who goes out on her own without telling the husband. It is encouraging that these beliefs appear to be moderating in most countries. For example, in 2013, 13 percent of Nigerian men and 25 percent of Nigerian women viewed a wife leaving home without telling the husband as justification for wife beating, down from 19 percent and 32 percent, respectively, in 2008. Zambia also showed notable drops for both men and women between 2007 and 2013-2014. Globally, however, there is still a long path to achieve zero global tolerance of this harmful practice. MenWomen 20112006 Uganda 20132008 Nigeria 40 26 52 38 32 25 19 13 99 99 97 94 elopment priority. nd leverage their dual uses an en with such cases, and most al services available n are currently using 2014 0 5 10 15 20 25 30 35 40 201420102006200219981994199019861982197819741970 Women 25-29 Men 25-29 Women 25+ Men 25+ U.S. Gender Gap in College Completion Eases; Earnings Gap Persists Educational attainment in the United States has risen substantially over the last four decades. Between 1970 and 2014, the share of men ages 25 and older with at least a college degree climbed from 14 percent to 32 percent, while the share of adult women with at least a college degree quadrupled from 8 percent to 32 percent. For ages 25 to 29 only, the share of women with a bachelor’s degree or higher actually started outpacing the share for men in 1991. But women still lag behind men in earnings. Among full-time, year-round workers ages 25 and older in 2013, women’s median earnings were about 79 percent of men’s, up from 71 percent in 1993 (see table). This gender earnings gap persists across all educational levels. For bachelor’s degree holders, one factor may be that women are less likely to get degrees in higher-earning fields such as science and engineering. In 2013, among adults ages 25 and older with a bachelor’s degree, only 26 percent of women had a degree in science and engineering, compared with 44 percent of men. However, even among full-time, year-round workers with engineering degrees, women’s median earnings in 2011 were only 83 percent of men’s. Source: U.S. Census Bureau: 1970 to 2002 March Current Population Survey; 2003 to 2014 Annual Social and Economic Supplement to the Current Population Survey; American Community Survey Brief 11-10 (Oct. 2012); and PRB analysis of data from the 2013 American Community Survey. Percent Who Have Completed College, by Age nancial Other Formal Financial Institution 12 23 17 15 Female-to-Male Median Earnings Ratio Among Full-Time Year-Round Workers Ages 25 and Older by Education 1993 2013 High School 71 76 Some College, No Degree 70 74 Bachelor’s Degree 73 75 Bachelor’s Degree or More 70 73 All Levels 71 79 Note: Ratios are expressed as a percent. Source: ICF International, Demographic and Health Surveys. Zambia 20122007 Indonesia 2013- 2014 2007
- 10. © 2015 Population Reference Bureau 2015 WORLD POPULATION DATA SHEET 10 W O R L D P O P U L AT I O N H I G H L I G H T S FO CUS O N WO MEN ’S EMPOW ERMENT Large PurchasesOwn Health 2012– 2013 20062001 201120062001 2013– 2014 20072001– 2002 20122004– 2006 2000 201220072002 NepalMali Zambia Peru Jordan 0 10 20 30 40 50 60 70 80 90 100 17 20 18 15 18 32 27 47 53 66 57 37 42 65 74 66 75 83 74 84 88 91 71 77 89 64 79 72 56 17 Kenya Egypt Philippines Jordan 64 41 58 71 40 36 31 43 52 47 80 Rates of Early Marriage Fall, Particularly Among Those Under 15 Early marriage (before age 18) undermines the rights and livelihood opportunities of adolescent girls by leaving them vulnerable to the health risks of early pregnancy and childbearing, and prematurely ending their schooling. Rates of early marriage have declined broadly in the past 20 years, particularly among girls who are under age 15. Part of the overall decline reflects improvements in girls’ access to education: As girls educational attainment improves, the proportion marrying early tends to fall. Better employment opportunities for women and girls also can help delay marriages. In Bangladesh, expanded employment in the garment industry is linked to notably lower rates of marriage among rural migrants under age 15. The percentage of Bangladeshi girls married by age 18 has declined much more slowly as the youngest potential brides tend to postpone marriage by only a few years. The majority of Bangladeshi girls continue to marry before age 18. Women Post Uneven Gains in Household Decisionmaking Power Married women in many countries are increasingly likely to have a say in household decisions, but these gains do not necessarily apply to every type of decision. When women are included in decisions about household spending, more money tends to be spent for the benefit of women and children. And when women are able to make decisions about their health care, they are less vulnerable to preventable diseases. Progress in these areas has varied by country, and even in countries showing notable gains, many women still do not engage in all types of important decisions. For example, in Nepal, only 66 percent of women have a say about their own health care decisions. The same percentage of Zambian women have the opportunity to make decisions about large household purchases. Family Planning Needs Increasingly Met by Modern Methods, but More Progress Needed “Demand for family planning satisfied with modern methods” has emerged as a key indicator of contraceptive availability and use. The indicator measures the proportion of women who want to delay or limit childbearing and who are using modern methods of contraception. Family planning experts have urged countries to strive for meeting at least 75 percent of demand with modern methods. Over the past two decades, a significant number of less developed countries have seen increases in the share of demand satisfied with modern methods, but many countries remain far below the proposed 75 percent benchmark. They will need to accelerate progress over the coming decade so that increased contraceptive use can translate into improved maternal and child health, slower population growth, increased economic well-being, and environmental sustainability. Source: ICF International, Demographic and Health Surveys. Source: ICF International, Demographic and Health Surveys. Percent of Young Women Married by Age 15 (numbers in white) and Age 18 (numbers in black) Percent of Demand for Family Planning Satisfied by Modern Contraceptive Methods Percent of Currently Married Women Who Have a Say in Decisions About This Topic 83 76 73 65 49 41 27 17 18 19 20121991– 1992 201419922011200020111993– 1994 20121992 PeruEgyptEthiopiaBangladeshNiger 47 28 47 29 19 16 7 2 3 3 Percent Who Agree That Husband Is Justified Beating Wife if She Leaves the House Without Informing Him Acceptance of Wife Beating Recedes Violence against women poses a serious challenge to women’s empowerment. Combating such violence often requires changing the attitudes and beliefs of both men and women. In fact, in some countries, substantial percentages of women actually agree that a husband has the right to beat a wife under certain circumstances. Many of these women believe a husband is justified in hitting a wife who goes out on her own without telling the husband. It is encouraging that these beliefs appear to be moderating in most countries. For example, in 2013, 13 percent of Nigerian men and 25 percent of Nigerian women viewed a wife leaving home without telling the husband as justification for wife beating, down from 19 percent and 32 percent, respectively, in 2008. Zambia also showed notable drops for both men and women between 2007 and 2013-2014. Globally, however, there is still a long path to achieve zero global tolerance of this harmful practice. MenWomen 20112006 Uganda 20132008 Nigeria 40 26 52 38 32 25 19 13 12Infant mortality rate per 1,000 live births in Kosovo, the highest rate in Europe. 3,339Population per square kilometer of arable land in South Korea. 9.8BILLION Projected 2050 world population, up 2.5 billion from 2015. 52%The percentage of married women ages 15-49 in Peru who use modern contraception. 15.5%The percentage of women in Swaziland ages 15-24 infected with HIV/AIDS, vs. 7.2% for men in same age group. 58%The percentage of Rwanda’s parliament members who are women—the world’s highest percentage. 28The number of maternal mortality deaths per 100,000 live births in the United States, up from 12 in 1990. 4.4The total fertility rate (lifetime births per woman) in Yemen.
- 11. © 2015 Population Reference Bureau See notes on page 21 2015 WORLD POPULATION DATA SHEET 11 Population mid-2015 (millions) Births per 1,000 Population Deaths per 1,000 Population Net Migration Rate per 1,000 Population Infant Mortality Ratea Total Fertility Rateb Percent of Population GNI per Capita ($US) 2014c Percent Urban Population per Square Kilometer of Arable Land Percent of Married Women 15-49 Using Contraceptiond Life Expectancy at Birth (years) mid-2030 (millions) mid-2050 (millions) Age 15 Age 65+ All Methods Modern Methods Both Sexes Males Fe WORLD 7,336 20 8 — 8,505 9,804 37 2.5 26 8 15,030 53 523 62 56 71 69 MORE DEVELOPED 1,254 11 10 2 1,295 1,310 5 1.7 16 17 39,020 77 238 67 59 79 76 LESS DEVELOPED 6,082 22 7 -1 7,210 8,495 40 2.6 28 6 9,870 48 696 61 55 69 68 LESS DEVELOPED (Excl. China) 4,702 24 7 -0 5,779 7,120 44 3.0 32 5 8,740 46 612 54 46 68 66 LEAST DEVELOPED 938 34 9 -1 1,300 1,887 62 4.3 40 4 2,270 29 521 37 32 62 60 AFRICA 1,171 36 10 -0 1,658 2,473 59 4.7 41 4 4,720 40 487 35 29 60 58 SUB-SAHARAN AFRICA 949 38 11 -0 1,369 2,081 64 5.0 43 3 3,480 38 484 30 25 57 56 NORTHERN AFRICA 222 29 6 -1 289 392 29 3.4 31 5 9,740 51 500 51 46 71 69 Algeria 39.9 26 6 -1 49.9 60.4 21 3.0 28 6 13,540 73 524 56 48 74 72 Egypt 89.1 31 6 0 117.9 162.4 22 3.5 31 4 11,020 43 3,196 59 57 71 70 Libya 6.3 21 4 -11 7.5 8.4 14 2.4 29 5 16,190 78 359 42 20 71 69 Morocco 34.1 22 6 -2 38.7 41.9 26 2.5 25 6 7,180 60 425 67 57 74 73 Sudan 40.9 38 9 -2 61.7 105.0 52 5.2 43 3 3,980 33 193 12 12 62 60 Tunisia 11.0 19 6 -1 12.3 12.9 16 2.1 23 8 10,600 68 388 63 50 76 74 Western Saharae 0.6 20 6 9 0.8 0.8 37 2.4 26 3 — 82 — — — 68 66 WESTERN AFRICA 349 39 12 -1 509 784 64 5.4 43 3 4,040 45 402 16 12 55 54 Benin 10.6 37 10 0 15.1 21.5 67 4.9 45 3 1,850 45 393 18 13 59 58 Burkina Faso 18.5 44 11 -1 28.4 46.6 69 6.0 45 2 1,660 27 308 18 18 56 56 Cape Verde 0.5 21 6 -2 0.6 0.7 22 2.4 31 6 6,320 62 1,090 61 57 75 71 Côte d’Ivoire 23.3 37 14 0 32.0 46.3 74 4.9 41 3 3,350 50 805 18 13 51 50 Gambia 2.0 42 10 -1 3.1 5.0 47 5.6 46 2 1,580 57 459 9 8 59 58 Ghana 27.7 33 8 -2 37.7 52.6 41 4.2 39 5 3,960 51 588 27 22 61 60 Guinea 11.0 38 12 0 16.0 24.2 67 5.1 42 3 1,140 36 366 6 5 60 58 Guinea-Bissau 1.8 37 13 -1 2.5 3.5 92 4.9 43 3 1,430 49 594 16 14 54 53 Liberia 4.5 36 9 -1 6.4 9.4 54 4.7 42 3 820 47 899 20 19 60 59 Mali 16.7 44 15 -4 26.1 43.6 56 5.9 47 3 1,660 39 245 10 10 53 53 Mauritania 3.6 34 9 -1 5.0 7.1 72 4.2 40 3 3,700 59 883 11 10 63 62 Niger 18.9 50 11 0 33.8 68.0 60 7.6 52 4 950 22 118 14 12 60 59 Nigeria 181.8 39 14 -0 261.7 396.5 69 5.5 43 3 5,680 50 520 15 10 52 52 Senegal 14.7 37 8 -1 21.5 32.3 33 5.0 42 4 2,290 45 439 22 20 65 63 Sierra Leone 6.5 37 14 -1 8.3 10.6 92 4.9 41 3 1,830 41 375 17 16 50 50 Togo 7.2 38 11 0 10.5 16.3 49 4.8 42 3 1,310 38 273 20 17 57 56 EASTERN AFRICA 388 36 9 -0 562 841 52 4.8 43 3 1,930 24 560 41 35 61 59 Burundi 10.7 43 10 0 17.2 30.4 65 6.2 46 3 790 10 977 22 18 59 57 Comoros 0.8 33 9 -3 1.0 1.3 36 4.3 41 3 1,530 28 868 19 14 61 60 Djibouti 0.9 27 9 -3 1.1 1.2 58 3.4 34 4 — 77 38,827 19 18 62 60 Eritrea 5.2 37 7 -5 7.3 10.4 46 4.4 43 2 1,180 21 981 8 7 63 60 Ethiopia 98.1 31 8 0 130.5 165.1 49 4.1 41 4 1,500 17 641 42 40 64 62 Kenya 44.3 31 8 0 60.1 81.4 39 3.9 41 3 2,890 24 794 58 53 62 60 Madagascar 23.0 34 7 0 34.3 52.8 38 4.4 41 3 1,400 33 660 40 33 65 64 Malawi 17.2 37 11 0 24.7 36.6 53 5.0 44 3 780 16 458 59 57 61 60 Mauritius 1.3 11 8 -1 1.3 1.2 14.5 1.4 20 9 18,290 41 1,663 76 39 74 71 Mayotte 0.2 31 2 -5 0.3 0.5 4 4.1 44 3 — 50 — — — 79 76 Mozambique 25.7 45 13 0 41.0 72.9 83 5.9 45 3 1,170 31 455 12 11 54 52 Reunion 0.9 17 5 -3 1.0 1.2 8 2.4 24 10 — 94 — 67 64 80 77 Rwanda 11.3 31 8 -1 15.8 21.0 32 4.2 41 3 1,530 28 959 53 48 65 63 Seychelles 0.09 17 8 6 0.1 0.1 12.7 2.4 22 8 24,630 54 9,173 — — 73 69 Somalia 11.1 44 12 -7 16.9 27.1 79 6.6 47 3 — 38 985 15 1 55 53 South Sudan 12.2 36 12 11 17.3 24.8 77 6.9 42 3 2,030 17 — 4 1 55 54 Tanzania 52.3 39 9 -1 79.4 129.4 37 5.2 45 3 2,530 30 360 34 26 62 60 Uganda 40.1 40 9 -1 63.4 104.1 54 5.9 48 2 1,690 18 582 27 26 59 58 Zambia 15.5 43 13 0 23.7 42.0 75 5.6 46 3 3,860 40 408 49 45 53 51 POPULATION, HEALTH, AND ENVIRONMENT DATA AND ESTIMATES FOR THE COUNTRIES AND REGIONS OF THE WORLD
- 12. © 2015 Population Reference Bureau See notes on page 21 2015 WORLD POPULATION DATA SHEET 12 Ethiopia 98.1 31 8 0 130.5 165.1 49 4.1 41 4 1,500 17 641 42 40 64 62 Kenya 44.3 31 8 0 60.1 81.4 39 3.9 41 3 2,890 24 794 58 53 62 60 Madagascar 23.0 34 7 0 34.3 52.8 38 4.4 41 3 1,400 33 660 40 33 65 64 Malawi 17.2 37 11 0 24.7 36.6 53 5.0 44 3 780 16 458 59 57 61 60 Mauritius 1.3 11 8 -1 1.3 1.2 14.5 1.4 20 9 18,290 41 1,663 76 39 74 71 Mayotte 0.2 31 2 -5 0.3 0.5 4 4.1 44 3 — 50 — — — 79 76 Mozambique 25.7 45 13 0 41.0 72.9 83 5.9 45 3 1,170 31 455 12 11 54 52 Reunion 0.9 17 5 -3 1.0 1.2 8 2.4 24 10 — 94 — 67 64 80 77 Rwanda 11.3 31 8 -1 15.8 21.0 32 4.2 41 3 1,530 28 959 53 48 65 63 Seychelles 0.09 17 8 6 0.1 0.1 12.7 2.4 22 8 24,630 54 9,173 — — 73 69 Somalia 11.1 44 12 -7 16.9 27.1 79 6.6 47 3 — 38 985 15 1 55 53 South Sudan 12.2 36 12 11 17.3 24.8 77 6.9 42 3 2,030 17 — 4 1 55 54 Tanzania 52.3 39 9 -1 79.4 129.4 37 5.2 45 3 2,530 30 360 34 26 62 60 Uganda 40.1 40 9 -1 63.4 104.1 54 5.9 48 2 1,690 18 582 27 26 59 58 Zambia 15.5 43 13 0 23.7 42.0 75 5.6 46 3 3,860 40 408 49 45 53 51 Zimbabwe 17.4 33 9 -3 25.2 37.5 55 4.3 43 3 1,710 33 436 67 67 61 60 MIDDLE AFRICA 149 44 14 -0 229 378 96 6.1 46 3 2,680 46 569 20 10 52 50 Angola 25.0 46 14 1 39.4 65.5 95 6.1 47 2 7,150 62 421 18 12 52 50 Cameroon 23.7 37 11 -0 34.4 51.9 57 4.9 43 3 2,940 52 383 23 14 57 56 Central African Republic 5.6 45 16 0 8.5 13.9 109 6.2 45 3 610 39 307 15 9 50 48 Chad 13.7 48 14 1 21.8 37.4 95 6.5 48 2 2,130 22 279 5 2 51 50 Congo 4.8 37 10 -8 6.7 10.2 61 4.8 41 3 5,120 64 870 45 20 58 57 Congo, Dem. Rep. 73.3 46 16 -0 114.9 193.6 108 6.6 46 3 700 42 1,044 20 8 50 48 Equatorial Guinea 0.8 37 13 5 1.2 1.8 70 5.1 39 3 22,480 39 667 13 10 57 56 Gabon 1.8 32 9 1 2.4 3.3 43 4.1 38 5 16,500 86 523 31 19 63 62 Sao Tome and Principe 0.2 36 7 -6 0.3 0.4 43 4.3 42 4 3,030 67 2,239 38 33 66 64 SOUTHERN AFRICA 63 23 10 3 69 77 36 2.7 31 5 12,290 59 464 60 59 61 59 Botswana 2.1 26 8 2 2.3 2.5 31 2.9 33 5 17,460 57 755 53 51 64 62 Lesotho 1.9 31 20 -5 2.3 3.0 59 3.3 36 5 3,260 27 682 60 60 44 43 Namibia 2.5 29 7 0 3.3 4.7 39 3.6 35 4 9,880 46 301 56 55 64 62 South Africa 55.0 22 10 3 59.8 65.2 34 2.6 30 6 12,700 62 458 60 60 61 59 Swaziland 1.3 30 14 -1 1.5 1.8 50 3.3 37 4 5,940 21 733 66 66 49 50 AMERICAS 987 16 7 1 1,116 1,221 14 2.0 24 10 29,900 80 266 73 68 76 74 NORTHERN AMERICA 357 12 8 3 401 445 6 1.8 19 15 54,620 81 178 74 68 79 77 Canada 35.8 11 7 6 41.0 46.9 4.8 1.6 16 16 43,400 80 79 74 72 81 79 United States 321.2 13 8 3 359.4 398.3 6.0 1.9 19 15 55,860 81 207 74 68 79 76 LATIN AMERICA AND THE CARIBBEAN 630 18 6 -1 716 776 17 2.1 27 7 15,260 80 371 73 67 75 72 CENTRAL AMERICA 173 20 5 -2 205 231 14 2.4 29 6 14,420 74 585 71 65 75 72 Belize 0.4 21 4 4 0.5 0.5 13 2.4 36 4 7,870 44 475 55 52 74 71 Costa Rica 4.8 15 4 2 5.6 6.1 8.1 1.9 23 7 13,900 73 1,972 76 75 79 77 El Salvador 6.4 18 5 -8 6.8 6.8 17 2.0 31 7 7,720 67 904 72 68 73 68 Guatemala 16.2 25 5 -1 21.4 27.5 19 3.1 40 5 7,260 52 1,056 54 44 73 69 Honduras 8.3 24 5 -2 10.2 11.7 22 2.7 34 5 4,120 54 819 73 64 74 72 Mexico 127.0 19 5 -2 148.1 163.8 13 2.3 28 7 16,710 79 526 73 66 75 73 Nicaragua 6.3 23 5 -4 7.4 8.4 16 2.4 32 5 4,670 59 416 80 77 75 72 Panama 4.0 19 5 2 4.9 5.8 17 2.7 28 8 19,630 78 744 63 60 78 75 CARIBBEAN 43 18 8 -4 47 50 28 2.3 26 9 12,800 68 793 62 59 73 70 Antigua and Barbuda 0.09 14 6 0 0.1 0.1 16 1.5 24 8 21,120 30 2,248 — — 77 74 Bahamas 0.4 15 6 1 0.4 0.5 14 1.9 26 7 22,310 85 4,708 — — 74 71 Barbados 0.3 12 9 2 0.3 0.3 19 1.7 20 13 14,750 46 2,525 59 55 75 73 Cuba 11.1 11 8 -2 11.2 10.6 4.2 1.7 17 13 18,710 75 348 74 72 78 77 Curaçao 0.2 13 8 1 0.2 0.2 8.7 2.1 19 15 — — — — — 78 75 Dominica 0.07 14 9 -5 0.07 0.06 20 2.1 22 10 10,300 68 1,133 — — 75 72 Dominican Republic 10.5 21 6 -3 11.3 12.2 31 2.5 31 6 12,450 72 1,310 70 68 73 70 Grenada 0.1 17 8 -2 0.1 0.1 15 2.1 26 7 11,650 41 3,710 — — 76 74 Guadeloupe 0.4 13 7 -2 0.4 0.4 8.7 2.2 21 14 — 98 — — — 81 78 Haiti 10.9 28 9 -3 13.6 16.9 42 3.2 35 4 1,750 59 1,092 35 31 64 61 Jamaica 2.7 18 7 -5 2.9 2.7 21 2.3 24 9 8,490 52 2,268 73 68 74 70 Martinique 0.4 11 8 -10 0.4 0.4 8 1.9 19 17 — 89 — — — 82 79 Puerto Rico 3.5 10 8 -15 3.5 3.4 7.2 1.5 18 17 23,960 99 5,806 84 72 79 76 St. Kitts-Nevis 0.05 14 8 1 0.05 0.06 13 1.8 21 8 21,990 32 921 — — 75 73 St. Lucia 0.2 12 6 0 0.2 0.2 18 1.5 22 9 10,230 15 5,855 56 52 79 75 POPULATION, HEALTH, AND ENVIRONMENT DATA AND ESTIMATES FOR THE COUNTRIES AND REGIONS OF THE WORLD Population mid-2015 (millions) Births per 1,000 Population Deaths per 1,000 Population Net Migration Rate per 1,000 Population Infant Mortality Ratea Total Fertility Rateb Percent of Population GNI per Capita ($US) 2014c Percent Urban Population per Square Kilometer of Arable Land Percent of Married Women 15-49 Using Contraceptiond Life Expectancy at Birth (years) mid-2030 (millions) mid-2050 (millions) Age 15 Age 65+ All Methods Modern Methods Both Sexes Males Fe WORLD 7,336 20 8 — 8,505 9,804 37 2.5 26 8 15,030 53 523 62 56 71 69 MORE DEVELOPED 1,254 11 10 2 1,295 1,310 5 1.7 16 17 39,020 77 238 67 59 79 76 LESS DEVELOPED 6,082 22 7 -1 7,210 8,495 40 2.6 28 6 9,870 48 696 61 55 69 68 LESS DEVELOPED (Excl. China) 4,702 24 7 -0 5,779 7,120 44 3.0 32 5 8,740 46 612 54 46 68 66 LEAST DEVELOPED 938 34 9 -1 1,300 1,887 62 4.3 40 4 2,270 29 521 37 32 62 60 AFRICA 1,171 36 10 -0 1,658 2,473 59 4.7 41 4 4,720 40 487 35 29 60 58 SUB-SAHARAN AFRICA 949 38 11 -0 1,369 2,081 64 5.0 43 3 3,480 38 484 30 25 57 56 NORTHERN AFRICA 222 29 6 -1 289 392 29 3.4 31 5 9,740 51 500 51 46 71 69 Algeria 39.9 26 6 -1 49.9 60.4 21 3.0 28 6 13,540 73 524 56 48 74 72 Egypt 89.1 31 6 0 117.9 162.4 22 3.5 31 4 11,020 43 3,196 59 57 71 70 Libya 6.3 21 4 -11 7.5 8.4 14 2.4 29 5 16,190 78 359 42 20 71 69 Morocco 34.1 22 6 -2 38.7 41.9 26 2.5 25 6 7,180 60 425 67 57 74 73 Sudan 40.9 38 9 -2 61.7 105.0 52 5.2 43 3 3,980 33 193 12 12 62 60 Tunisia 11.0 19 6 -1 12.3 12.9 16 2.1 23 8 10,600 68 388 63 50 76 74 Western Saharae 0.6 20 6 9 0.8 0.8 37 2.4 26 3 — 82 — — — 68 66 WESTERN AFRICA 349 39 12 -1 509 784 64 5.4 43 3 4,040 45 402 16 12 55 54 Benin 10.6 37 10 0 15.1 21.5 67 4.9 45 3 1,850 45 393 18 13 59 58 Burkina Faso 18.5 44 11 -1 28.4 46.6 69 6.0 45 2 1,660 27 308 18 18 56 56 Cape Verde 0.5 21 6 -2 0.6 0.7 22 2.4 31 6 6,320 62 1,090 61 57 75 71 Côte d’Ivoire 23.3 37 14 0 32.0 46.3 74 4.9 41 3 3,350 50 805 18 13 51 50 Gambia 2.0 42 10 -1 3.1 5.0 47 5.6 46 2 1,580 57 459 9 8 59 58 Ghana 27.7 33 8 -2 37.7 52.6 41 4.2 39 5 3,960 51 588 27 22 61 60 Guinea 11.0 38 12 0 16.0 24.2 67 5.1 42 3 1,140 36 366 6 5 60 58 Guinea-Bissau 1.8 37 13 -1 2.5 3.5 92 4.9 43 3 1,430 49 594 16 14 54 53 Liberia 4.5 36 9 -1 6.4 9.4 54 4.7 42 3 820 47 899 20 19 60 59 Mali 16.7 44 15 -4 26.1 43.6 56 5.9 47 3 1,660 39 245 10 10 53 53 Mauritania 3.6 34 9 -1 5.0 7.1 72 4.2 40 3 3,700 59 883 11 10 63 62 Niger 18.9 50 11 0 33.8 68.0 60 7.6 52 4 950 22 118 14 12 60 59 Nigeria 181.8 39 14 -0 261.7 396.5 69 5.5 43 3 5,680 50 520 15 10 52 52 Senegal 14.7 37 8 -1 21.5 32.3 33 5.0 42 4 2,290 45 439 22 20 65 63 Sierra Leone 6.5 37 14 -1 8.3 10.6 92 4.9 41 3 1,830 41 375 17 16 50 50 Togo 7.2 38 11 0 10.5 16.3 49 4.8 42 3 1,310 38 273 20 17 57 56 EASTERN AFRICA 388 36 9 -0 562 841 52 4.8 43 3 1,930 24 560 41 35 61 59 Burundi 10.7 43 10 0 17.2 30.4 65 6.2 46 3 790 10 977 22 18 59 57 Comoros 0.8 33 9 -3 1.0 1.3 36 4.3 41 3 1,530 28 868 19 14 61 60 Djibouti 0.9 27 9 -3 1.1 1.2 58 3.4 34 4 — 77 38,827 19 18 62 60 Eritrea 5.2 37 7 -5 7.3 10.4 46 4.4 43 2 1,180 21 981 8 7 63 60 Ethiopia 98.1 31 8 0 130.5 165.1 49 4.1 41 4 1,500 17 641 42 40 64 62 Kenya 44.3 31 8 0 60.1 81.4 39 3.9 41 3 2,890 24 794 58 53 62 60 Madagascar 23.0 34 7 0 34.3 52.8 38 4.4 41 3 1,400 33 660 40 33 65 64 Malawi 17.2 37 11 0 24.7 36.6 53 5.0 44 3 780 16 458 59 57 61 60 Mauritius 1.3 11 8 -1 1.3 1.2 14.5 1.4 20 9 18,290 41 1,663 76 39 74 71 Mayotte 0.2 31 2 -5 0.3 0.5 4 4.1 44 3 — 50 — — — 79 76 Mozambique 25.7 45 13 0 41.0 72.9 83 5.9 45 3 1,170 31 455 12 11 54 52 Reunion 0.9 17 5 -3 1.0 1.2 8 2.4 24 10 — 94 — 67 64 80 77 Rwanda 11.3 31 8 -1 15.8 21.0 32 4.2 41 3 1,530 28 959 53 48 65 63 Seychelles 0.09 17 8 6 0.1 0.1 12.7 2.4 22 8 24,630 54 9,173 — — 73 69 Somalia 11.1 44 12 -7 16.9 27.1 79 6.6 47 3 — 38 985 15 1 55 53 South Sudan 12.2 36 12 11 17.3 24.8 77 6.9 42 3 2,030 17 — 4 1 55 54 Tanzania 52.3 39 9 -1 79.4 129.4 37 5.2 45 3 2,530 30 360 34 26 62 60 Uganda 40.1 40 9 -1 63.4 104.1 54 5.9 48 2 1,690 18 582 27 26 59 58 Zambia 15.5 43 13 0 23.7 42.0 75 5.6 46 3 3,860 40 408 49 45 53 51
- 13. © 2015 Population Reference Bureau See notes on page 21 2015 WORLD POPULATION DATA SHEET 13 Barbados 0.3 12 9 2 0.3 0.3 19 1.7 20 13 14,750 46 2,525 59 55 75 73 Cuba 11.1 11 8 -2 11.2 10.6 4.2 1.7 17 13 18,710 75 348 74 72 78 77 Curaçao 0.2 13 8 1 0.2 0.2 8.7 2.1 19 15 — — — — — 78 75 Dominica 0.07 14 9 -5 0.07 0.06 20 2.1 22 10 10,300 68 1,133 — — 75 72 Dominican Republic 10.5 21 6 -3 11.3 12.2 31 2.5 31 6 12,450 72 1,310 70 68 73 70 Grenada 0.1 17 8 -2 0.1 0.1 15 2.1 26 7 11,650 41 3,710 — — 76 74 Guadeloupe 0.4 13 7 -2 0.4 0.4 8.7 2.2 21 14 — 98 — — — 81 78 Haiti 10.9 28 9 -3 13.6 16.9 42 3.2 35 4 1,750 59 1,092 35 31 64 61 Jamaica 2.7 18 7 -5 2.9 2.7 21 2.3 24 9 8,490 52 2,268 73 68 74 70 Martinique 0.4 11 8 -10 0.4 0.4 8 1.9 19 17 — 89 — — — 82 79 Puerto Rico 3.5 10 8 -15 3.5 3.4 7.2 1.5 18 17 23,960 99 5,806 84 72 79 76 St. Kitts-Nevis 0.05 14 8 1 0.05 0.06 13 1.8 21 8 21,990 32 921 — — 75 73 St. Lucia 0.2 12 6 0 0.2 0.2 18 1.5 22 9 10,230 15 5,855 56 52 79 75 St. Vincent and the Grenadines 0.1 17 8 -8 0.1 0.1 20 2.0 25 6 10,610 51 2,204 — — 71 70 Trinidad and Tobago 1.4 14 8 -1 1.3 1.2 13 1.7 21 9 26,220 15 5,375 43 38 75 71 SOUTH AMERICA 414 17 6 -0 464 496 18 2.0 26 8 14,850 84 309 75 69 75 72 Argentina 42.4 18 8 0 49.4 58.4 10.8 2.2 24 11 — 93 108 55 53 77 73 Bolivia 10.5 26 7 -1 13.0 15.8 39 3.2 31 6 6,130 69 242 61 34 67 65 Brazil 204.5 15 6 0 223.1 226.3 19 1.8 24 7 15,900 86 281 80 77 75 71 Chile 18.0 14 6 2 19.6 20.2 7.4 1.8 21 10 21,570 90 1,347 61 — 79 76 Colombia 48.2 19 6 -1 53.2 54.9 16 1.9 27 7 12,600 76 3,104 79 73 75 72 Ecuador 16.3 21 5 0 19.8 23.4 17 2.6 31 7 11,120 70 1,425 73 59 75 72 French Guiana 0.3 26 3 5 0.4 0.6 9 3.5 34 5 — 77 — — — 80 77 Guyana 0.7 21 7 -7 0.8 0.7 32 2.6 27 6 6,930 29 180 34 33 66 64 Paraguay 7.0 23 6 -1 8.5 10.1 29 2.8 33 5 8,010 64 159 79 70 72 70 Peru 31.2 20 5 -1 35.9 40.1 17 2.5 29 6 11,510 79 761 75 52 75 72 Suriname 0.6 18 7 -2 0.7 0.7 17 2.3 28 6 15,960 71 923 48 47 71 68 Uruguay 3.6 14 10 -1 3.7 3.8 8.9 1.9 21 14 20,220 93 204 77 75 77 73 Venezuela 30.6 20 5 0 36.1 40.5 13.3 2.5 28 6 17,140 94 1,120 70 62 75 72 ASIA 4,397 18 7 -0 4,939 5,324 33 2.2 25 8 11,450 47 938 66 60 72 70 ASIA (Excl. China) 3,017 21 7 -0 3,507 3,949 38 2.4 28 6 10,480 44 832 57 48 70 68 WESTERN ASIA 257 22 5 3 321 387 22 2.9 30 5 25,130 71 705 54 37 74 71 Armenia 3.0 14 9 -6 2.9 2.5 9 1.5 19 11 8,550 63 675 55 26 75 72 Azerbaijan 9.7 18 6 0 11.0 12.1 11 2.2 22 6 16,910 53 510 51 13 74 72 Bahrain 1.4 15 2 5 1.7 1.9 8 2.1 21 2 38,140 100 88,490 62 31 76 75 Cyprus 1.2 12 6 -12 1.3 1.4 5 1.4 17 12 29,800 67 1,260 — — 80 78 Georgia 3.8 14 12 -2 4.9 4.7 10 1.7 17 14 7,510 54 944 53 35 75 71 Iraq 37.1 31 4 2 53.4 76.5 37 4.2 41 3 14,670 71 1,080 53 33 69 67 Israel 8.4 21 5 1 10.6 13.9 3.0 3.3 28 11 32,550 91 2,846 — — 82 80 Jordan 8.1 28 6 3 9.0 11.4 17 3.5 37 3 11,910 83 3,810 61 42 74 73 Kuwait 3.8 17 2 22 5.0 6.1 8 2.3 23 2 87,700 98 35,893 52 39 74 73 Lebanon 6.2 15 5 31 5.5 5.6 8 1.7 26 6 17,330 87 2,993 58 34 77 76 Oman 4.2 21 3 45 5.2 5.7 10 2.9 22 3 36,240 75 13,574 24 15 77 75 Palestinian Territory 4.5 32 4 -2 6.6 9.2 18 4.1 40 3 5,080 83 9,925 57 44 73 72 Qatar 2.4 12 1 28 2.8 3.0 7 2.0 15 1 133850 100 18,750 38 34 78 78 Saudi Arabia 31.6 20 4 5 39.0 47.1 16 2.9 30 3 53,760 81 979 24 — 74 73 Syria 17.1 23 7 -26 26.1 31.2 16 2.8 33 4 — 54 366 54 38 70 64 Turkey 78.2 17 5 3 88.4 93.5 11 2.2 24 8 19,040 77 381 74 47 77 75 United Arab Emirates 9.6 14 1 8 12.3 15.5 6 1.8 16 1 63,750 83 19,093 28 24 77 76 Yemen 26.7 33 7 1 35.7 46.1 43 4.4 41 3 3,820 34 2,110 34 29 65 62 SOUTH CENTRAL ASIA 1,903 22 7 -1 2,227 2,526 45 2.5 30 5 6,010 34 776 54 46 68 66 CENTRAL ASIA 69 25 6 -1 82 96 37 2.9 29 5 9,930 47 219 54 50 69 65 Kazakhstan 17.5 25 8 0 20.7 24.6 25 3.0 25 7 21,580 53 76 51 50 70 66 Kyrgyzstan 6.0 27 6 -1 8.2 11.6 24 4.0 32 4 3,220 36 463 42 40 70 66 Tajikistan 8.5 33 7 -3 11.2 14.8 40 3.8 36 3 2,630 27 990 28 26 67 64 Turkmenistan 5.4 21 8 -1 6.2 6.6 46 2.3 28 4 14,520 50 279 48 46 65 61 Uzbekistan 31.3 23 5 -1 36.0 38.3 44 2.4 28 4 5,840 51 721 65 59 68 65 SOUTH ASIA 1,834 22 7 -1 2,145 2,430 45 2.5 30 5 5,870 33 857 54 46 68 66 Afghanistan 32.2 34 8 2 45.8 64.3 74 4.9 45 2 1,980 25 415 21 20 61 60 Bangladesh 160.4 20 6 -3 185.1 201.9 38 2.3 33 5 3,340 23 2,089 62 54 71 70 Bhutan 0.8 18 7 2 0.9 1.1 47 2.2 31 5 7,560 38 764 66 65 68 68 India 1,314.1 21 7 -1 1,512.9 1,660.1 42 2.3 29 5 5,760 32 842 54 47 68 66 POPULATION, HEALTH, AND ENVIRONMENT DATA AND ESTIMATES FOR THE COUNTRIES AND REGIONS OF THE WORLD Population mid-2015 (millions) Births per 1,000 Population Deaths per 1,000 Population Net Migration Rate per 1,000 Population Infant Mortality Ratea Total Fertility Rateb Percent of Population GNI per Capita ($US) 2014c Percent Urban Population per Square Kilometer of Arable Land Percent of Married Women 15-49 Using Contraceptiond Life Expectancy at Birth (years) mid-2030 (millions) mid-2050 (millions) Age 15 Age 65+ All Methods Modern Methods Both Sexes Males Fe WORLD 7,336 20 8 — 8,505 9,804 37 2.5 26 8 15,030 53 523 62 56 71 69 MORE DEVELOPED 1,254 11 10 2 1,295 1,310 5 1.7 16 17 39,020 77 238 67 59 79 76 LESS DEVELOPED 6,082 22 7 -1 7,210 8,495 40 2.6 28 6 9,870 48 696 61 55 69 68 LESS DEVELOPED (Excl. China) 4,702 24 7 -0 5,779 7,120 44 3.0 32 5 8,740 46 612 54 46 68 66 LEAST DEVELOPED 938 34 9 -1 1,300 1,887 62 4.3 40 4 2,270 29 521 37 32 62 60 AFRICA 1,171 36 10 -0 1,658 2,473 59 4.7 41 4 4,720 40 487 35 29 60 58 SUB-SAHARAN AFRICA 949 38 11 -0 1,369 2,081 64 5.0 43 3 3,480 38 484 30 25 57 56 NORTHERN AFRICA 222 29 6 -1 289 392 29 3.4 31 5 9,740 51 500 51 46 71 69 Algeria 39.9 26 6 -1 49.9 60.4 21 3.0 28 6 13,540 73 524 56 48 74 72 Egypt 89.1 31 6 0 117.9 162.4 22 3.5 31 4 11,020 43 3,196 59 57 71 70 Libya 6.3 21 4 -11 7.5 8.4 14 2.4 29 5 16,190 78 359 42 20 71 69 Morocco 34.1 22 6 -2 38.7 41.9 26 2.5 25 6 7,180 60 425 67 57 74 73 Sudan 40.9 38 9 -2 61.7 105.0 52 5.2 43 3 3,980 33 193 12 12 62 60 Tunisia 11.0 19 6 -1 12.3 12.9 16 2.1 23 8 10,600 68 388 63 50 76 74 Western Saharae 0.6 20 6 9 0.8 0.8 37 2.4 26 3 — 82 — — — 68 66 WESTERN AFRICA 349 39 12 -1 509 784 64 5.4 43 3 4,040 45 402 16 12 55 54 Benin 10.6 37 10 0 15.1 21.5 67 4.9 45 3 1,850 45 393 18 13 59 58 Burkina Faso 18.5 44 11 -1 28.4 46.6 69 6.0 45 2 1,660 27 308 18 18 56 56 Cape Verde 0.5 21 6 -2 0.6 0.7 22 2.4 31 6 6,320 62 1,090 61 57 75 71 Côte d’Ivoire 23.3 37 14 0 32.0 46.3 74 4.9 41 3 3,350 50 805 18 13 51 50 Gambia 2.0 42 10 -1 3.1 5.0 47 5.6 46 2 1,580 57 459 9 8 59 58 Ghana 27.7 33 8 -2 37.7 52.6 41 4.2 39 5 3,960 51 588 27 22 61 60 Guinea 11.0 38 12 0 16.0 24.2 67 5.1 42 3 1,140 36 366 6 5 60 58 Guinea-Bissau 1.8 37 13 -1 2.5 3.5 92 4.9 43 3 1,430 49 594 16 14 54 53 Liberia 4.5 36 9 -1 6.4 9.4 54 4.7 42 3 820 47 899 20 19 60 59 Mali 16.7 44 15 -4 26.1 43.6 56 5.9 47 3 1,660 39 245 10 10 53 53 Mauritania 3.6 34 9 -1 5.0 7.1 72 4.2 40 3 3,700 59 883 11 10 63 62 Niger 18.9 50 11 0 33.8 68.0 60 7.6 52 4 950 22 118 14 12 60 59 Nigeria 181.8 39 14 -0 261.7 396.5 69 5.5 43 3 5,680 50 520 15 10 52 52 Senegal 14.7 37 8 -1 21.5 32.3 33 5.0 42 4 2,290 45 439 22 20 65 63 Sierra Leone 6.5 37 14 -1 8.3 10.6 92 4.9 41 3 1,830 41 375 17 16 50 50 Togo 7.2 38 11 0 10.5 16.3 49 4.8 42 3 1,310 38 273 20 17 57 56 EASTERN AFRICA 388 36 9 -0 562 841 52 4.8 43 3 1,930 24 560 41 35 61 59 Burundi 10.7 43 10 0 17.2 30.4 65 6.2 46 3 790 10 977 22 18 59 57 Comoros 0.8 33 9 -3 1.0 1.3 36 4.3 41 3 1,530 28 868 19 14 61 60 Djibouti 0.9 27 9 -3 1.1 1.2 58 3.4 34 4 — 77 38,827 19 18 62 60 Eritrea 5.2 37 7 -5 7.3 10.4 46 4.4 43 2 1,180 21 981 8 7 63 60 Ethiopia 98.1 31 8 0 130.5 165.1 49 4.1 41 4 1,500 17 641 42 40 64 62 Kenya 44.3 31 8 0 60.1 81.4 39 3.9 41 3 2,890 24 794 58 53 62 60 Madagascar 23.0 34 7 0 34.3 52.8 38 4.4 41 3 1,400 33 660 40 33 65 64 Malawi 17.2 37 11 0 24.7 36.6 53 5.0 44 3 780 16 458 59 57 61 60 Mauritius 1.3 11 8 -1 1.3 1.2 14.5 1.4 20 9 18,290 41 1,663 76 39 74 71 Mayotte 0.2 31 2 -5 0.3 0.5 4 4.1 44 3 — 50 — — — 79 76 Mozambique 25.7 45 13 0 41.0 72.9 83 5.9 45 3 1,170 31 455 12 11 54 52 Reunion 0.9 17 5 -3 1.0 1.2 8 2.4 24 10 — 94 — 67 64 80 77 Rwanda 11.3 31 8 -1 15.8 21.0 32 4.2 41 3 1,530 28 959 53 48 65 63 Seychelles 0.09 17 8 6 0.1 0.1 12.7 2.4 22 8 24,630 54 9,173 — — 73 69 Somalia 11.1 44 12 -7 16.9 27.1 79 6.6 47 3 — 38 985 15 1 55 53 South Sudan 12.2 36 12 11 17.3 24.8 77 6.9 42 3 2,030 17 — 4 1 55 54 Tanzania 52.3 39 9 -1 79.4 129.4 37 5.2 45 3 2,530 30 360 34 26 62 60 Uganda 40.1 40 9 -1 63.4 104.1 54 5.9 48 2 1,690 18 582 27 26 59 58 Zambia 15.5 43 13 0 23.7 42.0 75 5.6 46 3 3,860 40 408 49 45 53 51
- 14. © 2015 Population Reference Bureau See notes on page 21 2015 WORLD POPULATION DATA SHEET 14 Yemen 26.7 33 7 1 35.7 46.1 43 4.4 41 3 3,820 34 2,110 34 29 65 62 SOUTH CENTRAL ASIA 1,903 22 7 -1 2,227 2,526 45 2.5 30 5 6,010 34 776 54 46 68 66 CENTRAL ASIA 69 25 6 -1 82 96 37 2.9 29 5 9,930 47 219 54 50 69 65 Kazakhstan 17.5 25 8 0 20.7 24.6 25 3.0 25 7 21,580 53 76 51 50 70 66 Kyrgyzstan 6.0 27 6 -1 8.2 11.6 24 4.0 32 4 3,220 36 463 42 40 70 66 Tajikistan 8.5 33 7 -3 11.2 14.8 40 3.8 36 3 2,630 27 990 28 26 67 64 Turkmenistan 5.4 21 8 -1 6.2 6.6 46 2.3 28 4 14,520 50 279 48 46 65 61 Uzbekistan 31.3 23 5 -1 36.0 38.3 44 2.4 28 4 5,840 51 721 65 59 68 65 SOUTH ASIA 1,834 22 7 -1 2,145 2,430 45 2.5 30 5 5,870 33 857 54 46 68 66 Afghanistan 32.2 34 8 2 45.8 64.3 74 4.9 45 2 1,980 25 415 21 20 61 60 Bangladesh 160.4 20 6 -3 185.1 201.9 38 2.3 33 5 3,340 23 2,089 62 54 71 70 Bhutan 0.8 18 7 2 0.9 1.1 47 2.2 31 5 7,560 38 764 66 65 68 68 India 1,314.1 21 7 -1 1,512.9 1,660.1 42 2.3 29 5 5,760 32 842 54 47 68 66 Iran 78.5 19 5 -1 90.2 99.3 15 1.8 24 5 16,080 71 442 82 60 74 72 Maldives 0.3 22 3 0 0.4 0.6 9 2.2 26 5 12,770 45 11,565 35 27 74 73 Nepal 28.0 22 7 -1 32.4 36.0 33 2.4 33 6 2,420 18 1,322 50 47 67 66 Pakistan 199.0 30 7 -2 254.7 344.0 69 3.8 36 4 5,100 38 939 35 26 66 66 Sri Lanka 20.9 18 6 -4 22.5 23.0 9 2.3 25 8 10,270 18 1,672 68 53 74 71 SOUTHEAST ASIA 628 20 7 -0 737 839 28 2.4 27 6 10,720 47 906 62 54 71 68 Brunei 0.4 17 3 1 0.5 0.5 4 1.6 25 5 71,020 77 9,796 — — 79 77 Cambodia 15.4 24 6 -2 18.1 21.3 28 2.7 31 6 3,080 21 376 56 39 64 61 Indonesia 255.7 21 6 -1 307.6 366.5 31 2.6 29 5 10,250 54 1,086 62 58 71 69 Laos 6.9 27 6 -3 8.8 10.6 68 3.1 37 4 4,910 38 475 50 42 68 67 Malaysia 30.8 17 5 3 36.0 42.3 7 2.0 26 6 23,850 74 3,231 49 32 75 73 Myanmar 52.1 19 9 -1 56.5 56.5 62 2.3 24 5 — 34 481 46 46 65 63 Philippines 103.0 23 6 -1 127.8 157.1 23 2.9 34 4 8,300 44 1,857 55 38 69 65 Singapore 5.5 10 5 14 6.5 7.0 1.8 1.3 16 11 80,270 100 879,543 62 55 83 80 Thailand 65.1 12 8 0 69.8 66.1 11 1.6 18 11 13,950 49 393 79 77 75 72 Timor-Leste 1.2 36 8 -9 1.8 2.8 45 5.7 42 5 5,680 32 775 22 21 68 66 Viet Nam 91.7 17 7 0 103.2 108.2 16 2.4 24 7 5,350 33 1,436 76 57 73 71 EAST ASIA 1,609 12 7 0 1,654 1,572 11 1.6 17 12 16,040 59 1,380 82 81 76 74 China 1,371.9 12 7 -0 1,422.5 1,365.7 12 1.7 17 10 13,130 55 1,293 85 84 75 73 China, Hong Kong SARf 7.3 9 6 3 8.1 8.6 1.6 1.2 11 15 56,570 100 231,314 80 75 84 81 China, Macao SARf 0.7 12 3 11 0.7 0.8 3 1.2 11 8 118460 100 — — — 83 80 Japan 126.9 8 10 1 116.6 96.9 2.1 1.4 13 26 37,920 93 3,000 54 44 83 80 Korea, North 25.0 14 9 0 26.7 27.0 25 2.0 22 10 — 61 1,064 71 65 70 66 Korea, South 50.7 9 5 3 52.2 48.1 3.0 1.2 14 13 34,620 82 3,339 80 70 82 79 Mongolia 3.0 28 6 -1 3.7 4.4 21 3.1 27 4 11,230 68 487 55 50 69 65 Taiwan 23.5 9 7 1 23.4 20.4 3.9 1.2 14 12 — 73 — 71 — 80 77 EUROPE 742 11 11 2 744 728 6 1.4 16 17 31,650 73 269 70 61 78 74 EUROPEAN UNION 510 10 10 2 520 518 4 1.6 16 19 36,280 73 470 72 64 81 78 NORTHERN EUROPE 103 12 9 4 112 120 4 1.8 18 17 40,340 79 522 81 78 81 78 Channel Islands 0.2 10 7 3 0.2 0.2 2.9 1.7 16 16 — 31 3,819 — — 82 80 Denmark 5.7 10 9 7 6.0 6.3 4 1.7 17 19 46,160 87 235 — — 81 79 Estonia 1.3 10 12 -1 1.3 1.2 2.8 1.5 16 19 25,690 68 212 63 58 77 73 Finland 5.5 10 10 3 5.8 6.1 2.2 1.7 16 20 40,000 85 244 77 75 81 78 Iceland 0.3 13 6 3 0.4 0.4 1.7 1.9 20 14 42,530 95 275 — — 82 81 Ireland 4.6 15 6 -5 5.2 5.8 3.7 2.0 22 13 40,820 60 395 65 61 81 79 Latvia 2.0 11 14 -4 1.6 1.4 3.5 1.6 15 19 23,150 68 168 68 56 74 70 Lithuania 2.9 11 14 -4 2.7 2.4 3.8 1.7 15 18 25,390 67 129 63 50 74 69 Norway 5.2 12 8 7 5.9 6.7 2.4 1.8 18 16 65,970 80 646 88 82 82 80 Sweden 9.8 12 9 8 11.4 12.4 2.2 1.9 17 20 46,710 84 376 75 65 82 80 United Kingdom 65.1 12 9 4 71.0 77.0 3.9 1.9 18 17 38,370 80 1,047 84 84 81 79 WESTERN EUROPE 191 10 10 4 198 199 3 1.7 16 19 44,790 77 566 71 68 81 79 Austria 8.6 10 9 6 9.2 9.5 3 1.5 14 18 45,040 67 638 70 68 81 78 Belgium 11.2 11 10 5 12.3 13.1 3.8 1.8 17 18 43,030 99 1,397 70 69 80 78 France 64.3 12 8 0 68.5 72.3 3.5 2.0 19 18 39,720 78 352 76 74 82 79 Germany 81.1 8 11 5 81.1 76.4 3.3 1.5 13 21 46,840 73 685 66 62 80 78 Liechtenstein 0.04 9 7 4 0.04 0.05 3.3 1.5 15 16 — 15 1,249 — — 82 81 Luxembourg 0.6 11 7 19 0.7 0.7 3.1 1.5 17 14 57,830 90 908 — — 82 80 Monaco 0.04 6 7 13 0.04 0.05 — 1.4 13 24 — 100 — — — — — Netherlands 16.9 10 9 2 17.6 17.9 3.8 1.7 17 17 47,660 90 1,675 69 67 81 79 Switzerland 8.3 10 8 11 8.7 9.0 3.9 1.5 15 18 59,600 74 2,057 82 78 83 81 POPULATION, HEALTH, AND ENVIRONMENT DATA AND ESTIMATES FOR THE COUNTRIES AND REGIONS OF THE WORLD Population mid-2015 (millions) Births per 1,000 Population Deaths per 1,000 Population Net Migration Rate per 1,000 Population Infant Mortality Ratea Total Fertility Rateb Percent of Population GNI per Capita ($US) 2014c Percent Urban Population per Square Kilometer of Arable Land Percent of Married Women 15-49 Using Contraceptiond Life Expectancy at Birth (years) mid-2030 (millions) mid-2050 (millions) Age 15 Age 65+ All Methods Modern Methods Both Sexes Males Fe WORLD 7,336 20 8 — 8,505 9,804 37 2.5 26 8 15,030 53 523 62 56 71 69 MORE DEVELOPED 1,254 11 10 2 1,295 1,310 5 1.7 16 17 39,020 77 238 67 59 79 76 LESS DEVELOPED 6,082 22 7 -1 7,210 8,495 40 2.6 28 6 9,870 48 696 61 55 69 68 LESS DEVELOPED (Excl. China) 4,702 24 7 -0 5,779 7,120 44 3.0 32 5 8,740 46 612 54 46 68 66 LEAST DEVELOPED 938 34 9 -1 1,300 1,887 62 4.3 40 4 2,270 29 521 37 32 62 60 AFRICA 1,171 36 10 -0 1,658 2,473 59 4.7 41 4 4,720 40 487 35 29 60 58 SUB-SAHARAN AFRICA 949 38 11 -0 1,369 2,081 64 5.0 43 3 3,480 38 484 30 25 57 56 NORTHERN AFRICA 222 29 6 -1 289 392 29 3.4 31 5 9,740 51 500 51 46 71 69 Algeria 39.9 26 6 -1 49.9 60.4 21 3.0 28 6 13,540 73 524 56 48 74 72 Egypt 89.1 31 6 0 117.9 162.4 22 3.5 31 4 11,020 43 3,196 59 57 71 70 Libya 6.3 21 4 -11 7.5 8.4 14 2.4 29 5 16,190 78 359 42 20 71 69 Morocco 34.1 22 6 -2 38.7 41.9 26 2.5 25 6 7,180 60 425 67 57 74 73 Sudan 40.9 38 9 -2 61.7 105.0 52 5.2 43 3 3,980 33 193 12 12 62 60 Tunisia 11.0 19 6 -1 12.3 12.9 16 2.1 23 8 10,600 68 388 63 50 76 74 Western Saharae 0.6 20 6 9 0.8 0.8 37 2.4 26 3 — 82 — — — 68 66 WESTERN AFRICA 349 39 12 -1 509 784 64 5.4 43 3 4,040 45 402 16 12 55 54 Benin 10.6 37 10 0 15.1 21.5 67 4.9 45 3 1,850 45 393 18 13 59 58 Burkina Faso 18.5 44 11 -1 28.4 46.6 69 6.0 45 2 1,660 27 308 18 18 56 56 Cape Verde 0.5 21 6 -2 0.6 0.7 22 2.4 31 6 6,320 62 1,090 61 57 75 71 Côte d’Ivoire 23.3 37 14 0 32.0 46.3 74 4.9 41 3 3,350 50 805 18 13 51 50 Gambia 2.0 42 10 -1 3.1 5.0 47 5.6 46 2 1,580 57 459 9 8 59 58 Ghana 27.7 33 8 -2 37.7 52.6 41 4.2 39 5 3,960 51 588 27 22 61 60 Guinea 11.0 38 12 0 16.0 24.2 67 5.1 42 3 1,140 36 366 6 5 60 58 Guinea-Bissau 1.8 37 13 -1 2.5 3.5 92 4.9 43 3 1,430 49 594 16 14 54 53 Liberia 4.5 36 9 -1 6.4 9.4 54 4.7 42 3 820 47 899 20 19 60 59 Mali 16.7 44 15 -4 26.1 43.6 56 5.9 47 3 1,660 39 245 10 10 53 53 Mauritania 3.6 34 9 -1 5.0 7.1 72 4.2 40 3 3,700 59 883 11 10 63 62 Niger 18.9 50 11 0 33.8 68.0 60 7.6 52 4 950 22 118 14 12 60 59 Nigeria 181.8 39 14 -0 261.7 396.5 69 5.5 43 3 5,680 50 520 15 10 52 52 Senegal 14.7 37 8 -1 21.5 32.3 33 5.0 42 4 2,290 45 439 22 20 65 63 Sierra Leone 6.5 37 14 -1 8.3 10.6 92 4.9 41 3 1,830 41 375 17 16 50 50 Togo 7.2 38 11 0 10.5 16.3 49 4.8 42 3 1,310 38 273 20 17 57 56 EASTERN AFRICA 388 36 9 -0 562 841 52 4.8 43 3 1,930 24 560 41 35 61 59 Burundi 10.7 43 10 0 17.2 30.4 65 6.2 46 3 790 10 977 22 18 59 57 Comoros 0.8 33 9 -3 1.0 1.3 36 4.3 41 3 1,530 28 868 19 14 61 60 Djibouti 0.9 27 9 -3 1.1 1.2 58 3.4 34 4 — 77 38,827 19 18 62 60 Eritrea 5.2 37 7 -5 7.3 10.4 46 4.4 43 2 1,180 21 981 8 7 63 60 Ethiopia 98.1 31 8 0 130.5 165.1 49 4.1 41 4 1,500 17 641 42 40 64 62 Kenya 44.3 31 8 0 60.1 81.4 39 3.9 41 3 2,890 24 794 58 53 62 60 Madagascar 23.0 34 7 0 34.3 52.8 38 4.4 41 3 1,400 33 660 40 33 65 64 Malawi 17.2 37 11 0 24.7 36.6 53 5.0 44 3 780 16 458 59 57 61 60 Mauritius 1.3 11 8 -1 1.3 1.2 14.5 1.4 20 9 18,290 41 1,663 76 39 74 71 Mayotte 0.2 31 2 -5 0.3 0.5 4 4.1 44 3 — 50 — — — 79 76 Mozambique 25.7 45 13 0 41.0 72.9 83 5.9 45 3 1,170 31 455 12 11 54 52 Reunion 0.9 17 5 -3 1.0 1.2 8 2.4 24 10 — 94 — 67 64 80 77 Rwanda 11.3 31 8 -1 15.8 21.0 32 4.2 41 3 1,530 28 959 53 48 65 63 Seychelles 0.09 17 8 6 0.1 0.1 12.7 2.4 22 8 24,630 54 9,173 — — 73 69 Somalia 11.1 44 12 -7 16.9 27.1 79 6.6 47 3 — 38 985 15 1 55 53 South Sudan 12.2 36 12 11 17.3 24.8 77 6.9 42 3 2,030 17 — 4 1 55 54 Tanzania 52.3 39 9 -1 79.4 129.4 37 5.2 45 3 2,530 30 360 34 26 62 60 Uganda 40.1 40 9 -1 63.4 104.1 54 5.9 48 2 1,690 18 582 27 26 59 58 Zambia 15.5 43 13 0 23.7 42.0 75 5.6 46 3 3,860 40 408 49 45 53 51
- 15. © 2015 Population Reference Bureau See notes on page 21 2015 WORLD POPULATION DATA SHEET 15 Lithuania 2.9 11 14 -4 2.7 2.4 3.8 1.7 15 18 25,390 67 129 63 50 74 69 Norway 5.2 12 8 7 5.9 6.7 2.4 1.8 18 16 65,970 80 646 88 82 82 80 Sweden 9.8 12 9 8 11.4 12.4 2.2 1.9 17 20 46,710 84 376 75 65 82 80 United Kingdom 65.1 12 9 4 71.0 77.0 3.9 1.9 18 17 38,370 80 1,047 84 84 81 79 WESTERN EUROPE 191 10 10 4 198 199 3 1.7 16 19 44,790 77 566 71 68 81 79 Austria 8.6 10 9 6 9.2 9.5 3 1.5 14 18 45,040 67 638 70 68 81 78 Belgium 11.2 11 10 5 12.3 13.1 3.8 1.8 17 18 43,030 99 1,397 70 69 80 78 France 64.3 12 8 0 68.5 72.3 3.5 2.0 19 18 39,720 78 352 76 74 82 79 Germany 81.1 8 11 5 81.1 76.4 3.3 1.5 13 21 46,840 73 685 66 62 80 78 Liechtenstein 0.04 9 7 4 0.04 0.05 3.3 1.5 15 16 — 15 1,249 — — 82 81 Luxembourg 0.6 11 7 19 0.7 0.7 3.1 1.5 17 14 57,830 90 908 — — 82 80 Monaco 0.04 6 7 13 0.04 0.05 — 1.4 13 24 — 100 — — — — — Netherlands 16.9 10 9 2 17.6 17.9 3.8 1.7 17 17 47,660 90 1,675 69 67 81 79 Switzerland 8.3 10 8 11 8.7 9.0 3.9 1.5 15 18 59,600 74 2,057 82 78 83 81 EASTERN EUROPE 292 12 13 1 280 260 8 1.6 16 14 21,130 69 153 69 57 73 68 Belarus 9.5 13 13 2 9.1 8.7 4.4 1.7 16 14 17,610 76 173 63 51 73 67 Bulgaria 7.2 9 15 -0 6.6 5.8 7.6 1.5 14 20 15,850 73 216 69 40 75 71 Czech Republic 10.6 10 10 2 10.8 11.1 2.4 1.5 15 17 26,970 74 334 86 78 79 76 Hungary 9.8 9 13 -3 9.7 9.4 4.6 1.4 15 18 23,830 69 224 81 71 76 72 Moldova 4.1 11 11 -1 3.7 2.9 10 1.3 16 10 5,480 42 227 60 42 72 68 Poland 38.5 10 10 -0 37.2 34.0 4.2 1.3 15 15 24,090 60 352 — — 78 74 Romania 19.8 9 13 -4 18.6 16.4 8.8 1.3 16 17 19,030 54 226 70 51 75 71 Russiag 144.3 13 13 2 140.4 134.2 9.3 1.8 16 13 24,710 74 121 68 55 71 65 Slovakia 5.4 10 9 0 5.4 5.0 6.0 1.4 15 14 25,970 54 389 80 66 76 73 Ukraineg 42.8 11 15 1 38.2 32.3 9.6 1.5 15 15 8,560 69 132 68 61 71 66 SOUTHERN EUROPE 156 9 10 -0 154 149 4 1.4 15 19 29,730 68 517 66 48 81 79 Albania 2.9 12 7 -6 3.0 2.8 7.9 1.8 19 12 10,260 56 467 69 10 78 76 Andorra 0.08 9 4 -7 0.08 0.07 3.4 1.3 15 18 — 86 3,254 — — — — Bosnia-Herzegovina 3.7 7 9 0 3.5 3.2 5 1.2 15 16 10,020 40 363 46 12 75 72 Croatia 4.2 9 12 -2 4.0 3.6 4.1 1.5 15 18 20,560 56 468 — — 77 74 Greece 11.5 9 10 -1 11.1 9.7 3.7 1.3 15 21 26,130 78 454 76 46 81 78 Italy 62.5 8 10 2 63.5 63.5 2.9 1.4 14 22 34,710 68 878 63 41 83 80 Kosovoh 1.8 13 4 -12 1.9 1.9 12 2.3 28 7 9,410 38 — 66 14 77 74 Macedoniai 2.1 11 10 0 2.0 1.8 10 1.5 17 13 12,600 57 500 40 27 75 73 Malta 0.4 10 8 3 0.4 0.4 5.5 1.4 15 16 27,020 95 4,799 86 46 82 80 Montenegro 0.6 12 10 -1 0.7 0.8 4.4 1.6 18 14 14,510 64 362 23 15 77 74 Portugal 10.3 8 10 -3 9.9 9.1 2.8 1.2 14 19 28,010 61 950 87 83 80 77 San Marino 0.03 9 8 5 0.03 0.03 2.2 1.5 15 18 — 94 3,293 — — 87 84 Serbia 7.1 9 14 -2 6.8 6.1 5.7 1.6 14 18 12,150 60 216 58 18 75 73 Slovenia 2.1 10 9 0 2.1 2.0 2.1 1.6 15 18 28,650 50 1,206 79 63 81 78 Spain 46.4 9 9 -2 45.4 43.7 2.9 1.3 15 18 32,860 77 373 66 62 83 80 OCEANIA 40 18 7 6 48 59 22 2.5 24 12 31,600 70 82 62 58 77 75 Australia 23.9 13 7 8 28.5 34.0 3.6 1.9 19 15 42,880 89 51 72 68 82 80 Federated States of Micronesia 0.1 24 5 -14 0.1 0.1 29 3.5 34 4 3,680 22 5,074 — 70 70 69 Fiji 0.9 21 8 -6 0.9 1.0 15 3.1 29 5 8,030 51 527 29 — 70 67 French Polynesia 0.3 16 5 0 0.3 0.3 6.0 2.0 24 7 — 56 10,265 — — 77 75 Guam 0.2 21 6 -6 0.2 0.2 13.3 2.9 26 8 — 93 17,953 67 58 79 76 Kiribati 0.1 30 9 -1 0.2 0.2 45 3.8 36 4 2,580 54 5,600 22 18 65 63 Marshall Islands 0.06 30 4 -17 0.06 0.07 26 4.1 41 3 4,630 74 2,753 45 42 72 70 Nauru 0.01 35 8 -9 0.01 0.02 33 3.9 37 1 — 100 — 36 23 66 62 New Caledonia 0.3 15 6 4 0.3 0.3 5 2.3 24 9 — 70 4,959 — — 77 74 New Zealand 4.6 13 7 11 5.2 5.7 5.7 1.9 20 15 33,760 86 794 75 72 81 80 Palau 0.02 13 11 0 0.02 0.02 13 1.7 20 6 14,280 84 1,779 33 30 72 69 Papua New Guinea 7.7 33 10 0 10.5 14.2 47 4.3 39 3 2,510 13 2,443 32 24 62 60 Samoa 0.2 29 5 -28 0.2 0.2 16 4.7 39 5 5,600 19 2,451 29 27 74 73 Solomon Islands 0.6 30 5 0 0.9 1.4 26 4.1 39 3 2,020 20 3,276 35 27 70 67 Tonga 0.1 27 7 -19 0.1 0.1 17 3.9 37 6 5,300 23 646 34 28 76 74 Tuvalu 0.01 25 9 0 0.01 0.02 10 3.2 33 5 5,260 59 — 31 22 70 67 Vanuatu 0.3 33 5 0 0.4 0.5 28 4.2 39 4 2,870 24 1,423 49 36 71 70 Population mid-2015 (millions) Births per 1,000 Population Deaths per 1,000 Population Net Migration Rate per 1,000 mid-2030 (millions) mid-2050 (millions) Infant Mortality Ratea Total Fertility Rateb Age 15 Age 65+ GNI per Capita ($US) 2014c Percent Urban Population per Square Kilometer of Arable Land All Methods Modern Methods Both Sexes Males Fe Population Percent of Percent of Married Life Expectancy POPULATION, HEALTH, AND ENVIRONMENT DATA AND ESTIMATES FOR THE COUNTRIES AND REGIONS OF THE WORLD Population mid-2015 (millions) Births per 1,000 Population Deaths per 1,000 Population Net Migration Rate per 1,000 Population Infant Mortality Ratea Total Fertility Rateb Percent of Population GNI per Capita ($US) 2014c Percent Urban Population per Square Kilometer of Arable Land Percent of Married Women 15-49 Using Contraceptiond Life Expectancy at Birth (years) mid-2030 (millions) mid-2050 (millions) Age 15 Age 65+ All Methods Modern Methods Both Sexes Males Fe WORLD 7,336 20 8 — 8,505 9,804 37 2.5 26 8 15,030 53 523 62 56 71 69 MORE DEVELOPED 1,254 11 10 2 1,295 1,310 5 1.7 16 17 39,020 77 238 67 59 79 76 LESS DEVELOPED 6,082 22 7 -1 7,210 8,495 40 2.6 28 6 9,870 48 696 61 55 69 68 LESS DEVELOPED (Excl. China) 4,702 24 7 -0 5,779 7,120 44 3.0 32 5 8,740 46 612 54 46 68 66 LEAST DEVELOPED 938 34 9 -1 1,300 1,887 62 4.3 40 4 2,270 29 521 37 32 62 60 AFRICA 1,171 36 10 -0 1,658 2,473 59 4.7 41 4 4,720 40 487 35 29 60 58 SUB-SAHARAN AFRICA 949 38 11 -0 1,369 2,081 64 5.0 43 3 3,480 38 484 30 25 57 56 NORTHERN AFRICA 222 29 6 -1 289 392 29 3.4 31 5 9,740 51 500 51 46 71 69 Algeria 39.9 26 6 -1 49.9 60.4 21 3.0 28 6 13,540 73 524 56 48 74 72 Egypt 89.1 31 6 0 117.9 162.4 22 3.5 31 4 11,020 43 3,196 59 57 71 70 Libya 6.3 21 4 -11 7.5 8.4 14 2.4 29 5 16,190 78 359 42 20 71 69 Morocco 34.1 22 6 -2 38.7 41.9 26 2.5 25 6 7,180 60 425 67 57 74 73 Sudan 40.9 38 9 -2 61.7 105.0 52 5.2 43 3 3,980 33 193 12 12 62 60 Tunisia 11.0 19 6 -1 12.3 12.9 16 2.1 23 8 10,600 68 388 63 50 76 74 Western Saharae 0.6 20 6 9 0.8 0.8 37 2.4 26 3 — 82 — — — 68 66 WESTERN AFRICA 349 39 12 -1 509 784 64 5.4 43 3 4,040 45 402 16 12 55 54 Benin 10.6 37 10 0 15.1 21.5 67 4.9 45 3 1,850 45 393 18 13 59 58 Burkina Faso 18.5 44 11 -1 28.4 46.6 69 6.0 45 2 1,660 27 308 18 18 56 56 Cape Verde 0.5 21 6 -2 0.6 0.7 22 2.4 31 6 6,320 62 1,090 61 57 75 71 Côte d’Ivoire 23.3 37 14 0 32.0 46.3 74 4.9 41 3 3,350 50 805 18 13 51 50 Gambia 2.0 42 10 -1 3.1 5.0 47 5.6 46 2 1,580 57 459 9 8 59 58 Ghana 27.7 33 8 -2 37.7 52.6 41 4.2 39 5 3,960 51 588 27 22 61 60 Guinea 11.0 38 12 0 16.0 24.2 67 5.1 42 3 1,140 36 366 6 5 60 58 Guinea-Bissau 1.8 37 13 -1 2.5 3.5 92 4.9 43 3 1,430 49 594 16 14 54 53 Liberia 4.5 36 9 -1 6.4 9.4 54 4.7 42 3 820 47 899 20 19 60 59 Mali 16.7 44 15 -4 26.1 43.6 56 5.9 47 3 1,660 39 245 10 10 53 53 Mauritania 3.6 34 9 -1 5.0 7.1 72 4.2 40 3 3,700 59 883 11 10 63 62 Niger 18.9 50 11 0 33.8 68.0 60 7.6 52 4 950 22 118 14 12 60 59 Nigeria 181.8 39 14 -0 261.7 396.5 69 5.5 43 3 5,680 50 520 15 10 52 52 Senegal 14.7 37 8 -1 21.5 32.3 33 5.0 42 4 2,290 45 439 22 20 65 63 Sierra Leone 6.5 37 14 -1 8.3 10.6 92 4.9 41 3 1,830 41 375 17 16 50 50 Togo 7.2 38 11 0 10.5 16.3 49 4.8 42 3 1,310 38 273 20 17 57 56 EASTERN AFRICA 388 36 9 -0 562 841 52 4.8 43 3 1,930 24 560 41 35 61 59 Burundi 10.7 43 10 0 17.2 30.4 65 6.2 46 3 790 10 977 22 18 59 57 Comoros 0.8 33 9 -3 1.0 1.3 36 4.3 41 3 1,530 28 868 19 14 61 60 Djibouti 0.9 27 9 -3 1.1 1.2 58 3.4 34 4 — 77 38,827 19 18 62 60 Eritrea 5.2 37 7 -5 7.3 10.4 46 4.4 43 2 1,180 21 981 8 7 63 60 Ethiopia 98.1 31 8 0 130.5 165.1 49 4.1 41 4 1,500 17 641 42 40 64 62 Kenya 44.3 31 8 0 60.1 81.4 39 3.9 41 3 2,890 24 794 58 53 62 60 Madagascar 23.0 34 7 0 34.3 52.8 38 4.4 41 3 1,400 33 660 40 33 65 64 Malawi 17.2 37 11 0 24.7 36.6 53 5.0 44 3 780 16 458 59 57 61 60 Mauritius 1.3 11 8 -1 1.3 1.2 14.5 1.4 20 9 18,290 41 1,663 76 39 74 71 Mayotte 0.2 31 2 -5 0.3 0.5 4 4.1 44 3 — 50 — — — 79 76 Mozambique 25.7 45 13 0 41.0 72.9 83 5.9 45 3 1,170 31 455 12 11 54 52 Reunion 0.9 17 5 -3 1.0 1.2 8 2.4 24 10 — 94 — 67 64 80 77 Rwanda 11.3 31 8 -1 15.8 21.0 32 4.2 41 3 1,530 28 959 53 48 65 63 Seychelles 0.09 17 8 6 0.1 0.1 12.7 2.4 22 8 24,630 54 9,173 — — 73 69 Somalia 11.1 44 12 -7 16.9 27.1 79 6.6 47 3 — 38 985 15 1 55 53 South Sudan 12.2 36 12 11 17.3 24.8 77 6.9 42 3 2,030 17 — 4 1 55 54 Tanzania 52.3 39 9 -1 79.4 129.4 37 5.2 45 3 2,530 30 360 34 26 62 60 Uganda 40.1 40 9 -1 63.4 104.1 54 5.9 48 2 1,690 18 582 27 26 59 58 Zambia 15.5 43 13 0 23.7 42.0 75 5.6 46 3 3,860 40 408 49 45 53 51
- 16. © 2015 Population Reference Bureau See notes on page 21 2015 WORLD POPULATION DATA SHEET 16 GNI per Capita ($US) 2014c Percent Urban Population per Square Kilometer of Arable Land Percent of Married Women 15-49 Using Contraceptiond Life Expectancy at Birth (years) Maternal Deaths per 100,000 Births Percent Ages 15-24 With HIV/AIDS Secondary School Enrollment Ratio Tertiary School Gender Parity Index Gender Ratio of Labor Force Participation Rates Female Share of Nonagricultural Wage Earners Female Share of Parliament Members All Methods Modern Methods Both Sexes Males Females 1990 2013 Males 2014 Females 2014 Males 2008/2014 Females 2008/2014 2008/2014 2013 2008/2013 2015 15,030 53 523 62 56 71 69 73 269 136 — — 78 76 1.03 0.66 34 20 39,020 77 238 67 59 79 76 82 25 15 — — 104 104 1.27 0.79 48 23 9,870 48 696 61 55 69 68 72 338 159 — — 74 71 0.99 0.63 28 19 8,740 46 612 54 46 68 66 70 443 200 0.4 0.7 69 66 0.94 0.56 28 17 2,270 29 521 37 32 62 60 63 900 384 0.5 0.8 46 40 0.66 0.79 27 22 4,720 40 487 35 29 60 58 61 801 412 0.9 1.5 54 49 — 0.73 30 21 3,480 38 484 30 25 57 56 59 964 488 1.1 1.9 49 42 — 0.84 35 21 9,740 51 500 51 46 71 69 72 242 118 0.1 0.1 78 75 1.09 0.32 20 — 13,540 73 524 56 48 74 72 77 160 89 0.1 0.1 96 100 1.51 0.21 18 26 11,020 43 3,196 59 57 71 70 73 120 45 0.1 0.1 90 88 0.89 0.32 19 — 16,190 78 359 42 20 71 69 74 31 15 — — — — — 0.39 — 16 7,180 60 425 67 57 74 73 75 310 120 0.1 0.1 74 63 0.89 0.35 22 11 3,980 33 193 12 12 62 60 64 720 360 0.1 0.2 43 39 1.12 0.41 — — 10,600 68 388 63 50 76 74 78 91 46 0.1 0.1 89 93 1.62 0.35 28 31 — 82 — — — 68 66 70 — — — — — — — — — — 4,040 45 402 16 12 55 54 56 1,053 539 0.6 1.0 47 40 — 0.76 — 10 1,850 45 393 18 13 59 58 61 600 340 0.2 0.4 65 43 0.27 0.86 26 7 1,660 27 308 18 18 56 56 57 770 400 0.4 0.5 31 26 0.49 0.86 — 13 6,320 62 1,090 61 57 75 71 80 230 53 0.8 0.3 89 103 1.46 0.62 — 21 3,350 50 805 18 13 51 50 52 740 720 0.9 1.4 46 32 0.62 0.64 21 9 1,580 57 459 9 8 59 58 60 710 430 0.4 0.7 59 56 — 0.87 — 9 3,960 51 588 27 22 61 60 63 760 380 0.4 0.6 69 65 0.63 0.94 32 11 1,140 36 366 6 5 60 58 61 1,100 650 0.4 0.7 47 29 0.44 0.84 18 22 1,430 49 594 16 14 54 53 56 930 560 0.8 1.5 — — — 0.87 — 14 820 47 899 20 19 60 59 61 1,200 640 0.3 0.4 42 33 0.63 0.90 24 11 1,660 39 245 10 10 53 53 53 1,100 550 0.5 0.7 50 40 0.43 0.62 — 9 3,700 59 883 11 10 63 62 64 630 320 0.2 0.4 30 29 0.44 0.36 — 22 950 22 118 14 12 60 59 61 1,000 630 0.1 0.2 22 15 0.34 0.45 36 13 5,680 50 520 15 10 52 52 53 1,200 560 0.7 1.3 46 41 — 0.76 — 5 2,290 45 439 22 20 65 63 67 530 320 0.1 0.1 43 39 0.59 0.75 27 43 1,830 41 375 17 16 50 50 51 2,300 1,100 0.2 0.4 48 42 — 0.95 — 12 1,310 38 273 20 17 57 56 57 660 450 0.5 0.8 — — 0.39 0.99 — 18 1,930 24 560 41 35 61 59 63 1,034 440 1.3 1.9 41 38 — 0.92 36 28 790 10 977 22 18 59 57 61 1,300 740 0.3 0.4 37 29 0.42 1.02 — 35 1,530 28 868 19 14 61 60 62 630 350 — — 63 65 0.86 0.44 — 3 — 77 38,827 19 18 62 60 63 400 230 0.5 0.8 53 43 0.68 0.54 — 13 1,180 21 981 8 7 63 60 65 1,700 380 0.2 0.3 — — 0.50 0.89 — 22 1,500 17 641 42 40 64 62 65 1,400 420 0.5 0.6 — — — 0.88 39 26 2,890 24 794 58 53 62 60 65 490 400 — — 69 65 0.70 0.86 36 21 1,400 33 660 40 33 65 64 66 740 440 0.2 0.1 39 38 0.94 0.96 37 21 780 16 458 59 57 61 60 62 1,100 510 2.4 4.1 38 35 0.65 1.04 — 17 18,290 41 1,663 76 39 74 71 78 70 73 0.2 0.2 94 98 1.22 0.59 38 12 — 50 — — — 79 76 83 — — — — — — — — — — 1,170 31 455 12 11 54 52 56 1,300 480 — — 27 25 0.69 1.03 — 40 — 94 — 67 64 80 77 84 — — — — — — — — — — 1,530 28 959 53 48 65 63 66 1,400 320 1.0 1.3 31 34 0.75 1.01 34 58 24,630 54 9,173 — — 73 69 78 — — — — 69 75 2.20 — 53 44 — 38 985 15 1 55 53 57 1,300 850 0.2 0.2 — — — 0.49 — 14 2,030 17 — 4 1 55 54 56 1,800 730 0.7 1.3 — — — — — 24 2,530 30 360 34 26 62 60 63 910 410 1.4 2.1 34 32 0.54 0.98 33 36 1,690 18 582 27 26 59 58 60 780 360 2.3 3.7 29 25 0.78 0.96 35 35 3,860 40 408 49 45 53 51 56 580 280 3.3 4.2 — — — 0.85 — 13 POPULATION, HEALTH, AND ENVIRONMENT DATA AND ESTIMATES FOR THE COUNTRIES AND REGIONS OF THE WORLD GNI per Capita ($US) 2014c Percent Urban Population per Square Kilometer of Arable Land Percent of Married Women 15-49 Using Contraceptiond Life Expectancy at Birth (years) Maternal Deaths per 100,000 Births Percent Ages 15-24 With HIV/AIDS Secondary School Enrollment Ratio Tertiary School Gender Parity Index Gender Ratio of Labor Force Participation Rates Female Share of Nonagricultural Wage Earners Female Share of Parliament Members All Methods Modern Methods Both Sexes Males Females 1990 2013 Males 2014 Females 2014 Males 2008/2014 Females 2008/2014 2008/2014 2013 2008/2013 2015 15,030 53 523 62 56 71 69 73 269 136 — — 78 76 1.03 0.66 34 20 39,020 77 238 67 59 79 76 82 25 15 — — 104 104 1.27 0.79 48 23 9,870 48 696 61 55 69 68 72 338 159 — — 74 71 0.99 0.63 28 19 8,740 46 612 54 46 68 66 70 443 200 0.4 0.7 69 66 0.94 0.56 28 17 2,270 29 521 37 32 62 60 63 900 384 0.5 0.8 46 40 0.66 0.79 27 22 4,720 40 487 35 29 60 58 61 801 412 0.9 1.5 54 49 — 0.73 30 21 3,480 38 484 30 25 57 56 59 964 488 1.1 1.9 49 42 — 0.84 35 21 9,740 51 500 51 46 71 69 72 242 118 0.1 0.1 78 75 1.09 0.32 20 — 13,540 73 524 56 48 74 72 77 160 89 0.1 0.1 96 100 1.51 0.21 18 26 11,020 43 3,196 59 57 71 70 73 120 45 0.1 0.1 90 88 0.89 0.32 19 — 16,190 78 359 42 20 71 69 74 31 15 — — — — — 0.39 — 16 7,180 60 425 67 57 74 73 75 310 120 0.1 0.1 74 63 0.89 0.35 22 11 3,980 33 193 12 12 62 60 64 720 360 0.1 0.2 43 39 1.12 0.41 — — 10,600 68 388 63 50 76 74 78 91 46 0.1 0.1 89 93 1.62 0.35 28 31 — 82 — — — 68 66 70 — — — — — — — — — — 4,040 45 402 16 12 55 54 56 1,053 539 0.6 1.0 47 40 — 0.76 — 10 1,850 45 393 18 13 59 58 61 600 340 0.2 0.4 65 43 0.27 0.86 26 7 1,660 27 308 18 18 56 56 57 770 400 0.4 0.5 31 26 0.49 0.86 — 13 6,320 62 1,090 61 57 75 71 80 230 53 0.8 0.3 89 103 1.46 0.62 — 21 3,350 50 805 18 13 51 50 52 740 720 0.9 1.4 46 32 0.62 0.64 21 9 1,580 57 459 9 8 59 58 60 710 430 0.4 0.7 59 56 — 0.87 — 9 3,960 51 588 27 22 61 60 63 760 380 0.4 0.6 69 65 0.63 0.94 32 11 1,140 36 366 6 5 60 58 61 1,100 650 0.4 0.7 47 29 0.44 0.84 18 22 1,430 49 594 16 14 54 53 56 930 560 0.8 1.5 — — — 0.87 — 14 820 47 899 20 19 60 59 61 1,200 640 0.3 0.4 42 33 0.63 0.90 24 11 1,660 39 245 10 10 53 53 53 1,100 550 0.5 0.7 50 40 0.43 0.62 — 9 3,700 59 883 11 10 63 62 64 630 320 0.2 0.4 30 29 0.44 0.36 — 22 950 22 118 14 12 60 59 61 1,000 630 0.1 0.2 22 15 0.34 0.45 36 13 5,680 50 520 15 10 52 52 53 1,200 560 0.7 1.3 46 41 — 0.76 — 5 2,290 45 439 22 20 65 63 67 530 320 0.1 0.1 43 39 0.59 0.75 27 43 1,830 41 375 17 16 50 50 51 2,300 1,100 0.2 0.4 48 42 — 0.95 — 12 1,310 38 273 20 17 57 56 57 660 450 0.5 0.8 — — 0.39 0.99 — 18 1,930 24 560 41 35 61 59 63 1,034 440 1.3 1.9 41 38 — 0.92 36 28 790 10 977 22 18 59 57 61 1,300 740 0.3 0.4 37 29 0.42 1.02 — 35 1,530 28 868 19 14 61 60 62 630 350 — — 63 65 0.86 0.44 — 3 — 77 38,827 19 18 62 60 63 400 230 0.5 0.8 53 43 0.68 0.54 — 13 1,180 21 981 8 7 63 60 65 1,700 380 0.2 0.3 — — 0.50 0.89 — 22 1,500 17 641 42 40 64 62 65 1,400 420 0.5 0.6 — — — 0.88 39 26 2,890 24 794 58 53 62 60 65 490 400 — — 69 65 0.70 0.86 36 21 1,400 33 660 40 33 65 64 66 740 440 0.2 0.1 39 38 0.94 0.96 37 21 780 16 458 59 57 61 60 62 1,100 510 2.4 4.1 38 35 0.65 1.04 — 17 18,290 41 1,663 76 39 74 71 78 70 73 0.2 0.2 94 98 1.22 0.59 38 12 — 50 — — — 79 76 83 — — — — — — — — — — 1,170 31 455 12 11 54 52 56 1,300 480 — — 27 25 0.69 1.03 — 40 — 94 — 67 64 80 77 84 — — — — — — — — — — 1,530 28 959 53 48 65 63 66 1,400 320 1.0 1.3 31 34 0.75 1.01 34 58 24,630 54 9,173 — — 73 69 78 — — — — 69 75 2.20 — 53 44 — 38 985 15 1 55 53 57 1,300 850 0.2 0.2 — — — 0.49 — 14 2,030 17 — 4 1 55 54 56 1,800 730 0.7 1.3 — — — — — 24 2,530 30 360 34 26 62 60 63 910 410 1.4 2.1 34 32 0.54 0.98 33 36 1,690 18 582 27 26 59 58 60 780 360 2.3 3.7 29 25 0.78 0.96 35 35 3,860 40 408 49 45 53 51 56 580 280 3.3 4.2 — — — 0.85 — 13 Population mid-2015 (millions) Births per 1,000 Population Deaths per 1,000 Population Net Migration Rate per 1,000 Population Infant Mortality Ratea Total Fertility Rateb Percent of Population GNI per Capita ($US) 2014c Percent Urban Population per Square Kilometer of Arable Land Percent of Married Women 15-49 Using Contraceptiond Life Expectancy at Birth (years) mid-2030 (millions) mid-2050 (millions) Age 15 Age 65+ All Methods Modern Methods Both Sexes Males Fe WORLD 7,336 20 8 — 8,505 9,804 37 2.5 26 8 15,030 53 523 62 56 71 69 MORE DEVELOPED 1,254 11 10 2 1,295 1,310 5 1.7 16 17 39,020 77 238 67 59 79 76 LESS DEVELOPED 6,082 22 7 -1 7,210 8,495 40 2.6 28 6 9,870 48 696 61 55 69 68 LESS DEVELOPED (Excl. China) 4,702 24 7 -0 5,779 7,120 44 3.0 32 5 8,740 46 612 54 46 68 66 LEAST DEVELOPED 938 34 9 -1 1,300 1,887 62 4.3 40 4 2,270 29 521 37 32 62 60 AFRICA 1,171 36 10 -0 1,658 2,473 59 4.7 41 4 4,720 40 487 35 29 60 58 SUB-SAHARAN AFRICA 949 38 11 -0 1,369 2,081 64 5.0 43 3 3,480 38 484 30 25 57 56 NORTHERN AFRICA 222 29 6 -1 289 392 29 3.4 31 5 9,740 51 500 51 46 71 69 Algeria 39.9 26 6 -1 49.9 60.4 21 3.0 28 6 13,540 73 524 56 48 74 72 Egypt 89.1 31 6 0 117.9 162.4 22 3.5 31 4 11,020 43 3,196 59 57 71 70 Libya 6.3 21 4 -11 7.5 8.4 14 2.4 29 5 16,190 78 359 42 20 71 69 Morocco 34.1 22 6 -2 38.7 41.9 26 2.5 25 6 7,180 60 425 67 57 74 73 Sudan 40.9 38 9 -2 61.7 105.0 52 5.2 43 3 3,980 33 193 12 12 62 60 Tunisia 11.0 19 6 -1 12.3 12.9 16 2.1 23 8 10,600 68 388 63 50 76 74 Western Saharae 0.6 20 6 9 0.8 0.8 37 2.4 26 3 — 82 — — — 68 66 WESTERN AFRICA 349 39 12 -1 509 784 64 5.4 43 3 4,040 45 402 16 12 55 54 Benin 10.6 37 10 0 15.1 21.5 67 4.9 45 3 1,850 45 393 18 13 59 58 Burkina Faso 18.5 44 11 -1 28.4 46.6 69 6.0 45 2 1,660 27 308 18 18 56 56 Cape Verde 0.5 21 6 -2 0.6 0.7 22 2.4 31 6 6,320 62 1,090 61 57 75 71 Côte d’Ivoire 23.3 37 14 0 32.0 46.3 74 4.9 41 3 3,350 50 805 18 13 51 50 Gambia 2.0 42 10 -1 3.1 5.0 47 5.6 46 2 1,580 57 459 9 8 59 58 Ghana 27.7 33 8 -2 37.7 52.6 41 4.2 39 5 3,960 51 588 27 22 61 60 Guinea 11.0 38 12 0 16.0 24.2 67 5.1 42 3 1,140 36 366 6 5 60 58 Guinea-Bissau 1.8 37 13 -1 2.5 3.5 92 4.9 43 3 1,430 49 594 16 14 54 53 Liberia 4.5 36 9 -1 6.4 9.4 54 4.7 42 3 820 47 899 20 19 60 59 Mali 16.7 44 15 -4 26.1 43.6 56 5.9 47 3 1,660 39 245 10 10 53 53 Mauritania 3.6 34 9 -1 5.0 7.1 72 4.2 40 3 3,700 59 883 11 10 63 62 Niger 18.9 50 11 0 33.8 68.0 60 7.6 52 4 950 22 118 14 12 60 59 Nigeria 181.8 39 14 -0 261.7 396.5 69 5.5 43 3 5,680 50 520 15 10 52 52 Senegal 14.7 37 8 -1 21.5 32.3 33 5.0 42 4 2,290 45 439 22 20 65 63 Sierra Leone 6.5 37 14 -1 8.3 10.6 92 4.9 41 3 1,830 41 375 17 16 50 50 Togo 7.2 38 11 0 10.5 16.3 49 4.8 42 3 1,310 38 273 20 17 57 56 EASTERN AFRICA 388 36 9 -0 562 841 52 4.8 43 3 1,930 24 560 41 35 61 59 Burundi 10.7 43 10 0 17.2 30.4 65 6.2 46 3 790 10 977 22 18 59 57 Comoros 0.8 33 9 -3 1.0 1.3 36 4.3 41 3 1,530 28 868 19 14 61 60 Djibouti 0.9 27 9 -3 1.1 1.2 58 3.4 34 4 — 77 38,827 19 18 62 60 Eritrea 5.2 37 7 -5 7.3 10.4 46 4.4 43 2 1,180 21 981 8 7 63 60 Ethiopia 98.1 31 8 0 130.5 165.1 49 4.1 41 4 1,500 17 641 42 40 64 62 Kenya 44.3 31 8 0 60.1 81.4 39 3.9 41 3 2,890 24 794 58 53 62 60 Madagascar 23.0 34 7 0 34.3 52.8 38 4.4 41 3 1,400 33 660 40 33 65 64 Malawi 17.2 37 11 0 24.7 36.6 53 5.0 44 3 780 16 458 59 57 61 60 Mauritius 1.3 11 8 -1 1.3 1.2 14.5 1.4 20 9 18,290 41 1,663 76 39 74 71 Mayotte 0.2 31 2 -5 0.3 0.5 4 4.1 44 3 — 50 — — — 79 76 Mozambique 25.7 45 13 0 41.0 72.9 83 5.9 45 3 1,170 31 455 12 11 54 52 Reunion 0.9 17 5 -3 1.0 1.2 8 2.4 24 10 — 94 — 67 64 80 77 Rwanda 11.3 31 8 -1 15.8 21.0 32 4.2 41 3 1,530 28 959 53 48 65 63 Seychelles 0.09 17 8 6 0.1 0.1 12.7 2.4 22 8 24,630 54 9,173 — — 73 69 Somalia 11.1 44 12 -7 16.9 27.1 79 6.6 47 3 — 38 985 15 1 55 53 South Sudan 12.2 36 12 11 17.3 24.8 77 6.9 42 3 2,030 17 — 4 1 55 54 Tanzania 52.3 39 9 -1 79.4 129.4 37 5.2 45 3 2,530 30 360 34 26 62 60 Uganda 40.1 40 9 -1 63.4 104.1 54 5.9 48 2 1,690 18 582 27 26 59 58 Zambia 15.5 43 13 0 23.7 42.0 75 5.6 46 3 3,860 40 408 49 45 53 51