SlideShare una empresa de Scribd logo
1 de 14
CP, and CPK, PP, and PPK
For short term data

For long term data

Standard Deviation
( σ )= R/dn

Standard Deviation

Cp = (USL – LSL)/ 6σ
CPU = (USL – X)/ 3 σ
CPL = (LSL – X)/ 3 σ
CPK = minimum of CPU and CPL

Pp = (USL – LSL)/ 6σ
PPU = (USL – X )/ 3 σ
PPL = (LSL – X )/ 3 σ
PPK = minimum of PPU and PPL

( σ )=

∑ (X-X )2/(n-1)

In both cases all formulas stay same, only formula for standard deviation changed,
and notification changed from C to P.

PP , Cp = Capability Index ( spread of data/process)
PPK , CPK = Performance index ( centralization of data/process)
All of 1st understand CP and CPK Graphically
Upper specified limit

CP

LSL

14
12
10
8
6
4
2
0

CPU
Center line

Axis Title

CPL

USL

Lower specified limit

Desired location of
data, centralized.
good Cp K

1 2 3 4 5 6 7 8 9 1011121314151617181920
0 1 2 3 4 5 6 7 8 9 10111213141516171819

Axis Title
All Data looks to be inside of this yellow curve, mean good spread of data.
Mean good CP.
But all data is not centralized, it is towards LSL , So we can get high number of
rejections, mean – CPK is not good.
To study, Cp, CpK, Pp , PpK you must know HISTOGRAM .

If you don’t know , then 1st study it, and next 4-slides will explain it.
And if you already know, then that’s great, just skip, next 4 -slides.
HISTOGRAM





It is used to observe that , how is the process going.
Or we can say, use to predict future performance of a process.
Any change in process.
It is simply a bar chart, from which we get, info of the process- how
its going, it is in limits or not.

10

Lower
limit

Upper
limit

HISTOGRAM

8
6
4

Trend line

2
0
3

4

5

6

7

8

9

10

11

2

3

4

5

6

7

8

9

10
How to build HISTOGRAM in Excel.(with example)
1.) 1st we have to Study/Collect specifications like -diameter (Data) for 24 products.

1 2 3 4 5 6 7 8 9 10 11 12 13 14 15 16 17 18 19 20 21 22 23 24
D DIA 6 5 7 10 9 8 4 7 5 6 7 7 8 6 8 7 5 7 8 6 7 7 8 8

2.) Calculate RANGE.
RANGE= Maximum value - Minimum value
So here , maximum value= 10,
Minimum value = 4
So RANGE = 10- 4 =6
3.) Now decide the NUMBER OF CELLS.

We have 24 data points ,
and it fall in 1st group ,
so- No of cells = 6

Data Points
20 -50
51-100
101-200
201-500
501-1000
Over 1000

Number of Cells
6
7
8
9
10
11-20

4.) Calculate the approximately cell width.
Cell width= RANGE/ NO OF CELLS
= 6/6 =1
5.) Round Off the cell width.
If cell width come in a complicated manner, like 0.34, 0.89 or else , then
round off it to , one you want, like : 0.50 or 1 or else.
6.) Now construct the Cell Groups with keep in mind cell width( cell width=1)
2
3
4
5
6
7
8
9
10
11

3
4
5
6
7
8
9
10
11
12

Cell width=1

Cell width same for
all cell groups =1

7.) Now find number of data values/ Frequencies in each Cell Group.
You can do this manually , by counting itself or by using formula .(frequency
formula) Mean how many values fall in each group.
A
B
C
cell groups frequency
1
2
3
0
2
3
4
1
3
4
5
3
4
5
6
4
5
6
7
8
6
7
8
6
7
8
9
1
8
9
10
1
9
10
11
0
10 11
12
0

(D1:D24) values are on previous page)
Go to yellow block, type, =frequency( D1:D24, B1:B10), and
press Enter.
Then select yellow block and all sky blue blocks, press
F2, and press CTRL , SHIFT, ENTER. ( frequency formula
will get implement in all sky blue blocks as in yellow block )
And you will get frequency of data values in each group,
As in group (7 – 8) , frequency is 6.
8.) Now we got frequency data in each group, now we can build Histogram.
frequency data is our final data.
now select this data a build a bar chart. That’s it.

10

Frequency

8
6
4
2
0
3

4

5

6

7

8

9

10

11

2

3

4

5

6

7

8

9

10

Dia (mm)
Group 4 - 5, show values from 4.1 to 5
Group 5 - 6, show values from 5.1 to 6
So this rule for all groups.

Trend line – also give an
visual idea of moving
process.
LETS FIND , CP, AND CPK FOR SHORT TERM DATA.
sample

lot

2

1
2
3
4
5

1
5.5
5.1
5
5.2
5.4

3
5.4
5
5.1
5.3
5.4

4
5.2
5.2
5.4
5.5
5.4

5
5.1
5
5
5.1
5.1

6
7
5.1 5.4
5.2
5
5
5
5.2 5.5
5.5
5

8
5.5
5.1
5
5.4
5.2

5
5
5.5
5.1
5.2

Range(R )

0.5

0.5 0.4

0.3

0.1 0.5 0.5

0.5

0.5 0.1

sample
sample
sample
sample
sample

5
5
5
5.5
5.1

9

10 11 12
5 5.2 5.7
5.1 5.4
5
5.1
5 5.2
5 5.3 5.5
5 5.1 5.4
0.4

0.7

13
5.4
5
5.4
5.2
5.4

14
5.2
5.2
5
5
5.1

15
5.2
5
5
5.1
5.4

0.4 0.2 0.4

0.4
average

R
dn = 2.326

( for 5 samples, from table 1.1, last slide)

σ = R/dn = 0.17196
USL = 6.2, and LSL = 4.2

( GIVEN)

Data Points
20 -50
51-100
101-200
201-500
501-1000
Over 1000

Number of Cells
6
7
8
9
10
11-20
RANGE = (max-min ) = 0.7
NUMBER OF CELLS = 7
CELL WIDTH = 0.7/7 = 0.1
ROUND OFF = 0.2
CELL GROUP frequency

USL = 6.2, and LSL = 4.2

30

0

4

4.2

0

4.2

4.4

0

4.4

4.6

0

15

4.6

4.8

0

10

4.8

5

24

5

5.2

27

5.2

5.4

15

5.4

5.6

8

5.6

5.8

1

5.8

6

0

6

6.2

0

6.2

6.4

0

6.4

6.6

0

USL

4

LSL

3.8

25
20

standard deviation

σ = R/dn = 0.171969046

5

0
4

4.2

4.4

4.6

4.8

5

5.2

5.4

5.6

5.8

6

6.2

6.4

6.6

3.8

4

4.2

4.4

4.6

4.8

5

5.2

5.4

5.6

5.8

6

6.2

6.4

•

Cp = (USL – LSL)/ 6σ = 1.938333333

•
•
•

CPU = (USL – X)/ 3 σ = 1.957716667
CPL = (LSL – X)/ 3 σ = 1.91895
CPK = minimum of CPU and CPL = 1.9188
Lets find Pp and PpK for long term data
1
2
3
4
5
6
7
8
9
10
11
12
13
14
15
16
17
18
19
20
SUM
AVERAGE

X
5.5
5.1
5
5.2
5.4
5
5
5
5.5
5.1
5.4
5
5.1
5.3
5.4
5.2
5.2
5.4
5.5
5.4
104.7
5.235

(X - X ) (X - X )2
-0.26 0.07022
0.135 0.01823
0.235 0.05523
0.035 0.00123
-0.16 0.02722
0.235 0.05523
0.235 0.05523
0.235 0.05523
-0.26 0.07022
0.135 0.01823
-0.16 0.02722
0.235 0.05523
0.135 0.01823
-0.06 0.00422
-0.16 0.02722
0.035 0.00123
0.035 0.00123
-0.16 0.02722
-0.26 0.07022
-0.16 0.02722
0.6855

∑(X-X )2

Standard Deviation

( σ )=

∑ (X-X )2/(n-1)

Data Points
20 -50
51-100
101-200
201-500
501-1000
Over 1000

= 0.6855/(20-1)
= 0.1899

Number of Cells
6
7
8
9
10
11-20
Range = (max – min ) = 0.5
Number of cells = 6
Cell width = 0.5/6 = 0.08
Round off cell width = 0.2

USL= 6.2 ,

LSL= 4.2

(GIVEN)

cell group frequency

0
0
0
0
5
6
6
3
0
0
0
0
0

7
6
5

USL

4.2
4.4
4.6
4.8
5
5.2
5.4
5.6
5.8
6
6.2
6.4
6.6

LSL

4
4.2
4.4
4.6
4.8
5
5.2
5.4
5.6
5.8
6
6.2
6.4

4
3
2
1
0
4.2

4.4

4.6

4.8

5

5.2

5.4

5.6

5.8

6

6.2

6.4

6.6

4

4.2

4.4

4.6

4.8

5

5.2

5.4

5.6

5.8

6

6.2

6.4

Standard Deviation

( σ )=

∑ (X-X )2/(n-1)

= 0.6855/(20-1)
= 0.1899

Pp = (USL – LSL)/ 6σ = 1.75
PPU = (USL – X )/ 3 σ = 1.69
PPL = (LSL – X )/ 3 σ = 1.81
PPK = minimum of PPU and PPL = 1.81
CP

0.5
0.75
1
1.1
1.2
1.3
1.4
1.5
1.6
1.7
1.8
1.9
2

Ppk
CPK

PPM

0
0.1
0.2
0.3
0.4
0.5
0.6
0.7
0.8
0.9
1
1.1
1.2
1.3
1.4
1.5
1.6
1.7
1.8
1.9
2

133,614
24,449
2,700
967
318
96
27
7
2
0.34
0.067
0.012
0.0018

PPM – Parts rejected Per Million

PPM
PPM
500,000
382,089
274,253
184,060
115,070
66,807
35,930
17,864
8,198
3,467
1,350
483
159
48
13
3
1
0.170
0.033
0.006
0.001
Table 1.1
X-bar Chart
Sample
Size = N

for sigma

R Chart Constants
LCL
UPL

S Chart Constants
LCL
UCL

A2

A3

dn

D3

D4

B3

B4

2
3
4

1.88
1.023
0.729

2.659
1.954
1.628

1.128
1.693
2.059

0
0
0

3.267
2.574
2.282

0
0
0

3.267
2.568
2.266

5

0.577

1.427

2.326

0

2.114

0

2.089

6
7
8
9
10
11
12
13
14
15
16
17
18
19
20
21
22
23
24
25

0.483
0.419
0.373
0.337
0.308
0.285
0.266
0.249
0.235
0.223
0.212
0.203
0.194
0.187
0.18
0.173
0.167
0.162
0.157
0.153

1.287
1.182
1.099
1.032
0.975
0.927
0.886
0.85
0.817
0.789
0.763
0.739
0.718
0.698
0.68
0.663
0.647
0.633
0.619
0.606

2.534
2.704
2.847
2.97
3.078
3.173
3.258
3.336
3.407
3.472
3.532
3.588
3.64
3.689
3.735
3.778
3.819
3.858
3.895
3.931

0
0.076
0.136
0.184
0.223
0.256
0.283
0.307
0.328
0.347
0.363
0.378
0.391
0.403
0.415
0.425
0.434
0.443
0.451
0.459

2.004
1.924
1.864
1.816
1.777
1.744
1.717
1.693
1.672
1.653
1.637
1.622
1.608
1.597
1.585
1.575
1.566
1.557
1.548
1.541

0.03
0.118
0.185
0.239
0.284
0.321
0.354
0.382
0.406
0.428
0.448
0.466
0.482
0.497
0.51
0.523
0.534
0.545
0.555
0.565

1.97
1.882
1.815
1.761
1.716
1.679
1.646
1.618
1.594
1.572
1.552
1.534
1.518
1.503
1.49
1.477
1.466
1.455
1.445
1.435
• That’s it .
• I Hope you got it.

• Have any question, please let me know.

Más contenido relacionado

La actualidad más candente

Statistical Process Control
Statistical Process ControlStatistical Process Control
Statistical Process ControlMarwa Abo-Amra
 
Six Sigma Statistical Process Control (SPC) Training Module
Six Sigma Statistical Process Control (SPC) Training ModuleSix Sigma Statistical Process Control (SPC) Training Module
Six Sigma Statistical Process Control (SPC) Training ModuleFrank-G. Adler
 
10. measurement system analysis (msa)
10. measurement system analysis (msa)10. measurement system analysis (msa)
10. measurement system analysis (msa)Hakeem-Ur- Rehman
 
X bar and R control charts
X bar and R control chartsX bar and R control charts
X bar and R control chartsDhruv Shah
 
Measuremen Systems Analysis Training Module
Measuremen Systems Analysis Training ModuleMeasuremen Systems Analysis Training Module
Measuremen Systems Analysis Training ModuleFrank-G. Adler
 
Seven Statistical tools for Quality Management
Seven Statistical tools for Quality ManagementSeven Statistical tools for Quality Management
Seven Statistical tools for Quality ManagementShilpi Arora
 
Six Sigma Process Capability Study (PCS) Training Module
Six Sigma Process Capability Study (PCS) Training Module Six Sigma Process Capability Study (PCS) Training Module
Six Sigma Process Capability Study (PCS) Training Module Frank-G. Adler
 
Value stream mapping water manufacturer
Value stream mapping   water manufacturerValue stream mapping   water manufacturer
Value stream mapping water manufacturerRajat Ranjan
 
Measurement System Analysis (MSA)
Measurement System Analysis (MSA)Measurement System Analysis (MSA)
Measurement System Analysis (MSA)Ram Kumar
 
mistake proofing
mistake proofingmistake proofing
mistake proofingJaya Teja
 
Root cause analysis - tools and process
Root cause analysis - tools and processRoot cause analysis - tools and process
Root cause analysis - tools and processCharles Cotter, PhD
 
Measurement systems analysis v1.1
Measurement systems analysis v1.1Measurement systems analysis v1.1
Measurement systems analysis v1.1Alexander Polyakov
 

La actualidad más candente (20)

Statistical Process Control
Statistical Process ControlStatistical Process Control
Statistical Process Control
 
Six Sigma Statistical Process Control (SPC) Training Module
Six Sigma Statistical Process Control (SPC) Training ModuleSix Sigma Statistical Process Control (SPC) Training Module
Six Sigma Statistical Process Control (SPC) Training Module
 
10. measurement system analysis (msa)
10. measurement system analysis (msa)10. measurement system analysis (msa)
10. measurement system analysis (msa)
 
5. spc control charts
5. spc   control charts5. spc   control charts
5. spc control charts
 
X bar and R control charts
X bar and R control chartsX bar and R control charts
X bar and R control charts
 
7 qc tools
7 qc tools7 qc tools
7 qc tools
 
Measuremen Systems Analysis Training Module
Measuremen Systems Analysis Training ModuleMeasuremen Systems Analysis Training Module
Measuremen Systems Analysis Training Module
 
Seven Statistical tools for Quality Management
Seven Statistical tools for Quality ManagementSeven Statistical tools for Quality Management
Seven Statistical tools for Quality Management
 
Acceptance Sampling[1]
Acceptance Sampling[1]Acceptance Sampling[1]
Acceptance Sampling[1]
 
7 QC Tools Training
7 QC Tools Training7 QC Tools Training
7 QC Tools Training
 
Six Sigma Process Capability Study (PCS) Training Module
Six Sigma Process Capability Study (PCS) Training Module Six Sigma Process Capability Study (PCS) Training Module
Six Sigma Process Capability Study (PCS) Training Module
 
PROCESS CAPABILITY
PROCESS CAPABILITYPROCESS CAPABILITY
PROCESS CAPABILITY
 
Value stream mapping water manufacturer
Value stream mapping   water manufacturerValue stream mapping   water manufacturer
Value stream mapping water manufacturer
 
PFMEA
PFMEAPFMEA
PFMEA
 
Control charts
Control chartsControl charts
Control charts
 
TPM: Quality Maintenance (Hinshitsu Hozen)
TPM: Quality Maintenance (Hinshitsu Hozen)TPM: Quality Maintenance (Hinshitsu Hozen)
TPM: Quality Maintenance (Hinshitsu Hozen)
 
Measurement System Analysis (MSA)
Measurement System Analysis (MSA)Measurement System Analysis (MSA)
Measurement System Analysis (MSA)
 
mistake proofing
mistake proofingmistake proofing
mistake proofing
 
Root cause analysis - tools and process
Root cause analysis - tools and processRoot cause analysis - tools and process
Root cause analysis - tools and process
 
Measurement systems analysis v1.1
Measurement systems analysis v1.1Measurement systems analysis v1.1
Measurement systems analysis v1.1
 

Destacado

Process Capability - Cp, Cpk. Pp, Ppk
Process Capability - Cp, Cpk. Pp, Ppk Process Capability - Cp, Cpk. Pp, Ppk
Process Capability - Cp, Cpk. Pp, Ppk J. García - Verdugo
 
How to use and interpret SPC (Statistical Process Control) charts – 20 Januar...
How to use and interpret SPC (Statistical Process Control) charts – 20 Januar...How to use and interpret SPC (Statistical Process Control) charts – 20 Januar...
How to use and interpret SPC (Statistical Process Control) charts – 20 Januar...NHS England
 
Summary research on c pk vs cp
Summary research on c pk vs cpSummary research on c pk vs cp
Summary research on c pk vs cpIngrid McKenzie
 
Описательная статистика
Описательная статистикаОписательная статистика
Описательная статистикаSixSigmaOnline
 
SPC WithAdrian Adrian Beale
SPC WithAdrian Adrian BealeSPC WithAdrian Adrian Beale
SPC WithAdrian Adrian BealeAdrian Beale
 
Statistical Process Control
Statistical Process ControlStatistical Process Control
Statistical Process ControlNicola Mezzetti
 
Process capability analysis
Process capability analysisProcess capability analysis
Process capability analysisSurya Teja
 
Six Sigma : Process Capability
Six Sigma : Process CapabilitySix Sigma : Process Capability
Six Sigma : Process CapabilityLalit Padekar
 
Оценка способности процесса
Оценка способности процессаОценка способности процесса
Оценка способности процессаSixSigmaOnline
 
Six Sigma the best ppt
Six Sigma the best pptSix Sigma the best ppt
Six Sigma the best pptRabia Sgh S
 
Introduction To Taguchi Method
Introduction To Taguchi MethodIntroduction To Taguchi Method
Introduction To Taguchi MethodRamon Balisnomo
 

Destacado (17)

Process Capability - Cp, Cpk. Pp, Ppk
Process Capability - Cp, Cpk. Pp, Ppk Process Capability - Cp, Cpk. Pp, Ppk
Process Capability - Cp, Cpk. Pp, Ppk
 
Basics of Process Capability
Basics of Process CapabilityBasics of Process Capability
Basics of Process Capability
 
Customer requirements
Customer requirementsCustomer requirements
Customer requirements
 
Ppk pp pc ingles
Ppk pp pc inglesPpk pp pc ingles
Ppk pp pc ingles
 
How to use and interpret SPC (Statistical Process Control) charts – 20 Januar...
How to use and interpret SPC (Statistical Process Control) charts – 20 Januar...How to use and interpret SPC (Statistical Process Control) charts – 20 Januar...
How to use and interpret SPC (Statistical Process Control) charts – 20 Januar...
 
Summary research on c pk vs cp
Summary research on c pk vs cpSummary research on c pk vs cp
Summary research on c pk vs cp
 
Описательная статистика
Описательная статистикаОписательная статистика
Описательная статистика
 
SPC WithAdrian Adrian Beale
SPC WithAdrian Adrian BealeSPC WithAdrian Adrian Beale
SPC WithAdrian Adrian Beale
 
Statistical Process Control
Statistical Process ControlStatistical Process Control
Statistical Process Control
 
Process capability analysis
Process capability analysisProcess capability analysis
Process capability analysis
 
Six Sigma : Process Capability
Six Sigma : Process CapabilitySix Sigma : Process Capability
Six Sigma : Process Capability
 
Оценка способности процесса
Оценка способности процессаОценка способности процесса
Оценка способности процесса
 
Process Capability[1]
Process Capability[1]Process Capability[1]
Process Capability[1]
 
Toyota Part Approval (PA) Process
Toyota Part Approval (PA) ProcessToyota Part Approval (PA) Process
Toyota Part Approval (PA) Process
 
Six sigma ppt
Six sigma pptSix sigma ppt
Six sigma ppt
 
Six Sigma the best ppt
Six Sigma the best pptSix Sigma the best ppt
Six Sigma the best ppt
 
Introduction To Taguchi Method
Introduction To Taguchi MethodIntroduction To Taguchi Method
Introduction To Taguchi Method
 

Similar a 6 sigma

7 qc toools LEARN and KNOW how to BUILD IN EXCEL
7 qc toools LEARN and KNOW how to BUILD IN EXCEL7 qc toools LEARN and KNOW how to BUILD IN EXCEL
7 qc toools LEARN and KNOW how to BUILD IN EXCELrajesh1655
 
Measures of Relative Standing and Boxplots
Measures of Relative Standing and BoxplotsMeasures of Relative Standing and Boxplots
Measures of Relative Standing and BoxplotsLong Beach City College
 
Image compression- JPEG Compression & its Modes
Image compression- JPEG Compression & its ModesImage compression- JPEG Compression & its Modes
Image compression- JPEG Compression & its Modeskanimozhirajasekaren
 
M4L1.ppt
M4L1.pptM4L1.ppt
M4L1.pptdudoo1
 
Panel101R princeton.pdf
Panel101R princeton.pdfPanel101R princeton.pdf
Panel101R princeton.pdfJeanTaipeChvez
 
2014-mo444-practical-assignment-04-paulo_faria
2014-mo444-practical-assignment-04-paulo_faria2014-mo444-practical-assignment-04-paulo_faria
2014-mo444-practical-assignment-04-paulo_fariaPaulo Faria
 
20- Tabular & Graphical Presentation of data(UG2017-18).ppt
20- Tabular & Graphical Presentation of data(UG2017-18).ppt20- Tabular & Graphical Presentation of data(UG2017-18).ppt
20- Tabular & Graphical Presentation of data(UG2017-18).pptRAJESHKUMAR428748
 
An Improved Adaptive Multi-Objective Particle Swarm Optimization for Disassem...
An Improved Adaptive Multi-Objective Particle Swarm Optimization for Disassem...An Improved Adaptive Multi-Objective Particle Swarm Optimization for Disassem...
An Improved Adaptive Multi-Objective Particle Swarm Optimization for Disassem...IJRESJOURNAL
 
Experimental designs and data analysis in the field of soil science by making...
Experimental designs and data analysis in the field of soil science by making...Experimental designs and data analysis in the field of soil science by making...
Experimental designs and data analysis in the field of soil science by making...Manoj Sharma
 
Optimum Algorithm for Computing the Standardized Moments Using MATLAB 7.10(R2...
Optimum Algorithm for Computing the Standardized Moments Using MATLAB 7.10(R2...Optimum Algorithm for Computing the Standardized Moments Using MATLAB 7.10(R2...
Optimum Algorithm for Computing the Standardized Moments Using MATLAB 7.10(R2...Waqas Tariq
 
Dither Signal Design Problem (DSDP) for Closed-Loop Estimation Industrial Mod...
Dither Signal Design Problem (DSDP) for Closed-Loop Estimation Industrial Mod...Dither Signal Design Problem (DSDP) for Closed-Loop Estimation Industrial Mod...
Dither Signal Design Problem (DSDP) for Closed-Loop Estimation Industrial Mod...Alkis Vazacopoulos
 
LSBB_NOK_bob1
LSBB_NOK_bob1LSBB_NOK_bob1
LSBB_NOK_bob1THWIN BOB
 
Regression and Classification with R
Regression and Classification with RRegression and Classification with R
Regression and Classification with RYanchang Zhao
 
Computer aided design of communication systems / Simulation Communication Sys...
Computer aided design of communication systems / Simulation Communication Sys...Computer aided design of communication systems / Simulation Communication Sys...
Computer aided design of communication systems / Simulation Communication Sys...Makan Mohammadi
 
Join Cardinality Estimation Methods_in_Oracle12c.pdf
Join Cardinality Estimation Methods_in_Oracle12c.pdfJoin Cardinality Estimation Methods_in_Oracle12c.pdf
Join Cardinality Estimation Methods_in_Oracle12c.pdfChinar3
 
Pham,Nhat_ResearchPoster
Pham,Nhat_ResearchPosterPham,Nhat_ResearchPoster
Pham,Nhat_ResearchPosterNhat Pham
 

Similar a 6 sigma (20)

7 qc toools LEARN and KNOW how to BUILD IN EXCEL
7 qc toools LEARN and KNOW how to BUILD IN EXCEL7 qc toools LEARN and KNOW how to BUILD IN EXCEL
7 qc toools LEARN and KNOW how to BUILD IN EXCEL
 
Measures of Relative Standing and Boxplots
Measures of Relative Standing and BoxplotsMeasures of Relative Standing and Boxplots
Measures of Relative Standing and Boxplots
 
Image compression- JPEG Compression & its Modes
Image compression- JPEG Compression & its ModesImage compression- JPEG Compression & its Modes
Image compression- JPEG Compression & its Modes
 
M4L1.ppt
M4L1.pptM4L1.ppt
M4L1.ppt
 
R
RR
R
 
Panel101R princeton.pdf
Panel101R princeton.pdfPanel101R princeton.pdf
Panel101R princeton.pdf
 
2014-mo444-practical-assignment-04-paulo_faria
2014-mo444-practical-assignment-04-paulo_faria2014-mo444-practical-assignment-04-paulo_faria
2014-mo444-practical-assignment-04-paulo_faria
 
20- Tabular & Graphical Presentation of data(UG2017-18).ppt
20- Tabular & Graphical Presentation of data(UG2017-18).ppt20- Tabular & Graphical Presentation of data(UG2017-18).ppt
20- Tabular & Graphical Presentation of data(UG2017-18).ppt
 
An Improved Adaptive Multi-Objective Particle Swarm Optimization for Disassem...
An Improved Adaptive Multi-Objective Particle Swarm Optimization for Disassem...An Improved Adaptive Multi-Objective Particle Swarm Optimization for Disassem...
An Improved Adaptive Multi-Objective Particle Swarm Optimization for Disassem...
 
Experimental designs and data analysis in the field of soil science by making...
Experimental designs and data analysis in the field of soil science by making...Experimental designs and data analysis in the field of soil science by making...
Experimental designs and data analysis in the field of soil science by making...
 
multiscale_tutorial.pdf
multiscale_tutorial.pdfmultiscale_tutorial.pdf
multiscale_tutorial.pdf
 
Optimum Algorithm for Computing the Standardized Moments Using MATLAB 7.10(R2...
Optimum Algorithm for Computing the Standardized Moments Using MATLAB 7.10(R2...Optimum Algorithm for Computing the Standardized Moments Using MATLAB 7.10(R2...
Optimum Algorithm for Computing the Standardized Moments Using MATLAB 7.10(R2...
 
Dither Signal Design Problem (DSDP) for Closed-Loop Estimation Industrial Mod...
Dither Signal Design Problem (DSDP) for Closed-Loop Estimation Industrial Mod...Dither Signal Design Problem (DSDP) for Closed-Loop Estimation Industrial Mod...
Dither Signal Design Problem (DSDP) for Closed-Loop Estimation Industrial Mod...
 
Module 2
Module 2Module 2
Module 2
 
LSBB_NOK_bob1
LSBB_NOK_bob1LSBB_NOK_bob1
LSBB_NOK_bob1
 
Regression and Classification with R
Regression and Classification with RRegression and Classification with R
Regression and Classification with R
 
Computer aided design of communication systems / Simulation Communication Sys...
Computer aided design of communication systems / Simulation Communication Sys...Computer aided design of communication systems / Simulation Communication Sys...
Computer aided design of communication systems / Simulation Communication Sys...
 
Join Cardinality Estimation Methods_in_Oracle12c.pdf
Join Cardinality Estimation Methods_in_Oracle12c.pdfJoin Cardinality Estimation Methods_in_Oracle12c.pdf
Join Cardinality Estimation Methods_in_Oracle12c.pdf
 
Pham,Nhat_ResearchPoster
Pham,Nhat_ResearchPosterPham,Nhat_ResearchPoster
Pham,Nhat_ResearchPoster
 
Cluto presentation
Cluto presentationCluto presentation
Cluto presentation
 

Último

Holdier Curriculum Vitae (April 2024).pdf
Holdier Curriculum Vitae (April 2024).pdfHoldier Curriculum Vitae (April 2024).pdf
Holdier Curriculum Vitae (April 2024).pdfagholdier
 
Measures of Dispersion and Variability: Range, QD, AD and SD
Measures of Dispersion and Variability: Range, QD, AD and SDMeasures of Dispersion and Variability: Range, QD, AD and SD
Measures of Dispersion and Variability: Range, QD, AD and SDThiyagu K
 
Interactive Powerpoint_How to Master effective communication
Interactive Powerpoint_How to Master effective communicationInteractive Powerpoint_How to Master effective communication
Interactive Powerpoint_How to Master effective communicationnomboosow
 
Unit-IV- Pharma. Marketing Channels.pptx
Unit-IV- Pharma. Marketing Channels.pptxUnit-IV- Pharma. Marketing Channels.pptx
Unit-IV- Pharma. Marketing Channels.pptxVishalSingh1417
 
Russian Escort Service in Delhi 11k Hotel Foreigner Russian Call Girls in Delhi
Russian Escort Service in Delhi 11k Hotel Foreigner Russian Call Girls in DelhiRussian Escort Service in Delhi 11k Hotel Foreigner Russian Call Girls in Delhi
Russian Escort Service in Delhi 11k Hotel Foreigner Russian Call Girls in Delhikauryashika82
 
Sanyam Choudhary Chemistry practical.pdf
Sanyam Choudhary Chemistry practical.pdfSanyam Choudhary Chemistry practical.pdf
Sanyam Choudhary Chemistry practical.pdfsanyamsingh5019
 
Kisan Call Centre - To harness potential of ICT in Agriculture by answer farm...
Kisan Call Centre - To harness potential of ICT in Agriculture by answer farm...Kisan Call Centre - To harness potential of ICT in Agriculture by answer farm...
Kisan Call Centre - To harness potential of ICT in Agriculture by answer farm...Krashi Coaching
 
Activity 01 - Artificial Culture (1).pdf
Activity 01 - Artificial Culture (1).pdfActivity 01 - Artificial Culture (1).pdf
Activity 01 - Artificial Culture (1).pdfciinovamais
 
Key note speaker Neum_Admir Softic_ENG.pdf
Key note speaker Neum_Admir Softic_ENG.pdfKey note speaker Neum_Admir Softic_ENG.pdf
Key note speaker Neum_Admir Softic_ENG.pdfAdmir Softic
 
Call Girls in Dwarka Mor Delhi Contact Us 9654467111
Call Girls in Dwarka Mor Delhi Contact Us 9654467111Call Girls in Dwarka Mor Delhi Contact Us 9654467111
Call Girls in Dwarka Mor Delhi Contact Us 9654467111Sapana Sha
 
Nutritional Needs Presentation - HLTH 104
Nutritional Needs Presentation - HLTH 104Nutritional Needs Presentation - HLTH 104
Nutritional Needs Presentation - HLTH 104misteraugie
 
BAG TECHNIQUE Bag technique-a tool making use of public health bag through wh...
BAG TECHNIQUE Bag technique-a tool making use of public health bag through wh...BAG TECHNIQUE Bag technique-a tool making use of public health bag through wh...
BAG TECHNIQUE Bag technique-a tool making use of public health bag through wh...Sapna Thakur
 
Grant Readiness 101 TechSoup and Remy Consulting
Grant Readiness 101 TechSoup and Remy ConsultingGrant Readiness 101 TechSoup and Remy Consulting
Grant Readiness 101 TechSoup and Remy ConsultingTechSoup
 
Disha NEET Physics Guide for classes 11 and 12.pdf
Disha NEET Physics Guide for classes 11 and 12.pdfDisha NEET Physics Guide for classes 11 and 12.pdf
Disha NEET Physics Guide for classes 11 and 12.pdfchloefrazer622
 
Accessible design: Minimum effort, maximum impact
Accessible design: Minimum effort, maximum impactAccessible design: Minimum effort, maximum impact
Accessible design: Minimum effort, maximum impactdawncurless
 
1029 - Danh muc Sach Giao Khoa 10 . pdf
1029 -  Danh muc Sach Giao Khoa 10 . pdf1029 -  Danh muc Sach Giao Khoa 10 . pdf
1029 - Danh muc Sach Giao Khoa 10 . pdfQucHHunhnh
 
Student login on Anyboli platform.helpin
Student login on Anyboli platform.helpinStudent login on Anyboli platform.helpin
Student login on Anyboli platform.helpinRaunakKeshri1
 
Advanced Views - Calendar View in Odoo 17
Advanced Views - Calendar View in Odoo 17Advanced Views - Calendar View in Odoo 17
Advanced Views - Calendar View in Odoo 17Celine George
 
A Critique of the Proposed National Education Policy Reform
A Critique of the Proposed National Education Policy ReformA Critique of the Proposed National Education Policy Reform
A Critique of the Proposed National Education Policy ReformChameera Dedduwage
 
The basics of sentences session 2pptx copy.pptx
The basics of sentences session 2pptx copy.pptxThe basics of sentences session 2pptx copy.pptx
The basics of sentences session 2pptx copy.pptxheathfieldcps1
 

Último (20)

Holdier Curriculum Vitae (April 2024).pdf
Holdier Curriculum Vitae (April 2024).pdfHoldier Curriculum Vitae (April 2024).pdf
Holdier Curriculum Vitae (April 2024).pdf
 
Measures of Dispersion and Variability: Range, QD, AD and SD
Measures of Dispersion and Variability: Range, QD, AD and SDMeasures of Dispersion and Variability: Range, QD, AD and SD
Measures of Dispersion and Variability: Range, QD, AD and SD
 
Interactive Powerpoint_How to Master effective communication
Interactive Powerpoint_How to Master effective communicationInteractive Powerpoint_How to Master effective communication
Interactive Powerpoint_How to Master effective communication
 
Unit-IV- Pharma. Marketing Channels.pptx
Unit-IV- Pharma. Marketing Channels.pptxUnit-IV- Pharma. Marketing Channels.pptx
Unit-IV- Pharma. Marketing Channels.pptx
 
Russian Escort Service in Delhi 11k Hotel Foreigner Russian Call Girls in Delhi
Russian Escort Service in Delhi 11k Hotel Foreigner Russian Call Girls in DelhiRussian Escort Service in Delhi 11k Hotel Foreigner Russian Call Girls in Delhi
Russian Escort Service in Delhi 11k Hotel Foreigner Russian Call Girls in Delhi
 
Sanyam Choudhary Chemistry practical.pdf
Sanyam Choudhary Chemistry practical.pdfSanyam Choudhary Chemistry practical.pdf
Sanyam Choudhary Chemistry practical.pdf
 
Kisan Call Centre - To harness potential of ICT in Agriculture by answer farm...
Kisan Call Centre - To harness potential of ICT in Agriculture by answer farm...Kisan Call Centre - To harness potential of ICT in Agriculture by answer farm...
Kisan Call Centre - To harness potential of ICT in Agriculture by answer farm...
 
Activity 01 - Artificial Culture (1).pdf
Activity 01 - Artificial Culture (1).pdfActivity 01 - Artificial Culture (1).pdf
Activity 01 - Artificial Culture (1).pdf
 
Key note speaker Neum_Admir Softic_ENG.pdf
Key note speaker Neum_Admir Softic_ENG.pdfKey note speaker Neum_Admir Softic_ENG.pdf
Key note speaker Neum_Admir Softic_ENG.pdf
 
Call Girls in Dwarka Mor Delhi Contact Us 9654467111
Call Girls in Dwarka Mor Delhi Contact Us 9654467111Call Girls in Dwarka Mor Delhi Contact Us 9654467111
Call Girls in Dwarka Mor Delhi Contact Us 9654467111
 
Nutritional Needs Presentation - HLTH 104
Nutritional Needs Presentation - HLTH 104Nutritional Needs Presentation - HLTH 104
Nutritional Needs Presentation - HLTH 104
 
BAG TECHNIQUE Bag technique-a tool making use of public health bag through wh...
BAG TECHNIQUE Bag technique-a tool making use of public health bag through wh...BAG TECHNIQUE Bag technique-a tool making use of public health bag through wh...
BAG TECHNIQUE Bag technique-a tool making use of public health bag through wh...
 
Grant Readiness 101 TechSoup and Remy Consulting
Grant Readiness 101 TechSoup and Remy ConsultingGrant Readiness 101 TechSoup and Remy Consulting
Grant Readiness 101 TechSoup and Remy Consulting
 
Disha NEET Physics Guide for classes 11 and 12.pdf
Disha NEET Physics Guide for classes 11 and 12.pdfDisha NEET Physics Guide for classes 11 and 12.pdf
Disha NEET Physics Guide for classes 11 and 12.pdf
 
Accessible design: Minimum effort, maximum impact
Accessible design: Minimum effort, maximum impactAccessible design: Minimum effort, maximum impact
Accessible design: Minimum effort, maximum impact
 
1029 - Danh muc Sach Giao Khoa 10 . pdf
1029 -  Danh muc Sach Giao Khoa 10 . pdf1029 -  Danh muc Sach Giao Khoa 10 . pdf
1029 - Danh muc Sach Giao Khoa 10 . pdf
 
Student login on Anyboli platform.helpin
Student login on Anyboli platform.helpinStudent login on Anyboli platform.helpin
Student login on Anyboli platform.helpin
 
Advanced Views - Calendar View in Odoo 17
Advanced Views - Calendar View in Odoo 17Advanced Views - Calendar View in Odoo 17
Advanced Views - Calendar View in Odoo 17
 
A Critique of the Proposed National Education Policy Reform
A Critique of the Proposed National Education Policy ReformA Critique of the Proposed National Education Policy Reform
A Critique of the Proposed National Education Policy Reform
 
The basics of sentences session 2pptx copy.pptx
The basics of sentences session 2pptx copy.pptxThe basics of sentences session 2pptx copy.pptx
The basics of sentences session 2pptx copy.pptx
 

6 sigma

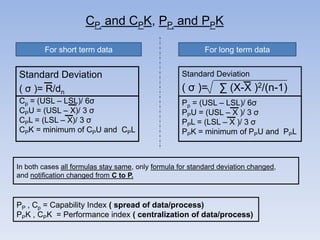
  • 1. CP, and CPK, PP, and PPK For short term data For long term data Standard Deviation ( σ )= R/dn Standard Deviation Cp = (USL – LSL)/ 6σ CPU = (USL – X)/ 3 σ CPL = (LSL – X)/ 3 σ CPK = minimum of CPU and CPL Pp = (USL – LSL)/ 6σ PPU = (USL – X )/ 3 σ PPL = (LSL – X )/ 3 σ PPK = minimum of PPU and PPL ( σ )= ∑ (X-X )2/(n-1) In both cases all formulas stay same, only formula for standard deviation changed, and notification changed from C to P. PP , Cp = Capability Index ( spread of data/process) PPK , CPK = Performance index ( centralization of data/process)
  • 2. All of 1st understand CP and CPK Graphically Upper specified limit CP LSL 14 12 10 8 6 4 2 0 CPU Center line Axis Title CPL USL Lower specified limit Desired location of data, centralized. good Cp K 1 2 3 4 5 6 7 8 9 1011121314151617181920 0 1 2 3 4 5 6 7 8 9 10111213141516171819 Axis Title All Data looks to be inside of this yellow curve, mean good spread of data. Mean good CP. But all data is not centralized, it is towards LSL , So we can get high number of rejections, mean – CPK is not good.
  • 3. To study, Cp, CpK, Pp , PpK you must know HISTOGRAM . If you don’t know , then 1st study it, and next 4-slides will explain it. And if you already know, then that’s great, just skip, next 4 -slides.
  • 4. HISTOGRAM     It is used to observe that , how is the process going. Or we can say, use to predict future performance of a process. Any change in process. It is simply a bar chart, from which we get, info of the process- how its going, it is in limits or not. 10 Lower limit Upper limit HISTOGRAM 8 6 4 Trend line 2 0 3 4 5 6 7 8 9 10 11 2 3 4 5 6 7 8 9 10
  • 5. How to build HISTOGRAM in Excel.(with example) 1.) 1st we have to Study/Collect specifications like -diameter (Data) for 24 products. 1 2 3 4 5 6 7 8 9 10 11 12 13 14 15 16 17 18 19 20 21 22 23 24 D DIA 6 5 7 10 9 8 4 7 5 6 7 7 8 6 8 7 5 7 8 6 7 7 8 8 2.) Calculate RANGE. RANGE= Maximum value - Minimum value So here , maximum value= 10, Minimum value = 4 So RANGE = 10- 4 =6 3.) Now decide the NUMBER OF CELLS. We have 24 data points , and it fall in 1st group , so- No of cells = 6 Data Points 20 -50 51-100 101-200 201-500 501-1000 Over 1000 Number of Cells 6 7 8 9 10 11-20 4.) Calculate the approximately cell width. Cell width= RANGE/ NO OF CELLS = 6/6 =1 5.) Round Off the cell width. If cell width come in a complicated manner, like 0.34, 0.89 or else , then round off it to , one you want, like : 0.50 or 1 or else.
  • 6. 6.) Now construct the Cell Groups with keep in mind cell width( cell width=1) 2 3 4 5 6 7 8 9 10 11 3 4 5 6 7 8 9 10 11 12 Cell width=1 Cell width same for all cell groups =1 7.) Now find number of data values/ Frequencies in each Cell Group. You can do this manually , by counting itself or by using formula .(frequency formula) Mean how many values fall in each group. A B C cell groups frequency 1 2 3 0 2 3 4 1 3 4 5 3 4 5 6 4 5 6 7 8 6 7 8 6 7 8 9 1 8 9 10 1 9 10 11 0 10 11 12 0 (D1:D24) values are on previous page) Go to yellow block, type, =frequency( D1:D24, B1:B10), and press Enter. Then select yellow block and all sky blue blocks, press F2, and press CTRL , SHIFT, ENTER. ( frequency formula will get implement in all sky blue blocks as in yellow block ) And you will get frequency of data values in each group, As in group (7 – 8) , frequency is 6.
  • 7. 8.) Now we got frequency data in each group, now we can build Histogram. frequency data is our final data. now select this data a build a bar chart. That’s it. 10 Frequency 8 6 4 2 0 3 4 5 6 7 8 9 10 11 2 3 4 5 6 7 8 9 10 Dia (mm) Group 4 - 5, show values from 4.1 to 5 Group 5 - 6, show values from 5.1 to 6 So this rule for all groups. Trend line – also give an visual idea of moving process.
  • 8. LETS FIND , CP, AND CPK FOR SHORT TERM DATA. sample lot 2 1 2 3 4 5 1 5.5 5.1 5 5.2 5.4 3 5.4 5 5.1 5.3 5.4 4 5.2 5.2 5.4 5.5 5.4 5 5.1 5 5 5.1 5.1 6 7 5.1 5.4 5.2 5 5 5 5.2 5.5 5.5 5 8 5.5 5.1 5 5.4 5.2 5 5 5.5 5.1 5.2 Range(R ) 0.5 0.5 0.4 0.3 0.1 0.5 0.5 0.5 0.5 0.1 sample sample sample sample sample 5 5 5 5.5 5.1 9 10 11 12 5 5.2 5.7 5.1 5.4 5 5.1 5 5.2 5 5.3 5.5 5 5.1 5.4 0.4 0.7 13 5.4 5 5.4 5.2 5.4 14 5.2 5.2 5 5 5.1 15 5.2 5 5 5.1 5.4 0.4 0.2 0.4 0.4 average R dn = 2.326 ( for 5 samples, from table 1.1, last slide) σ = R/dn = 0.17196 USL = 6.2, and LSL = 4.2 ( GIVEN) Data Points 20 -50 51-100 101-200 201-500 501-1000 Over 1000 Number of Cells 6 7 8 9 10 11-20
  • 9. RANGE = (max-min ) = 0.7 NUMBER OF CELLS = 7 CELL WIDTH = 0.7/7 = 0.1 ROUND OFF = 0.2 CELL GROUP frequency USL = 6.2, and LSL = 4.2 30 0 4 4.2 0 4.2 4.4 0 4.4 4.6 0 15 4.6 4.8 0 10 4.8 5 24 5 5.2 27 5.2 5.4 15 5.4 5.6 8 5.6 5.8 1 5.8 6 0 6 6.2 0 6.2 6.4 0 6.4 6.6 0 USL 4 LSL 3.8 25 20 standard deviation σ = R/dn = 0.171969046 5 0 4 4.2 4.4 4.6 4.8 5 5.2 5.4 5.6 5.8 6 6.2 6.4 6.6 3.8 4 4.2 4.4 4.6 4.8 5 5.2 5.4 5.6 5.8 6 6.2 6.4 • Cp = (USL – LSL)/ 6σ = 1.938333333 • • • CPU = (USL – X)/ 3 σ = 1.957716667 CPL = (LSL – X)/ 3 σ = 1.91895 CPK = minimum of CPU and CPL = 1.9188
  • 10. Lets find Pp and PpK for long term data 1 2 3 4 5 6 7 8 9 10 11 12 13 14 15 16 17 18 19 20 SUM AVERAGE X 5.5 5.1 5 5.2 5.4 5 5 5 5.5 5.1 5.4 5 5.1 5.3 5.4 5.2 5.2 5.4 5.5 5.4 104.7 5.235 (X - X ) (X - X )2 -0.26 0.07022 0.135 0.01823 0.235 0.05523 0.035 0.00123 -0.16 0.02722 0.235 0.05523 0.235 0.05523 0.235 0.05523 -0.26 0.07022 0.135 0.01823 -0.16 0.02722 0.235 0.05523 0.135 0.01823 -0.06 0.00422 -0.16 0.02722 0.035 0.00123 0.035 0.00123 -0.16 0.02722 -0.26 0.07022 -0.16 0.02722 0.6855 ∑(X-X )2 Standard Deviation ( σ )= ∑ (X-X )2/(n-1) Data Points 20 -50 51-100 101-200 201-500 501-1000 Over 1000 = 0.6855/(20-1) = 0.1899 Number of Cells 6 7 8 9 10 11-20
  • 11. Range = (max – min ) = 0.5 Number of cells = 6 Cell width = 0.5/6 = 0.08 Round off cell width = 0.2 USL= 6.2 , LSL= 4.2 (GIVEN) cell group frequency 0 0 0 0 5 6 6 3 0 0 0 0 0 7 6 5 USL 4.2 4.4 4.6 4.8 5 5.2 5.4 5.6 5.8 6 6.2 6.4 6.6 LSL 4 4.2 4.4 4.6 4.8 5 5.2 5.4 5.6 5.8 6 6.2 6.4 4 3 2 1 0 4.2 4.4 4.6 4.8 5 5.2 5.4 5.6 5.8 6 6.2 6.4 6.6 4 4.2 4.4 4.6 4.8 5 5.2 5.4 5.6 5.8 6 6.2 6.4 Standard Deviation ( σ )= ∑ (X-X )2/(n-1) = 0.6855/(20-1) = 0.1899 Pp = (USL – LSL)/ 6σ = 1.75 PPU = (USL – X )/ 3 σ = 1.69 PPL = (LSL – X )/ 3 σ = 1.81 PPK = minimum of PPU and PPL = 1.81
  • 12. CP 0.5 0.75 1 1.1 1.2 1.3 1.4 1.5 1.6 1.7 1.8 1.9 2 Ppk CPK PPM 0 0.1 0.2 0.3 0.4 0.5 0.6 0.7 0.8 0.9 1 1.1 1.2 1.3 1.4 1.5 1.6 1.7 1.8 1.9 2 133,614 24,449 2,700 967 318 96 27 7 2 0.34 0.067 0.012 0.0018 PPM – Parts rejected Per Million PPM PPM 500,000 382,089 274,253 184,060 115,070 66,807 35,930 17,864 8,198 3,467 1,350 483 159 48 13 3 1 0.170 0.033 0.006 0.001
  • 13. Table 1.1 X-bar Chart Sample Size = N for sigma R Chart Constants LCL UPL S Chart Constants LCL UCL A2 A3 dn D3 D4 B3 B4 2 3 4 1.88 1.023 0.729 2.659 1.954 1.628 1.128 1.693 2.059 0 0 0 3.267 2.574 2.282 0 0 0 3.267 2.568 2.266 5 0.577 1.427 2.326 0 2.114 0 2.089 6 7 8 9 10 11 12 13 14 15 16 17 18 19 20 21 22 23 24 25 0.483 0.419 0.373 0.337 0.308 0.285 0.266 0.249 0.235 0.223 0.212 0.203 0.194 0.187 0.18 0.173 0.167 0.162 0.157 0.153 1.287 1.182 1.099 1.032 0.975 0.927 0.886 0.85 0.817 0.789 0.763 0.739 0.718 0.698 0.68 0.663 0.647 0.633 0.619 0.606 2.534 2.704 2.847 2.97 3.078 3.173 3.258 3.336 3.407 3.472 3.532 3.588 3.64 3.689 3.735 3.778 3.819 3.858 3.895 3.931 0 0.076 0.136 0.184 0.223 0.256 0.283 0.307 0.328 0.347 0.363 0.378 0.391 0.403 0.415 0.425 0.434 0.443 0.451 0.459 2.004 1.924 1.864 1.816 1.777 1.744 1.717 1.693 1.672 1.653 1.637 1.622 1.608 1.597 1.585 1.575 1.566 1.557 1.548 1.541 0.03 0.118 0.185 0.239 0.284 0.321 0.354 0.382 0.406 0.428 0.448 0.466 0.482 0.497 0.51 0.523 0.534 0.545 0.555 0.565 1.97 1.882 1.815 1.761 1.716 1.679 1.646 1.618 1.594 1.572 1.552 1.534 1.518 1.503 1.49 1.477 1.466 1.455 1.445 1.435
  • 14. • That’s it . • I Hope you got it. • Have any question, please let me know.