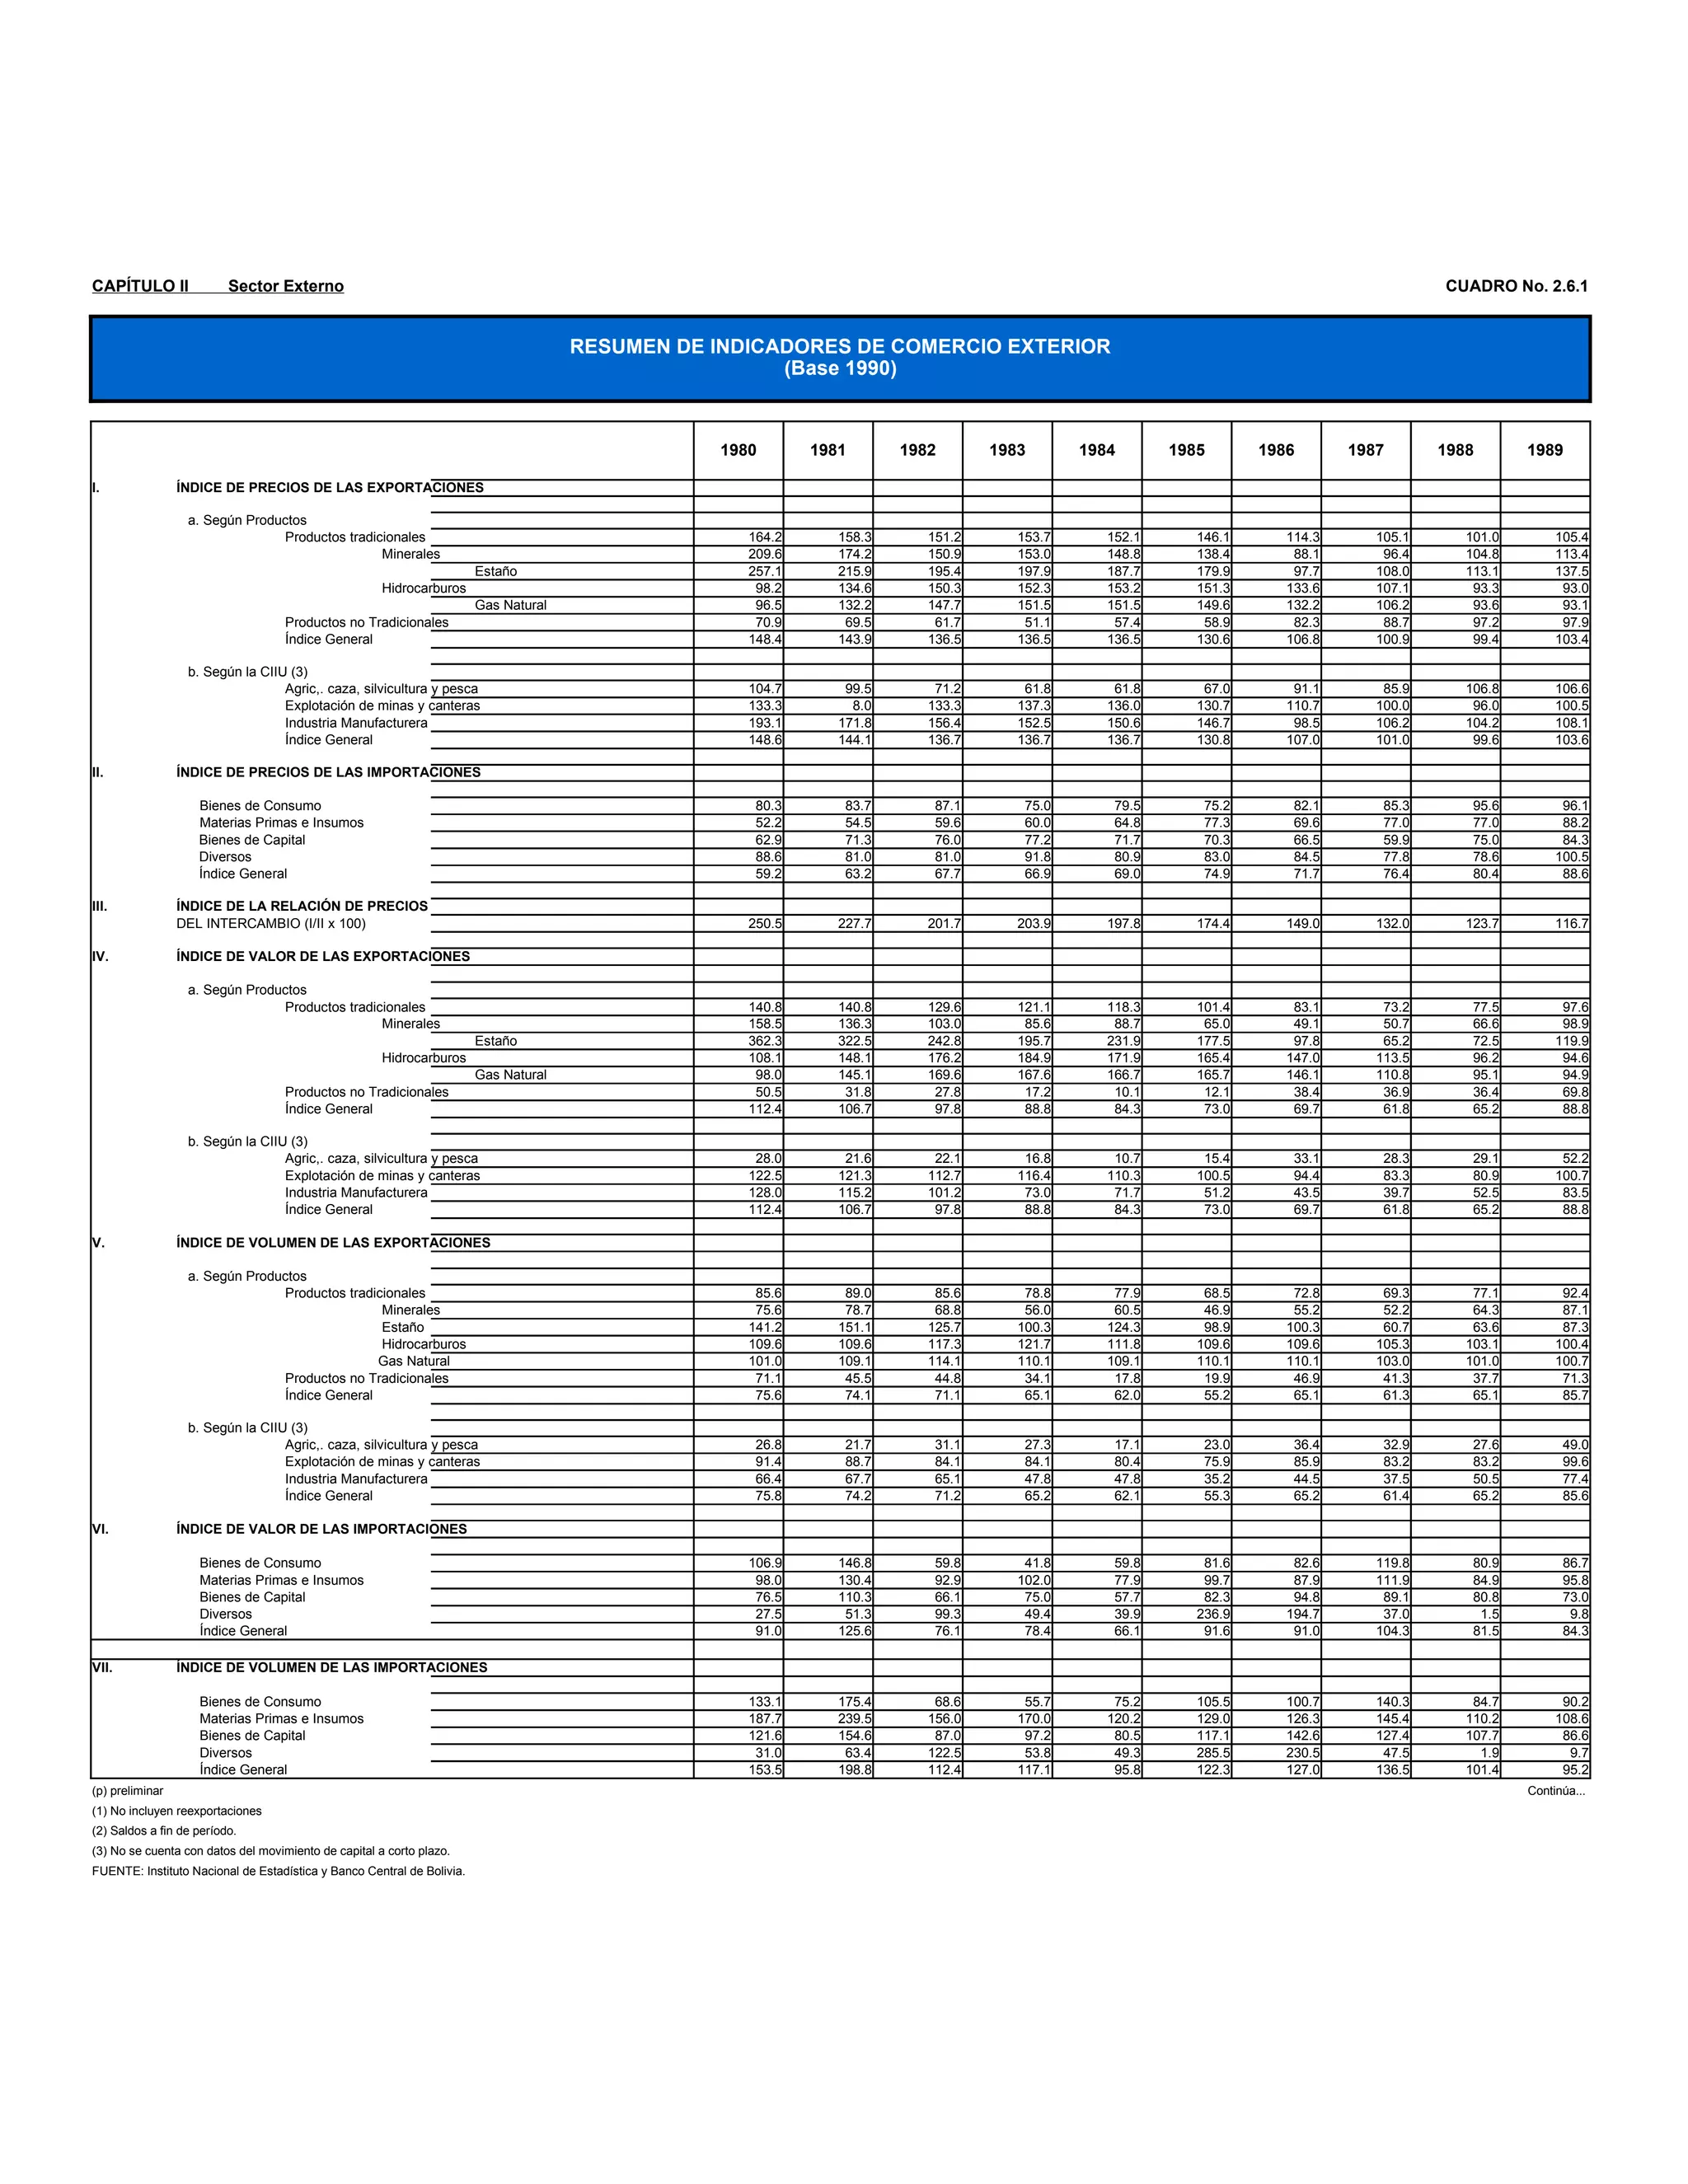
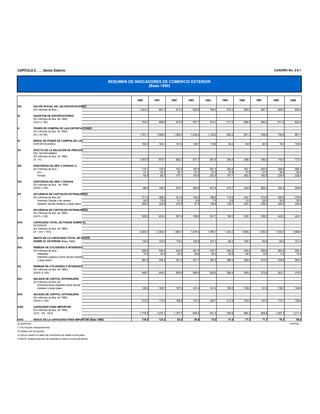
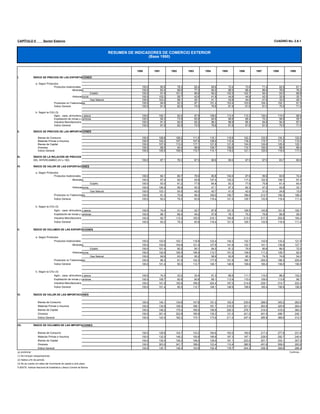
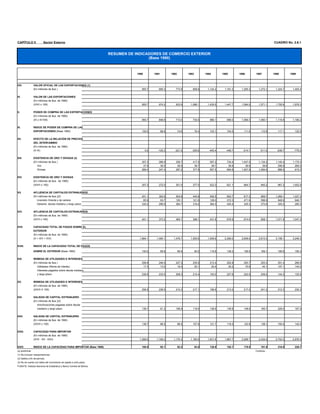
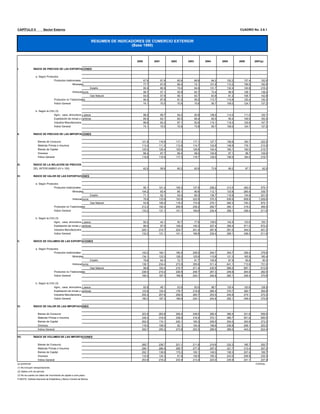
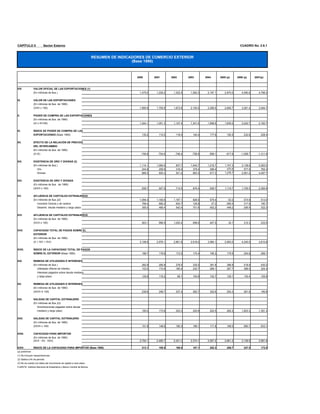
SlideShare una empresa de Scribd logo
1 de 6
CAPÍTULO II               Sector Externo                                                                                                                                                 CUADRO No. 2.6.1


                                                                                      RESUMEN DE INDICADORES DE COMERCIO EXTERIOR
                                                                                                       (Base 1990)


                                                                                                 1980       1981       1982       1983       1984       1985       1986       1987       1988       1989

I.               ÍNDICE DE PRECIOS DE LAS EXPORTACIONES

                  a. Según Productos
                                Productos tradicionales                                             164.2      158.3      151.2      153.7      152.1      146.1      114.3      105.1      101.0        105.4
                                                Minerales                                           209.6      174.2      150.9      153.0      148.8      138.4       88.1       96.4      104.8        113.4
                                                                        Estaño                      257.1      215.9      195.4      197.9      187.7      179.9       97.7      108.0      113.1        137.5
                                                      Hidrocarburos                                  98.2      134.6      150.3      152.3      153.2      151.3      133.6      107.1       93.3         93.0
                                                                        Gas Natural                  96.5      132.2      147.7      151.5      151.5      149.6      132.2      106.2       93.6         93.1
                                    Productos no Tradicionales                                       70.9       69.5       61.7       51.1       57.4       58.9       82.3       88.7       97.2         97.9
                                    Índice General                                                  148.4      143.9      136.5      136.5      136.5      130.6      106.8      100.9       99.4        103.4

                  b. Según la CIIU (3)
                                  Agric,. caza, silvicultura y pesca                                104.7       99.5       71.2       61.8       61.8       67.0       91.1       85.9      106.8        106.6
                                  Explotación de minas y canteras                                   133.3        8.0      133.3      137.3      136.0      130.7      110.7      100.0       96.0        100.5
                                  Industria Manufacturera                                           193.1      171.8      156.4      152.5      150.6      146.7       98.5      106.2      104.2        108.1
                                  Índice General                                                    148.6      144.1      136.7      136.7      136.7      130.8      107.0      101.0       99.6        103.6

II.              ÍNDICE DE PRECIOS DE LAS IMPORTACIONES

                    Bienes de Consumo                                                                80.3       83.7       87.1       75.0       79.5       75.2       82.1       85.3       95.6         96.1
                    Materias Primas e Insumos                                                        52.2       54.5       59.6       60.0       64.8       77.3       69.6       77.0       77.0         88.2
                    Bienes de Capital                                                                62.9       71.3       76.0       77.2       71.7       70.3       66.5       59.9       75.0         84.3
                    Diversos                                                                         88.6       81.0       81.0       91.8       80.9       83.0       84.5       77.8       78.6        100.5
                    Índice General                                                                   59.2       63.2       67.7       66.9       69.0       74.9       71.7       76.4       80.4         88.6

III.             ÍNDICE DE LA RELACIÓN DE PRECIOS
                 DEL INTERCAMBIO (I/II x 100)                                                       250.5      227.7      201.7      203.9      197.8      174.4      149.0      132.0      123.7        116.7

IV.              ÍNDICE DE VALOR DE LAS EXPORTACIONES

                  a. Según Productos
                                Productos tradicionales                                             140.8      140.8      129.6      121.1      118.3      101.4       83.1       73.2       77.5         97.6
                                                Minerales                                           158.5      136.3      103.0       85.6       88.7       65.0       49.1       50.7       66.6         98.9
                                                                        Estaño                      362.3      322.5      242.8      195.7      231.9      177.5       97.8       65.2       72.5        119.9
                                                      Hidrocarburos                                 108.1      148.1      176.2      184.9      171.9      165.4      147.0      113.5       96.2         94.6
                                                                        Gas Natural                  98.0      145.1      169.6      167.6      166.7      165.7      146.1      110.8       95.1         94.9
                                    Productos no Tradicionales                                       50.5       31.8       27.8       17.2       10.1       12.1       38.4       36.9       36.4         69.8
                                    Índice General                                                  112.4      106.7       97.8       88.8       84.3       73.0       69.7       61.8       65.2         88.8

                  b. Según la CIIU (3)
                                  Agric,. caza, silvicultura y pesca                                 28.0       21.6       22.1       16.8       10.7       15.4       33.1       28.3       29.1         52.2
                                  Explotación de minas y canteras                                   122.5      121.3      112.7      116.4      110.3      100.5       94.4       83.3       80.9        100.7
                                  Industria Manufacturera                                           128.0      115.2      101.2       73.0       71.7       51.2       43.5       39.7       52.5         83.5
                                  Índice General                                                    112.4      106.7       97.8       88.8       84.3       73.0       69.7       61.8       65.2         88.8

V.               ÍNDICE DE VOLUMEN DE LAS EXPORTACIONES

                  a. Según Productos
                                Productos tradicionales                                              85.6       89.0       85.6       78.8       77.9       68.5       72.8       69.3       77.1         92.4
                                                Minerales                                            75.6       78.7       68.8       56.0       60.5       46.9       55.2       52.2       64.3         87.1
                                                Estaño                                              141.2      151.1      125.7      100.3      124.3       98.9      100.3       60.7       63.6         87.3
                                                Hidrocarburos                                       109.6      109.6      117.3      121.7      111.8      109.6      109.6      105.3      103.1        100.4
                                               Gas Natural                                          101.0      109.1      114.1      110.1      109.1      110.1      110.1      103.0      101.0        100.7
                                Productos no Tradicionales                                           71.1       45.5       44.8       34.1       17.8       19.9       46.9       41.3       37.7         71.3
                                Índice General                                                       75.6       74.1       71.1       65.1       62.0       55.2       65.1       61.3       65.1         85.7

                  b. Según la CIIU (3)
                                  Agric,. caza, silvicultura y pesca                                 26.8       21.7       31.1       27.3       17.1       23.0       36.4       32.9       27.6         49.0
                                  Explotación de minas y canteras                                    91.4       88.7       84.1       84.1       80.4       75.9       85.9       83.2       83.2         99.6
                                  Industria Manufacturera                                            66.4       67.7       65.1       47.8       47.8       35.2       44.5       37.5       50.5         77.4
                                  Índice General                                                     75.8       74.2       71.2       65.2       62.1       55.3       65.2       61.4       65.2         85.6

VI.              ÍNDICE DE VALOR DE LAS IMPORTACIONES

                    Bienes de Consumo                                                               106.9      146.8       59.8       41.8       59.8       81.6       82.6      119.8       80.9         86.7
                    Materias Primas e Insumos                                                        98.0      130.4       92.9      102.0       77.9       99.7       87.9      111.9       84.9         95.8
                    Bienes de Capital                                                                76.5      110.3       66.1       75.0       57.7       82.3       94.8       89.1       80.8         73.0
                    Diversos                                                                         27.5       51.3       99.3       49.4       39.9      236.9      194.7       37.0        1.5          9.8
                    Índice General                                                                   91.0      125.6       76.1       78.4       66.1       91.6       91.0      104.3       81.5         84.3

VII.             ÍNDICE DE VOLUMEN DE LAS IMPORTACIONES

                    Bienes de Consumo                                                               133.1      175.4       68.6       55.7       75.2      105.5      100.7      140.3       84.7         90.2
                    Materias Primas e Insumos                                                       187.7      239.5      156.0      170.0      120.2      129.0      126.3      145.4      110.2        108.6
                    Bienes de Capital                                                               121.6      154.6       87.0       97.2       80.5      117.1      142.6      127.4      107.7         86.6
                    Diversos                                                                         31.0       63.4      122.5       53.8       49.3      285.5      230.5       47.5        1.9          9.7
                    Índice General                                                                  153.5      198.8      112.4      117.1       95.8      122.3      127.0      136.5      101.4         95.2
(p) preliminar                                                                                                                                                                                      Continúa...
(1) No incluyen reexportaciones
(2) Saldos a fin de período.
(3) No se cuenta con datos del movimiento de capital a corto plazo.
FUENTE: Instituto Nacional de Estadística y Banco Central de Bolivia.
CAPÍTULO II               Sector Externo                                                                                                                                                      CUADRO No. 2.6.1


                                                                        RESUMEN DE INDICADORES DE COMERCIO EXTERIOR
                                                                                         (Base 1990)


                                                                                    1980       1981       1982          1983          1984          1985          1986          1987          1988          1989

VIII.            VALOR OFICIAL DE LAS EXPORTACIONES
                 (En millones de $us.)                                               1,043.3      991.3      917.2         829.5         784.0         675.3         650.5         587.7         608.2           852.4

IX.              QUANTUM DE EXPORTACIONES
                 (En millones de $us. de 1990)
                 (VIII/I x 100)                                                        703.2      688.8      672.0         607.7         574.3         517.2         608.9         582.5         611.9           824.2

X.               PODER DE COMPRA DE LAS EXPORTACIONES
                 (En millones de $us. de 1990)
                 (IX x III/100)                                                      1,761.1    1,568.5    1,355.2       1,239.4       1,136.2         902.2         907.3         768.9         756.8           961.7

XI.              ÍNDICE DE PODER DE COMPRA DE LAS
                 EXPORTACIONES                                                         184.3      164.1      141.8         129.7         118.9             94.4          94.9          80.5          79.2        100.6

XII.             EFECTO DE LA RELACIÓN DE PRECIOS
                 DEL INTERCAMBIO
                 (En millones de $us. de 1990)
                 (X - IX)                                                            1,057.9      879.7      683.3         631.7         561.8         385.0         298.4         186.3         144.9           137.5

XIII.            EXISTENCIA DE ORO Y DIVISAS (1)
                 (En millones de $us.)                                                 116.1      123.5      183.2         187.8         281.4         204.9         303.1         200.5         268.6           266.4
                    Oro                                                                 31.2       34.2       36.1          37.0          37.9          37.8          37.8          37.9          38.0            38.0
                    Divisas                                                             84.9       89.3      147.1         150.8         243.5         167.1         265.3         162.6         230.6           228.4

XIV.             EXISTENCIA DE ORO Y DIVISAS
                 (En millones de $us. de 1990)
                 (XIII/II x 100)                                                       196.0      195.4      270.7         280.6         407.8         273.7         422.8         262.3         334.2           300.6

XV.              AFLUENCIA DE CAPITALES EXTRANJEROS
                 (En millones de $us.)(2)                                              311.8      398.4      241.9         104.8         166.8         118.5         243.1         274.6         355.6           375.9
                    Inversión Directa y de cartera                                      46.5       75.6       31.0           6.9           7.0           9.8          13.0          36.4          30.0            35.0
                    Desemb. deuda mediano y largo plazo                                265.3      322.8      210.9          97.9         159.8         108.7         230.1         238.2         325.6           340.9

XVI.             AFLUENCIA DE CAPITALES EXTRANJEROS
                 (En millones de $us. de 1990)
                 (XV/II x 100)                                                         526.3      630.4      357.4         156.6         241.7         158.3         339.1         359.2         442.5           424.1

XVII.            CAPACIDAD TOTAL DE PAGOS SOBRE EL
                 EXTERIOR
                 (En millones de $us. de 1990)
                 (X + XIV + XVI)                                                     2,483.4    2,394.3    1,983.3       1,676.5       1,785.7       1,334.3       1,669.2       1,390.4       1,533.5         1,686.4

XVIII.           ÍNDICE DE LA CAPACIDAD TOTAL DE PAGOS
                 SOBRE EL EXTERIOR (Base 1990)                                         149.2      143.9      119.2         100.8         107.3             80.2      100.3             83.6          92.2        101.3

XIX.             REMESA DE UTILIDADES E INTERESES
                 (En millones de $us.)                                                 296.0      408.4      444.5         461.5         433.7         442.2         354.9         285.6         283.8           280.3
                    Utilidades                                                          15.0       30.0       23.5          59.8          36.2          52.8          46.0          12.6           5.2            15.0
                    Intereses pagados sobre deuda mediano
                    y largo plazo.                                                     281.0      378.4      421.0         401.7         397.5         389.4         308.9         273.0         278.6           265.3

XX.              REMESA DE UTILIDADES E INTERESES
                 (En millones de $us. de 1990)
                 (XIX/II X 100)                                                        499.7      646.2      656.8         689.5         628.6         590.8         495.0         373.6         353.1           316.3

XXI.             SALIDAS DE CAPITAL EXTRANJERO
                 (En millones de $us.)(3)
                    Amortizaciones pagadas sobre deuda
                    mediano y largo plazo                                              126.3      108.7      107.5         101.4         141.9         159.3         139.0             81.8      139.1           140.6

XXII.            SALIDAS DE CAPITAL EXTRANJERO
                 (En millones de $us. de 1990)
                 (XXI/II x 100)                                                        213.2      172.0      158.8         151.5         205.7         212.8         193.9         107.0         173.1           158.6

XXIII.           CAPACIDAD PARA IMPORTAR
                 (En millones de $us. de 1990)
                 (XVII - XX - XXII)                                                  1,770.5    1,576.1    1,167.7         835.5         951.5         530.6         980.3         909.8       1,007.3         1,211.5

XXIV.            ÍNDICE DE LA CAPACIDAD PARA IMPORTAR (Base 1990)                      139.5      124.2          92.0          65.8          75.0          41.8          77.3          71.7          79.4          95.5
(p) preliminar                                                                                                                                                                                              Continúa...
(1) No incluyen reexportaciones
(2) Saldos a fin de período.
(3) No se cuenta con datos del movimiento de capital a corto plazo.
FUENTE: Instituto Nacional de Estadística y Banco Central de Bolivia.
CAPÍTULO II               Sector Externo                                                                                                                                                                       CUADRO No. 2.6.1


                                                                                      RESUMEN DE INDICADORES DE COMERCIO EXTERIOR
                                                                                                       (Base 1990)


                                                                                                  1990       1991          1992          1993          1994          1995          1996          1997          1998          1999

I.               ÍNDICE DE PRECIOS DE LAS EXPORTACIONES

                  a. Según Productos
                                Productos tradicionales                                              100.0       90.6          78.3             65.4       69.6          73.4          73.6          71.4          62.9             61.1
                                                Minerales                                            100.0       83.4          88.6             77.3       84.0          88.5          88.4          86.8          78.6             76.2
                                                                        Estaño                       100.0       91.8         101.2             86.6       90.2         102.5         102.7          94.0          93.0             88.8
                                                      Hidrocarburos                                  100.0      103.2          58.7             42.6       41.8          44.6          44.9          42.5          32.9             35.7
                                                                        Gas Natural                  100.0      103.2          58.1             42.1       41.1          43.8          44.0          41.6          33.0             29.1
                                    Productos no Tradicionales                                       100.0       94.8          93.3             97.1      101.2         103.4         103.6         104.3         102.1             91.5
                                    Índice General                                                   100.0       91.9          82.9             74.5       78.6          81.6          81.8          81.0          75.5             71.0

                  b. Según la CIIU (3)
                                  Agric,. caza, silvicultura y pesca                                 100.0      100.1             93.4          97.9      108.0         113.4         113.3         130.4         115.0             98.5
                                  Explotación de minas y canteras                                    100.0       90.3             73.9          60.9       64.6          68.6          68.4          70.3          58.9             59.7
                                  Industria Manufacturera                                            100.0       91.3             94.0          92.2       96.3          98.9          99.3          94.8          94.5             87.0
                                  Índice General                                                     100.0       91.9             82.9          74.5       78.6          81.6          81.8          81.0          75.5             71.0

II.              ÍNDICE DE PRECIOS DE LAS IMPORTACIONES

                    Bienes de Consumo                                                                100.0      108.8         108.2         111.0         116.1         118.6         122.3         123.5         124.3           122.5
                    Materias Primas e Insumos                                                        100.0      102.2         107.3         107.9         109.0         115.4         118.2         115.7         111.2           110.0
                    Bienes de Capital                                                                100.0      107.9         113.0         117.1         121.6         121.6         124.0         124.8         125.9           125.1
                    Diversos                                                                         100.0       99.5          94.5          98.9         109.7         109.6         110.7         100.0          88.9            86.4
                    Índice General                                                                   100.0      105.5         108.5         110.7         114.1         118.2         121.1         120.0         118.4           117.2

III.             ÍNDICE DE LA RELACIÓN DE PRECIOS
                 DEL INTERCAMBIO (I/II x 100)                                                        100.0          87.1          76.3          67.3          68.9          69.0          67.5          67.5          63.7          60.6

IV.              ÍNDICE DE VALOR DE LAS EXPORTACIONES

                  a. Según Productos
                                Productos tradicionales                                              100.0          94.1          80.7          76.5       85.8         104.5          97.6          95.6          83.8             74.4
                                                Minerales                                            100.0          87.4          92.9          93.8      107.4         125.2         117.2         122.5         106.7             97.4
                                                                        Estaño                       100.0          93.0          91.2          77.9       84.8          83.3          77.6          75.8          61.4             64.4
                                                      Hidrocarburos                                  100.0      106.2             58.9          45.3       47.1          67.3          62.3          47.2          42.6            33.1
                                                                        Gas Natural                  100.0      103.1             54.5          40.0       40.7          41.0          42.0          31.0          24.6            15.8
                                    Productos no Tradicionales                                       100.0       91.3             75.6          99.3      180.0         156.7         196.6         213.7         190.3           188.2
                                    Índice General                                                   100.0       93.2             79.2          83.9      116.4         121.5         129.7         133.9         118.4           111.4

                  b. Según la CIIU (3)
                                  Agric,. caza, silvicultura y pesca                                 100.0          74.4       31.0          32.7          87.8         101.5         126.5         143.8         101.4           100.7
                                  Explotación de minas y canteras                                    100.0          98.1       68.4          49.2          57.6          78.1          75.2          76.6          66.9            59.5
                                  Industria Manufacturera                                            100.0          92.7      113.3         155.5         216.1         194.8         213.5         217.2         202.8           194.2
                                  Índice General                                                     100.0          93.2       79.2          83.9         116.4         121.5         129.7         133.9         118.4           111.4

V.               ÍNDICE DE VOLUMEN DE LAS EXPORTACIONES

                  a. Según Productos
                                Productos tradicionales                                              100.0      103.9         103.1         116.9         123.4         142.3         132.7         133.9         133.2           121.9
                                                      Minerales                                      100.0      104.8         104.8         121.4         127.9         141.6         132.7         141.1         135.8           127.7
                                                                        Estaño                       100.0      101.4          90.2          90.1          94.0          81.2          75.5          80.6          66.0            72.5
                                                      Hidrocarburos                                  100.0      102.9         100.5         106.4         112.7         151.0         139.0         111.2         129.7            92.9
                                                                        Gas Natural                  100.0       99.9          93.8          95.2          98.9          93.6          95.3          74.5          74.6            54.2
                                    Productos no Tradicionales                                       100.0       96.3          81.0         102.3         177.9         151.6         189.7         205.0         186.3           205.6
                                    Índice General                                                   100.0      101.4             95.5      112.7         148.1         148.9         158.6         165.4         156.9           156.9

                  b. Según la CIIU (3)
                                  Agric,. caza, silvicultura y pesca                                 100.0       74.3             33.2          33.4          81.3       89.5         111.7         110.3          88.2           102.2
                                  Explotación de minas y canteras                                    100.0      108.7             92.6          80.8          89.1      113.9         110.0         109.0         113.6            99.7
                                    Industria Manufacturera                                          100.0      101.5         120.6         168.5         224.4         197.0         214.9         229.1         214.7           223.2
                                    Índice General                                                   100.0      101.4          95.5         112.7         148.1         148.9         158.6         165.4         156.9           156.9

VI.              ÍNDICE DE VALOR DE LAS IMPORTACIONES

                    Bienes de Consumo                                                                100.0      140.1         134.8         147.8         191.2         193.4         235.6         268.5         345.2           283.6
                    Materias Primas e Insumos                                                        100.0      134.9         159.0         168.1         181.7         216.0         221.0         263.9         325.6           264.4
                    Bienes de Capital                                                                100.0      146.2         175.4         185.0         156.9         220.3         276.7         314.0         419.2           384.2
                    Diversos                                                                         100.0      301.4         322.8         185.9         135.3         121.0         421.0         451.5         496.7           245.1
                    Índice General                                                                   100.0      142.5         162.2         170.1         173.9         211.2         247.4         285.9         366.6           312.3

VII.             ÍNDICE DE VOLUMEN DE LAS IMPORTACIONES

                    Bienes de Consumo                                                                100.0      128.8         124.7         133.2         164.6         163.0         192.6         217.4         277.8           231.6
                    Materias Primas e Insumos                                                        100.0      132.0         148.2         155.8         166.8         187.3         187.1         228.0         292.7           240.4
                    Bienes de Capital                                                                100.0      135.5         155.2         158.0         129.0         181.1         223.0         251.7         333.1           307.0
                    Diversos                                                                         100.0      303.0         341.7         188.0         123.4         110.4         380.5         451.6         559.0           283.6
                    Índice General                                                                   100.0      135.1         149.4         153.6         152.4         178.7         204.3         238.3         309.6           266.4
(p) preliminar                                                                                                                                                                                                               Continúa...
(1) No incluyen reexportaciones
(2) Saldos a fin de período.
(3) No se cuenta con datos del movimiento de capital a corto plazo.
FUENTE: Instituto Nacional de Estadística y Banco Central de Bolivia.
CAPÍTULO II               Sector Externo                                                                                                                                                  CUADRO No. 2.6.1


                                                                        RESUMEN DE INDICADORES DE COMERCIO EXTERIOR
                                                                                         (Base 1990)


                                                                                    1990         1991          1992          1993          1994       1995       1996       1997          1998       1999


VIII.            VALOR OFICIAL DE LAS EXPORTACIONES (1)
                 (En millones de $us.)                                                 955.7        895.3         773.8         808.9       1,124.2    1,181.2    1,295.3      1,272.1     1,324.7    1,405.4


IX.              VALOR DE LAS EXPORTACIONES
                 (En millones de $us. de 1990)
                 (VIII/I x 100)                                                        955.7        974.2         933.9       1,086.1       1,430.5    1,447.7    1,584.0      1,571.1     1,755.6    1,978.3

X.               PODER DE COMPRA DE LAS EXPORTACIONES
                 (En millones de $us. de 1990)
                 (IX x III/100)                                                        955.7        848.9         713.0         730.5         985.1      999.0    1,069.3      1,060.1     1,118.8    1,199.2

XI.              ÍNDICE DE PODER DE COMPRA DE LAS
                 EXPORTACIONES (Base 1990)                                             100.0            88.8          74.6          76.4      103.1      104.5      111.9        110.9       117.1      125.5

XII.             EFECTO DE LA RELACIÓN DE PRECIOS
                 DEL INTERCAMBIO
                 (En millones de $us. de 1990)
                 (X-IX)                                                                    0.0     -125.3        -221.0        -355.6        -445.4     -448.7     -514.7       -511.0      -636.7     -779.0

XIII.            EXISTENCIA DE ORO Y DIVISAS (2)
                 (En millones de $us.)                                                 307.3        286.9         326.7         417.5         597.2      734.4    1,047.5      1,134.2     1,145.4    1,175.3
                    Oro                                                                 37.9         39.5          39.5          39.7          39.7       39.6       39.6         39.6       256.9      260.0
                    Divisas                                                            269.4        247.4         287.2         377.8         557.5      694.8    1,007.9      1,094.6       888.5      915.3

XIV.             EXISTENCIA DE ORO Y DIVISAS
                 (En millones de $us. de 1990)
                 (XIII/II x 100)                                                       307.3        272.0         301.0         377.0         523.3      621.1      864.7        945.2       967.3    1,002.9

XV.              AFLUENCIA DE CAPITALES EXTRANJEROS
                 (En millones de $us.)(2)                                              401.1        393.6         504.8         440.8         492.5      802.7      817.2        969.7     1,269.1    1,227.2
                    Inversión Directa y de cartera                                      65.9         93.7         120.1         121.6         128.0      372.3      471.9        598.9       948.9      946.7
                    Desemb. deuda mediano y largo plazo                                335.2        299.9         384.7         319.2         364.5      430.4      345.3        370.8       320.2      280.5


XVI.             AFLUENCIA DE CAPITALES EXTRANJEROS
                 (En millones de $us. de 1990)
                 (XV/II x 100)                                                         401.1        373.2         465.1         398.1         431.6      678.9      674.6        808.1     1,071.9    1,047.2

XVII.            CAPACIDAD TOTAL DE PAGOS SOBRE EL
                 EXTERIOR
                 (En millones de $us. de 1990)
                 (X + XIV + XVI)                                                     1,664.1      1,494.1       1,479.1       1,505.6       1,939.9    2,299.0    2,608.6      2,813.3     3,158.1    3,249.3

XVIII.           ÍNDICE DE LA CAPACIDAD TOTAL DE PAGOS

                 SOBRE EL EXTERIOR (Base 1990)                                         100.0            89.8          88.9          90.5      116.6      138.2      156.8        169.1       189.8      195.3

XIX.             REMESA DE UTILIDADES E INTERESES
                 (En millones de $us.)                                                 256.8        246.5         227.3         235.5         213.4      252.8      293.7        253.3       251.4      269.9
                    Utilidades (Renta de Interés)                                       17.3         13.0          19.0          20.1          20.4       25.2       70.8         44.1       107.1      144.0
                    Intereses pagados sobre deuda mediano
                    y largo plazo.                                                     239.5        233.5         208.3         215.4         193.0      227.6      222.9        209.2       144.3      125.9

XX.              REMESA DE UTILIDADES E INTERESES
                 (En millones de $us. de 1990)
                 (XIX/II X 100)                                                        256.5        238.5         210.3         217.1         186.6      213.0      217.0        241.2       212.3      230.3


XXI.             SALIDAS DE CAPITAL EXTRANJERO
                 (En millones de $us.)(3)
                    Amortizaciones pagadas sobre deuda
                    mediano y largo plazo                                              138.7            91.2      106.9         119.5         138.9      139.9      148.9        165.7       229.0      167.0

XXII.            SALIDAS DE CAPITAL EXTRANJERO
                 (En millones de $us. de 1990)
                 (XXI/II x 100)                                                        138.7            86.5          98.5      107.9         121.7      118.3      122.9        138.1       193.4      142.5


XXIII.           CAPACIDAD PARA IMPORTAR
                 (En millones de $us. de 1990)
                 (XVII - XX - XXII)                                                  1,268.9      1,169.2       1,170.2       1,180.6       1,631.6    1,967.7    2,268.7      2,434.0     2,752.3    2,876.5

XXIV.            ÍNDICE DE LA CAPACIDAD PARA IMPORTAR (Base 1990)                      100.0            92.1          92.2          93.0      128.6      155.1      178.8        191.8       216.9      226.7
(p) preliminar                                                                                                                                                              Continúa...
(1) No incluyen reexportaciones
(2) Saldos a fin de período.
(3) No se cuenta con datos del movimiento de capital a corto plazo.
FUENTE: Instituto Nacional de Estadística y Banco Central de Bolivia.
CAPÍTULO II               Sector Externo                                                                                                                                       CUADRO No. 2.6.1


                                                                        RESUMEN DE INDICADORES DE COMERCIO EXTERIOR
                                                                                         (Base 1990)


                                                                                           2000          2001          2002          2003          2004          2005          2006          2007(p)

I.               ÍNDICE DE PRECIOS DE LAS EXPORTACIONES

                  a. Según Productos
                                Productos tradicionales                                           67.9          61.8          60.6          66.9       84.2         102.2         137.4           152.9
                                                Minerales                                         77.7          67.6          66.4          72.1      101.6         110.2         156.5           182.8
                                                                        Estaño                    90.4          80.9          74.4          84.9      131.7         132.4         140.8           216.2
                                                      Hidrocarburos                               56.7          57.1          55.9          62.7       73.4          98.5         128.1           138.2
                                                                        Gas Natural               54.5          57.9          56.1          63.7       63.9          81.2         108.7           142.8
                                    Productos no Tradicionales                                    90.4          87.8          91.3          95.0      113.7         115.8         120.4           130.3
                                    Índice General                                                74.1          70.0          70.6          75.8       95.7         108.0         124.7           137.2

                  b. Según la CIIU (3)
                                    Agric,. caza, silvicultura y pesca                            98.2          95.7          94.2          93.9      108.0         114.2         111.0           120.1
                                    Explotación de minas y canteras                               69.4          63.1          60.5          66.4       80.0          95.4         149.9           183.4
                                    Industria Manufacturera                                       86.6          83.3          87.1          92.6      115.1         118.3         125.6           147.7
                                    Índice General                                                74.1          70.0          70.6          75.8       95.7         108.0         124.7           137.2


II.              ÍNDICE DE PRECIOS DE LAS IMPORTACIONES

                    Bienes de Consumo                                                         121.8         118.9         117.3         117.1         127.7         156.6         183.7           222.5
                    Materias Primas e Insumos                                                 113.4         111.5         112.8         114.7         124.8         148.9         176.1           210.9
                    Bienes de Capital                                                         125.0         125.4         125.6         126.8         140.4         160.1         190.5           219.7
                    Diversos                                                                   88.4          87.7          89.4          98.0         100.6          97.1          98.7           109.5
                    Índice General                                                            118.6         116.9         117.3         118.7         129.5         156.0         184.0           219.7

III.             ÍNDICE DE LA RELACIÓN DE PRECIOS
                 DEL INTERCAMBIO (I/II x 100)                                                     62.5          59.9          60.2          63.9          73.9          69.2          67.7         62.5

IV.              ÍNDICE DE VALOR DE LAS EXPORTACIONES

                  a. Según Productos
                                Productos tradicionales                                           95.1      101.4         109.3         137.9         206.2         313.5         492.0           579.1
                                                      Minerales                               104.2          83.4          85.1          90.6         112.1         133.8         260.4           339.7
                                                                        Estaño                 71.1          52.1          54.0          69.3         136.7         116.9         134.9           201.0
                                                      Hidrocarburos                            78.9         133.9         152.8         222.9         375.3         636.6         908.6         1,009.6
                                                                        Gas Natural            53.9         106.2         118.2         172.9         275.1         482.3         740.3           875.1
                                    Productos no Tradicionales                                212.2         192.4         206.9         236.2         292.7         290.1         319.2           369.5
                                    Índice General                                            133.2         131.1         141.1         169.9         234.4         306.1         436.4           511.6

                  b. Según la CIIU (3)
                                  Agric,. caza, silvicultura y pesca                              92.2          44.1       50.7          77.9         109.0         142.4         133.6           155.1
                                  Explotación de minas y canteras                                 86.0          97.5      108.2         145.3         227.4         356.4         571.5           672.2
                                    Industria Manufacturera                                   220.1         214.7         224.7         241.4         291.8         291.0         344.5           401.2
                                    Índice General                                            133.2         131.1         141.1         169.9         234.4         306.1         436.4           511.6

V.               ÍNDICE DE VOLUMEN DE LAS EXPORTACIONES

                  a. Según Productos
                                Productos tradicionales                                       140.2         164.1         180.4         206.0         244.7         304.7         359.4           376.6
                                                Minerales                                     134.1         123.3         128.2         125.6         110.6         121.3         165.8           185.4
                                                                        Estaño                 78.6          64.3          72.7          81.7         105.6          87.9          95.6            90.4
                                                      Hidrocarburos                           139.1         234.4         273.5         355.6         511.4         641.1         713.8           731.0
                                                                        Gas Natural            98.8         183.4         210.7         271.4         430.5         589.2         687.1           613.6
                                    Productos no Tradicionales                                236.0         219.2         226.6         248.7         257.3         249.8         264.9           282.5
                                    Índice General                                            180.3         187.3         199.9         224.1         244.8         282.1         349.4           370.9

                  b. Según la CIIU (3)
                                    Agric,. caza, silvicultura y pesca                         93.9          46.1          53.9          83.0          98.7         125.4         120.6           128.5
                                    Explotación de minas y canteras                           123.9         154.4         178.7         218.9         284.4         370.7         382.7           364.8
                                    Industria Manufacturera                                   255.3         257.8         258.0         260.7         253.5         245.6         274.1           270.2
                                    Índice General                                            180.3         187.3         199.9         224.1         244.8         282.1         349.4           370.9


VI.              ÍNDICE DE VALOR DE LAS IMPORTACIONES

                    Bienes de Consumo                                                         323.5         283.8         259.4         248.0         280.4         366.4         341.8           559.5
                    Materias Primas e Insumos                                                 339.3         319.5         338.0         318.4         372.1         480.7         551.0           650.5
                    Bienes de Capital                                                         252.5         174.1         220.1         190.3         209.5         254.0         393.9           373.3
                    Diversos                                                                  118.0         109.0          82.1         124.4         166.6         236.8         206.1           253.2
                    Índice General                                                            300.7         255.2         273.8         253.3         289.5         369.0         443.2           523.4

VII.             ÍNDICE DE VOLUMEN DE LAS IMPORTACIONES

                    Bienes de Consumo                                                         265.7         238.7         221.1         211.8         219.6         232.3         185.7           250.7
                    Materias Primas e Insumos                                                 299.1         286.5         299.7         277.5         297.0         321.7         313.4           307.2
                    Bienes de Capital                                                         202.1         138.8         175.2         150.1         149.0         158.3         207.4           169.7
                    Diversos                                                                  133.6         124.3          91.9         126.9         165.3         243.5         208.9           230.3
                    Índice General                                                            253.6         218.2         233.4         213.4         223.0         235.6         241.1           237.4
(p) preliminar                                                                                                                                                                               Continúa...
(1) No incluyen reexportaciones
(2) Saldos a fin de período.
(3) No se cuenta con datos del movimiento de capital a corto plazo.
FUENTE: Instituto Nacional de Estadística y Banco Central de Bolivia.
CAPÍTULO II               Sector Externo                                                                                                                            CUADRO No. 2.6.1


                                                                        RESUMEN DE INDICADORES DE COMERCIO EXTERIOR
                                                                                         (Base 1990)


                                                                                           2000       2001       2002          2003       2004       2005 (p)     2006 (p)      2007(p)


VIII.            VALOR OFICIAL DE LAS EXPORTACIONES (1)
                 (En millones de $us.)                                                      1,475.0    1,229.2    1,322.5       1,592.3    2,197.1      2,870.0      4,090.6       4,796.3

IX.              VALOR DE LAS EXPORTACIONES
                 (En millones de $us. de 1990)
                 (VIII/I x 100)                                                             1,990.9    1,755.9    1,873.8       2,100.5    2,296.0      2,656.7      3,281.4       3,494.7

X.               PODER DE COMPRA DE LAS EXPORTACIONES
                 (En millones de $us. de 1990)
                 (IX x III/100)                                                             1,244.1    1,051.3    1,127.4       1,341.5    1,696.9      1,839.2      2,222.7       2,182.7


XI.              ÍNDICE DE PODER DE COMPRA DE LAS
                 EXPORTACIONES (Base 1990)                                                    130.2      110.0      118.0         140.4      177.6        192.5        232.6        228.4

XII.             EFECTO DE LA RELACIÓN DE PRECIOS
                 DEL INTERCAMBIO
                 (En millones de $us. de 1990)
                 (X-IX)                                                                      -746.8     -704.6     -746.4        -758.9     -599.1       -817.6      -1,058.7     -1,311.9

XIII.            EXISTENCIA DE ORO Y DIVISAS (2)
                 (En millones de $us.)                                                      1,114.1    1,084.9      837.7       1,042.7    1,216.7      1,747.3      3,138.8       5,262.0
                    Oro                                                                       244.8      259.6      316.4         379.4      399.4        470.6        577.6         764.3
                    Divisas                                                                   869.3      825.3      521.2         663.3      817.3      1,276.7      2,561.2       4,497.7

XIV.             EXISTENCIA DE ORO Y DIVISAS
                 (En millones de $us. de 1990)
                 (XIII/II x 100)                                                              939.7      927.9      714.0         878.4      939.7      1,119.7      1,705.5       2,394.6

XV.              AFLUENCIA DE CAPITALES EXTRANJEROS
                 (En millones de $us.)(2)                                                   1,094.4    1,165.6    1,197.1         828.5      579.4         53.2        574.8        513.0
                    Inversión Directa y de cartera                                            789.4      680.2      654.7         126.8       27.2       -395.0        317.8        190.7
                    Desemb. deuda mediano y largo plazo                                       305.0      485.4      542.4         701.6      552.2        448.2        256.9        322.3

XVI.             AFLUENCIA DE CAPITALES EXTRANJEROS
                 (En millones de $us. de 1990)
                 (XV/II x 100)                                                                923.1      996.9    1,020.4         698.0      447.5         34.1        312.3        233.5

XVII.            CAPACIDAD TOTAL DE PAGOS SOBRE EL
                 EXTERIOR
                 (En millones de $us. de 1990)
                 (X + XIV + XVI)                                                            3,106.9    2,976.1    2,861.8       2,918.0    3,084.1      2,993.0      4,240.5       4,810.8


XVIII.           ÍNDICE DE LA CAPACIDAD TOTAL DE PAGOS
                 SOBRE EL EXTERIOR (Base 1990)                                                186.7      178.8      172.0         175.4      185.3        179.9        254.8        289.1

XIX.             REMESA DE UTILIDADES E INTERESES
                 (En millones de $us.)                                                        282.9      290.8      278.5         335.5      391.8        396.9        518.9        430.3
                    Utilidades (Renta de Interés)                                             153.0      174.6      180.4         230.7      289.1        267.7        388.5        324.4
                    Intereses pagados sobre deuda mediano
                    y largo plazo.                                                            129.9      116.2          98.1      104.8      102.7        129.1        130.4        105.9


XX.              REMESA DE UTILIDADES E INTERESES
                 (En millones de $us. de 1990)
                 (XIX/II X 100)                                                               238.6      248.7      237.4         282.7      302.6        254.3        281.9        195.8

XXI.             SALIDAS DE CAPITAL EXTRANJERO
                 (En millones de $us.)(3)
                    Amortizaciones pagadas sobre deuda
                    mediano y largo plazo                                                     180.0      173.8      223.3         220.9      222.5        262.2      1,823.3       1,391.3

XXII.            SALIDAS DE CAPITAL EXTRANJERO
                 (En millones de $us. de 1990)
                 (XXI/II x 100)                                                               151.8      148.6      190.3         186.1      171.8        168.0        990.7        633.1

XXIII.           CAPACIDAD PARA IMPORTAR
                 (En millones de $us. de 1990)
                 (XVII - XX - XXII)                                                         2,704.1    2,485.7    2,421.3       2,374.1    2,567.2      2,661.2      3,139.9       3,981.9

XXIV.            ÍNDICE DE LA CAPACIDAD PARA IMPORTAR (Base 1990)                             213.1      195.9      190.8         187.1      202.3        209.7        247.5        172.0
(p) preliminar
(1) No incluyen reexportaciones
(2) Saldos a fin de período.
(3) No se cuenta con datos del movimiento de capital a corto plazo.
FUENTE: Instituto Nacional de Estadística y Banco Central de Bolivia.

Más contenido relacionado

Destacado

Daftar Nilai UTS Fisika SMK MITRA INDUSTRI MM2100
Daftar Nilai UTS Fisika SMK MITRA INDUSTRI MM2100Daftar Nilai UTS Fisika SMK MITRA INDUSTRI MM2100
Daftar Nilai UTS Fisika SMK MITRA INDUSTRI MM2100Taufik Awaludin
 
Schulkulturellen Wandel verstehen: 
Systeme, Akteure und Netzwerke
Schulkulturellen Wandel verstehen: 
Systeme,  Akteure und NetzwerkeSchulkulturellen Wandel verstehen: 
Systeme,  Akteure und Netzwerke
Schulkulturellen Wandel verstehen: 
Systeme, Akteure und NetzwerkeBenjamin Jörissen
 
Plan de accion_tutorial_con_las_familias
Plan de accion_tutorial_con_las_familiasPlan de accion_tutorial_con_las_familias
Plan de accion_tutorial_con_las_familiasRocio Castellanos
 
Propuesta web local publicidad
Propuesta web local publicidadPropuesta web local publicidad
Propuesta web local publicidadlocal publicidad
 
Progreso de la adecuación al Esquema Nacional de Seguridad, en la reunión de ...
Progreso de la adecuación al Esquema Nacional de Seguridad, en la reunión de ...Progreso de la adecuación al Esquema Nacional de Seguridad, en la reunión de ...
Progreso de la adecuación al Esquema Nacional de Seguridad, en la reunión de ...Miguel A. Amutio
 
Erdi ножницы по металу
Erdi ножницы по металуErdi ножницы по металу
Erdi ножницы по металуazovinstrument
 
e-learning im Unterricht Pinkafeld
e-learning im Unterricht Pinkafelde-learning im Unterricht Pinkafeld
e-learning im Unterricht PinkafeldMartin Sankofi
 
Presentacion de software libre y privado
Presentacion de software libre y privadoPresentacion de software libre y privado
Presentacion de software libre y privadozulibeth
 
Plantillainicial 120521181808-phpapp02
Plantillainicial 120521181808-phpapp02Plantillainicial 120521181808-phpapp02
Plantillainicial 120521181808-phpapp02Cindy Gonzalez
 
Projekt BAGS GPADJP
Projekt BAGS GPADJPProjekt BAGS GPADJP
Projekt BAGS GPADJPoegb
 

Destacado (17)

Propaganda
PropagandaPropaganda
Propaganda
 
Adrenalin Cup Sölden
Adrenalin Cup SöldenAdrenalin Cup Sölden
Adrenalin Cup Sölden
 
Daftar Nilai UTS Fisika SMK MITRA INDUSTRI MM2100
Daftar Nilai UTS Fisika SMK MITRA INDUSTRI MM2100Daftar Nilai UTS Fisika SMK MITRA INDUSTRI MM2100
Daftar Nilai UTS Fisika SMK MITRA INDUSTRI MM2100
 
Schulkulturellen Wandel verstehen: 
Systeme, Akteure und Netzwerke
Schulkulturellen Wandel verstehen: 
Systeme,  Akteure und NetzwerkeSchulkulturellen Wandel verstehen: 
Systeme,  Akteure und Netzwerke
Schulkulturellen Wandel verstehen: 
Systeme, Akteure und Netzwerke
 
Plan de accion_tutorial_con_las_familias
Plan de accion_tutorial_con_las_familiasPlan de accion_tutorial_con_las_familias
Plan de accion_tutorial_con_las_familias
 
Accion tu 1_
Accion tu 1_Accion tu 1_
Accion tu 1_
 
Propuesta web local publicidad
Propuesta web local publicidadPropuesta web local publicidad
Propuesta web local publicidad
 
Progreso de la adecuación al Esquema Nacional de Seguridad, en la reunión de ...
Progreso de la adecuación al Esquema Nacional de Seguridad, en la reunión de ...Progreso de la adecuación al Esquema Nacional de Seguridad, en la reunión de ...
Progreso de la adecuación al Esquema Nacional de Seguridad, en la reunión de ...
 
Erdi ножницы по металу
Erdi ножницы по металуErdi ножницы по металу
Erdi ножницы по металу
 
Erste Schritte - Vertreter
Erste Schritte - VertreterErste Schritte - Vertreter
Erste Schritte - Vertreter
 
e-learning im Unterricht Pinkafeld
e-learning im Unterricht Pinkafelde-learning im Unterricht Pinkafeld
e-learning im Unterricht Pinkafeld
 
Presentacion de software libre y privado
Presentacion de software libre y privadoPresentacion de software libre y privado
Presentacion de software libre y privado
 
Plantillainicial 120521181808-phpapp02
Plantillainicial 120521181808-phpapp02Plantillainicial 120521181808-phpapp02
Plantillainicial 120521181808-phpapp02
 
Manners Matter
Manners MatterManners Matter
Manners Matter
 
Metals
MetalsMetals
Metals
 
Projekt BAGS GPADJP
Projekt BAGS GPADJPProjekt BAGS GPADJP
Projekt BAGS GPADJP
 
Guerra del cenepa rodriguez
Guerra del cenepa rodriguezGuerra del cenepa rodriguez
Guerra del cenepa rodriguez
 

Similar a C02060155

Similar a C02060155 (20)

meteorología y climatología - precipitación
meteorología y climatología - precipitaciónmeteorología y climatología - precipitación
meteorología y climatología - precipitación
 
02 spnf 1990-2010 1(1)
02 spnf 1990-2010 1(1)02 spnf 1990-2010 1(1)
02 spnf 1990-2010 1(1)
 
Dr. arturo ortiz
Dr. arturo ortizDr. arturo ortiz
Dr. arturo ortiz
 
El salvador politica comercial jose luis montalvan m utec
El salvador politica comercial jose luis montalvan m utecEl salvador politica comercial jose luis montalvan m utec
El salvador politica comercial jose luis montalvan m utec
 
Indicador De Competitividad En Confeccion
Indicador De Competitividad En ConfeccionIndicador De Competitividad En Confeccion
Indicador De Competitividad En Confeccion
 
Insulquick
InsulquickInsulquick
Insulquick
 
Presentacion admon inventarios
Presentacion admon  inventariosPresentacion admon  inventarios
Presentacion admon inventarios
 
Utpl Petrocomercial Abastecedora
Utpl Petrocomercial AbastecedoraUtpl Petrocomercial Abastecedora
Utpl Petrocomercial Abastecedora
 
Boletin Sector Maderero Enero Mayo 2009
Boletin Sector Maderero Enero   Mayo 2009Boletin Sector Maderero Enero   Mayo 2009
Boletin Sector Maderero Enero Mayo 2009
 
PDUL Maracaibo - Tomo 13/14
PDUL Maracaibo - Tomo 13/14PDUL Maracaibo - Tomo 13/14
PDUL Maracaibo - Tomo 13/14
 
Cuadro general ind_cult_95_05
Cuadro general ind_cult_95_05Cuadro general ind_cult_95_05
Cuadro general ind_cult_95_05
 
Santos Ramirez Valverde
Santos  Ramirez  ValverdeSantos  Ramirez  Valverde
Santos Ramirez Valverde
 
5 Ejemplos de Histogramas
5 Ejemplos de Histogramas5 Ejemplos de Histogramas
5 Ejemplos de Histogramas
 
ejemplos
ejemplosejemplos
ejemplos
 
Ilif 2011
Ilif 2011Ilif 2011
Ilif 2011
 
Dec-4930-17-12-2009 Ajusteactivosyacciones
Dec-4930-17-12-2009 AjusteactivosyaccionesDec-4930-17-12-2009 Ajusteactivosyacciones
Dec-4930-17-12-2009 Ajusteactivosyacciones
 
Nandaime
NandaimeNandaime
Nandaime
 
Nandaime
NandaimeNandaime
Nandaime
 
Nandaime
NandaimeNandaime
Nandaime
 
Estudios hidrologicos-desague
Estudios hidrologicos-desagueEstudios hidrologicos-desague
Estudios hidrologicos-desague
 

Último

Lecciones 04 Esc. Sabática. Defendamos la verdad
Lecciones 04 Esc. Sabática. Defendamos la verdadLecciones 04 Esc. Sabática. Defendamos la verdad
Lecciones 04 Esc. Sabática. Defendamos la verdadAlejandrino Halire Ccahuana
 
PRIMER SEMESTRE 2024 ASAMBLEA DEPARTAMENTAL.pptx
PRIMER SEMESTRE 2024 ASAMBLEA DEPARTAMENTAL.pptxPRIMER SEMESTRE 2024 ASAMBLEA DEPARTAMENTAL.pptx
PRIMER SEMESTRE 2024 ASAMBLEA DEPARTAMENTAL.pptxinformacionasapespu
 
DE LAS OLIMPIADAS GRIEGAS A LAS DEL MUNDO MODERNO.ppt
DE LAS OLIMPIADAS GRIEGAS A LAS DEL MUNDO MODERNO.pptDE LAS OLIMPIADAS GRIEGAS A LAS DEL MUNDO MODERNO.ppt
DE LAS OLIMPIADAS GRIEGAS A LAS DEL MUNDO MODERNO.pptELENA GALLARDO PAÚLS
 
Resolucion de Problemas en Educacion Inicial 5 años ED-2024 Ccesa007.pdf
Resolucion de Problemas en Educacion Inicial 5 años ED-2024 Ccesa007.pdfResolucion de Problemas en Educacion Inicial 5 años ED-2024 Ccesa007.pdf
Resolucion de Problemas en Educacion Inicial 5 años ED-2024 Ccesa007.pdfDemetrio Ccesa Rayme
 
La Función tecnológica del tutor.pptx
La  Función  tecnológica  del tutor.pptxLa  Función  tecnológica  del tutor.pptx
La Función tecnológica del tutor.pptxJunkotantik
 
DECÁGOLO DEL GENERAL ELOY ALFARO DELGADO
DECÁGOLO DEL GENERAL ELOY ALFARO DELGADODECÁGOLO DEL GENERAL ELOY ALFARO DELGADO
DECÁGOLO DEL GENERAL ELOY ALFARO DELGADOJosé Luis Palma
 
Clasificaciones, modalidades y tendencias de investigación educativa.
Clasificaciones, modalidades y tendencias de investigación educativa.Clasificaciones, modalidades y tendencias de investigación educativa.
Clasificaciones, modalidades y tendencias de investigación educativa.José Luis Palma
 
Planificacion Anual 2do Grado Educacion Primaria 2024 Ccesa007.pdf
Planificacion Anual 2do Grado Educacion Primaria   2024   Ccesa007.pdfPlanificacion Anual 2do Grado Educacion Primaria   2024   Ccesa007.pdf
Planificacion Anual 2do Grado Educacion Primaria 2024 Ccesa007.pdfDemetrio Ccesa Rayme
 
RAIZ CUADRADA Y CUBICA PARA NIÑOS DE PRIMARIA
RAIZ CUADRADA Y CUBICA PARA NIÑOS DE PRIMARIARAIZ CUADRADA Y CUBICA PARA NIÑOS DE PRIMARIA
RAIZ CUADRADA Y CUBICA PARA NIÑOS DE PRIMARIACarlos Campaña Montenegro
 
Heinsohn Privacidad y Ciberseguridad para el sector educativo
Heinsohn Privacidad y Ciberseguridad para el sector educativoHeinsohn Privacidad y Ciberseguridad para el sector educativo
Heinsohn Privacidad y Ciberseguridad para el sector educativoFundación YOD YOD
 
cortes de luz abril 2024 en la provincia de tungurahua
cortes de luz abril 2024 en la provincia de tungurahuacortes de luz abril 2024 en la provincia de tungurahua
cortes de luz abril 2024 en la provincia de tungurahuaDANNYISAACCARVAJALGA
 
ACERTIJO DE LA BANDERA OLÍMPICA CON ECUACIONES DE LA CIRCUNFERENCIA. Por JAVI...
ACERTIJO DE LA BANDERA OLÍMPICA CON ECUACIONES DE LA CIRCUNFERENCIA. Por JAVI...ACERTIJO DE LA BANDERA OLÍMPICA CON ECUACIONES DE LA CIRCUNFERENCIA. Por JAVI...
ACERTIJO DE LA BANDERA OLÍMPICA CON ECUACIONES DE LA CIRCUNFERENCIA. Por JAVI...JAVIER SOLIS NOYOLA
 
CALENDARIZACION DE MAYO / RESPONSABILIDAD
CALENDARIZACION DE MAYO / RESPONSABILIDADCALENDARIZACION DE MAYO / RESPONSABILIDAD
CALENDARIZACION DE MAYO / RESPONSABILIDADauxsoporte
 
OLIMPIADA DEL CONOCIMIENTO INFANTIL 2024.pptx
OLIMPIADA DEL CONOCIMIENTO INFANTIL 2024.pptxOLIMPIADA DEL CONOCIMIENTO INFANTIL 2024.pptx
OLIMPIADA DEL CONOCIMIENTO INFANTIL 2024.pptxjosetrinidadchavez
 
ACUERDO MINISTERIAL 078-ORGANISMOS ESCOLARES..pptx
ACUERDO MINISTERIAL 078-ORGANISMOS ESCOLARES..pptxACUERDO MINISTERIAL 078-ORGANISMOS ESCOLARES..pptx
ACUERDO MINISTERIAL 078-ORGANISMOS ESCOLARES..pptxzulyvero07
 
La triple Naturaleza del Hombre estudio.
La triple Naturaleza del Hombre estudio.La triple Naturaleza del Hombre estudio.
La triple Naturaleza del Hombre estudio.amayarogel
 

Último (20)

Lecciones 04 Esc. Sabática. Defendamos la verdad
Lecciones 04 Esc. Sabática. Defendamos la verdadLecciones 04 Esc. Sabática. Defendamos la verdad
Lecciones 04 Esc. Sabática. Defendamos la verdad
 
PRIMER SEMESTRE 2024 ASAMBLEA DEPARTAMENTAL.pptx
PRIMER SEMESTRE 2024 ASAMBLEA DEPARTAMENTAL.pptxPRIMER SEMESTRE 2024 ASAMBLEA DEPARTAMENTAL.pptx
PRIMER SEMESTRE 2024 ASAMBLEA DEPARTAMENTAL.pptx
 
DE LAS OLIMPIADAS GRIEGAS A LAS DEL MUNDO MODERNO.ppt
DE LAS OLIMPIADAS GRIEGAS A LAS DEL MUNDO MODERNO.pptDE LAS OLIMPIADAS GRIEGAS A LAS DEL MUNDO MODERNO.ppt
DE LAS OLIMPIADAS GRIEGAS A LAS DEL MUNDO MODERNO.ppt
 
Resolucion de Problemas en Educacion Inicial 5 años ED-2024 Ccesa007.pdf
Resolucion de Problemas en Educacion Inicial 5 años ED-2024 Ccesa007.pdfResolucion de Problemas en Educacion Inicial 5 años ED-2024 Ccesa007.pdf
Resolucion de Problemas en Educacion Inicial 5 años ED-2024 Ccesa007.pdf
 
La Función tecnológica del tutor.pptx
La  Función  tecnológica  del tutor.pptxLa  Función  tecnológica  del tutor.pptx
La Función tecnológica del tutor.pptx
 
DECÁGOLO DEL GENERAL ELOY ALFARO DELGADO
DECÁGOLO DEL GENERAL ELOY ALFARO DELGADODECÁGOLO DEL GENERAL ELOY ALFARO DELGADO
DECÁGOLO DEL GENERAL ELOY ALFARO DELGADO
 
Clasificaciones, modalidades y tendencias de investigación educativa.
Clasificaciones, modalidades y tendencias de investigación educativa.Clasificaciones, modalidades y tendencias de investigación educativa.
Clasificaciones, modalidades y tendencias de investigación educativa.
 
Planificacion Anual 2do Grado Educacion Primaria 2024 Ccesa007.pdf
Planificacion Anual 2do Grado Educacion Primaria   2024   Ccesa007.pdfPlanificacion Anual 2do Grado Educacion Primaria   2024   Ccesa007.pdf
Planificacion Anual 2do Grado Educacion Primaria 2024 Ccesa007.pdf
 
RAIZ CUADRADA Y CUBICA PARA NIÑOS DE PRIMARIA
RAIZ CUADRADA Y CUBICA PARA NIÑOS DE PRIMARIARAIZ CUADRADA Y CUBICA PARA NIÑOS DE PRIMARIA
RAIZ CUADRADA Y CUBICA PARA NIÑOS DE PRIMARIA
 
Power Point: "Defendamos la verdad".pptx
Power Point: "Defendamos la verdad".pptxPower Point: "Defendamos la verdad".pptx
Power Point: "Defendamos la verdad".pptx
 
Repaso Pruebas CRECE PR 2024. Ciencia General
Repaso Pruebas CRECE PR 2024. Ciencia GeneralRepaso Pruebas CRECE PR 2024. Ciencia General
Repaso Pruebas CRECE PR 2024. Ciencia General
 
Defendamos la verdad. La defensa es importante.
Defendamos la verdad. La defensa es importante.Defendamos la verdad. La defensa es importante.
Defendamos la verdad. La defensa es importante.
 
Heinsohn Privacidad y Ciberseguridad para el sector educativo
Heinsohn Privacidad y Ciberseguridad para el sector educativoHeinsohn Privacidad y Ciberseguridad para el sector educativo
Heinsohn Privacidad y Ciberseguridad para el sector educativo
 
cortes de luz abril 2024 en la provincia de tungurahua
cortes de luz abril 2024 en la provincia de tungurahuacortes de luz abril 2024 en la provincia de tungurahua
cortes de luz abril 2024 en la provincia de tungurahua
 
ACERTIJO DE LA BANDERA OLÍMPICA CON ECUACIONES DE LA CIRCUNFERENCIA. Por JAVI...
ACERTIJO DE LA BANDERA OLÍMPICA CON ECUACIONES DE LA CIRCUNFERENCIA. Por JAVI...ACERTIJO DE LA BANDERA OLÍMPICA CON ECUACIONES DE LA CIRCUNFERENCIA. Por JAVI...
ACERTIJO DE LA BANDERA OLÍMPICA CON ECUACIONES DE LA CIRCUNFERENCIA. Por JAVI...
 
CALENDARIZACION DE MAYO / RESPONSABILIDAD
CALENDARIZACION DE MAYO / RESPONSABILIDADCALENDARIZACION DE MAYO / RESPONSABILIDAD
CALENDARIZACION DE MAYO / RESPONSABILIDAD
 
Presentacion Metodología de Enseñanza Multigrado
Presentacion Metodología de Enseñanza MultigradoPresentacion Metodología de Enseñanza Multigrado
Presentacion Metodología de Enseñanza Multigrado
 
OLIMPIADA DEL CONOCIMIENTO INFANTIL 2024.pptx
OLIMPIADA DEL CONOCIMIENTO INFANTIL 2024.pptxOLIMPIADA DEL CONOCIMIENTO INFANTIL 2024.pptx
OLIMPIADA DEL CONOCIMIENTO INFANTIL 2024.pptx
 
ACUERDO MINISTERIAL 078-ORGANISMOS ESCOLARES..pptx
ACUERDO MINISTERIAL 078-ORGANISMOS ESCOLARES..pptxACUERDO MINISTERIAL 078-ORGANISMOS ESCOLARES..pptx
ACUERDO MINISTERIAL 078-ORGANISMOS ESCOLARES..pptx
 
La triple Naturaleza del Hombre estudio.
La triple Naturaleza del Hombre estudio.La triple Naturaleza del Hombre estudio.
La triple Naturaleza del Hombre estudio.
 

C02060155

  • 1. CAPÍTULO II Sector Externo CUADRO No. 2.6.1 RESUMEN DE INDICADORES DE COMERCIO EXTERIOR (Base 1990) 1980 1981 1982 1983 1984 1985 1986 1987 1988 1989 I. ÍNDICE DE PRECIOS DE LAS EXPORTACIONES a. Según Productos Productos tradicionales 164.2 158.3 151.2 153.7 152.1 146.1 114.3 105.1 101.0 105.4 Minerales 209.6 174.2 150.9 153.0 148.8 138.4 88.1 96.4 104.8 113.4 Estaño 257.1 215.9 195.4 197.9 187.7 179.9 97.7 108.0 113.1 137.5 Hidrocarburos 98.2 134.6 150.3 152.3 153.2 151.3 133.6 107.1 93.3 93.0 Gas Natural 96.5 132.2 147.7 151.5 151.5 149.6 132.2 106.2 93.6 93.1 Productos no Tradicionales 70.9 69.5 61.7 51.1 57.4 58.9 82.3 88.7 97.2 97.9 Índice General 148.4 143.9 136.5 136.5 136.5 130.6 106.8 100.9 99.4 103.4 b. Según la CIIU (3) Agric,. caza, silvicultura y pesca 104.7 99.5 71.2 61.8 61.8 67.0 91.1 85.9 106.8 106.6 Explotación de minas y canteras 133.3 8.0 133.3 137.3 136.0 130.7 110.7 100.0 96.0 100.5 Industria Manufacturera 193.1 171.8 156.4 152.5 150.6 146.7 98.5 106.2 104.2 108.1 Índice General 148.6 144.1 136.7 136.7 136.7 130.8 107.0 101.0 99.6 103.6 II. ÍNDICE DE PRECIOS DE LAS IMPORTACIONES Bienes de Consumo 80.3 83.7 87.1 75.0 79.5 75.2 82.1 85.3 95.6 96.1 Materias Primas e Insumos 52.2 54.5 59.6 60.0 64.8 77.3 69.6 77.0 77.0 88.2 Bienes de Capital 62.9 71.3 76.0 77.2 71.7 70.3 66.5 59.9 75.0 84.3 Diversos 88.6 81.0 81.0 91.8 80.9 83.0 84.5 77.8 78.6 100.5 Índice General 59.2 63.2 67.7 66.9 69.0 74.9 71.7 76.4 80.4 88.6 III. ÍNDICE DE LA RELACIÓN DE PRECIOS DEL INTERCAMBIO (I/II x 100) 250.5 227.7 201.7 203.9 197.8 174.4 149.0 132.0 123.7 116.7 IV. ÍNDICE DE VALOR DE LAS EXPORTACIONES a. Según Productos Productos tradicionales 140.8 140.8 129.6 121.1 118.3 101.4 83.1 73.2 77.5 97.6 Minerales 158.5 136.3 103.0 85.6 88.7 65.0 49.1 50.7 66.6 98.9 Estaño 362.3 322.5 242.8 195.7 231.9 177.5 97.8 65.2 72.5 119.9 Hidrocarburos 108.1 148.1 176.2 184.9 171.9 165.4 147.0 113.5 96.2 94.6 Gas Natural 98.0 145.1 169.6 167.6 166.7 165.7 146.1 110.8 95.1 94.9 Productos no Tradicionales 50.5 31.8 27.8 17.2 10.1 12.1 38.4 36.9 36.4 69.8 Índice General 112.4 106.7 97.8 88.8 84.3 73.0 69.7 61.8 65.2 88.8 b. Según la CIIU (3) Agric,. caza, silvicultura y pesca 28.0 21.6 22.1 16.8 10.7 15.4 33.1 28.3 29.1 52.2 Explotación de minas y canteras 122.5 121.3 112.7 116.4 110.3 100.5 94.4 83.3 80.9 100.7 Industria Manufacturera 128.0 115.2 101.2 73.0 71.7 51.2 43.5 39.7 52.5 83.5 Índice General 112.4 106.7 97.8 88.8 84.3 73.0 69.7 61.8 65.2 88.8 V. ÍNDICE DE VOLUMEN DE LAS EXPORTACIONES a. Según Productos Productos tradicionales 85.6 89.0 85.6 78.8 77.9 68.5 72.8 69.3 77.1 92.4 Minerales 75.6 78.7 68.8 56.0 60.5 46.9 55.2 52.2 64.3 87.1 Estaño 141.2 151.1 125.7 100.3 124.3 98.9 100.3 60.7 63.6 87.3 Hidrocarburos 109.6 109.6 117.3 121.7 111.8 109.6 109.6 105.3 103.1 100.4 Gas Natural 101.0 109.1 114.1 110.1 109.1 110.1 110.1 103.0 101.0 100.7 Productos no Tradicionales 71.1 45.5 44.8 34.1 17.8 19.9 46.9 41.3 37.7 71.3 Índice General 75.6 74.1 71.1 65.1 62.0 55.2 65.1 61.3 65.1 85.7 b. Según la CIIU (3) Agric,. caza, silvicultura y pesca 26.8 21.7 31.1 27.3 17.1 23.0 36.4 32.9 27.6 49.0 Explotación de minas y canteras 91.4 88.7 84.1 84.1 80.4 75.9 85.9 83.2 83.2 99.6 Industria Manufacturera 66.4 67.7 65.1 47.8 47.8 35.2 44.5 37.5 50.5 77.4 Índice General 75.8 74.2 71.2 65.2 62.1 55.3 65.2 61.4 65.2 85.6 VI. ÍNDICE DE VALOR DE LAS IMPORTACIONES Bienes de Consumo 106.9 146.8 59.8 41.8 59.8 81.6 82.6 119.8 80.9 86.7 Materias Primas e Insumos 98.0 130.4 92.9 102.0 77.9 99.7 87.9 111.9 84.9 95.8 Bienes de Capital 76.5 110.3 66.1 75.0 57.7 82.3 94.8 89.1 80.8 73.0 Diversos 27.5 51.3 99.3 49.4 39.9 236.9 194.7 37.0 1.5 9.8 Índice General 91.0 125.6 76.1 78.4 66.1 91.6 91.0 104.3 81.5 84.3 VII. ÍNDICE DE VOLUMEN DE LAS IMPORTACIONES Bienes de Consumo 133.1 175.4 68.6 55.7 75.2 105.5 100.7 140.3 84.7 90.2 Materias Primas e Insumos 187.7 239.5 156.0 170.0 120.2 129.0 126.3 145.4 110.2 108.6 Bienes de Capital 121.6 154.6 87.0 97.2 80.5 117.1 142.6 127.4 107.7 86.6 Diversos 31.0 63.4 122.5 53.8 49.3 285.5 230.5 47.5 1.9 9.7 Índice General 153.5 198.8 112.4 117.1 95.8 122.3 127.0 136.5 101.4 95.2 (p) preliminar Continúa... (1) No incluyen reexportaciones (2) Saldos a fin de período. (3) No se cuenta con datos del movimiento de capital a corto plazo. FUENTE: Instituto Nacional de Estadística y Banco Central de Bolivia.
  • 2. CAPÍTULO II Sector Externo CUADRO No. 2.6.1 RESUMEN DE INDICADORES DE COMERCIO EXTERIOR (Base 1990) 1980 1981 1982 1983 1984 1985 1986 1987 1988 1989 VIII. VALOR OFICIAL DE LAS EXPORTACIONES (En millones de $us.) 1,043.3 991.3 917.2 829.5 784.0 675.3 650.5 587.7 608.2 852.4 IX. QUANTUM DE EXPORTACIONES (En millones de $us. de 1990) (VIII/I x 100) 703.2 688.8 672.0 607.7 574.3 517.2 608.9 582.5 611.9 824.2 X. PODER DE COMPRA DE LAS EXPORTACIONES (En millones de $us. de 1990) (IX x III/100) 1,761.1 1,568.5 1,355.2 1,239.4 1,136.2 902.2 907.3 768.9 756.8 961.7 XI. ÍNDICE DE PODER DE COMPRA DE LAS EXPORTACIONES 184.3 164.1 141.8 129.7 118.9 94.4 94.9 80.5 79.2 100.6 XII. EFECTO DE LA RELACIÓN DE PRECIOS DEL INTERCAMBIO (En millones de $us. de 1990) (X - IX) 1,057.9 879.7 683.3 631.7 561.8 385.0 298.4 186.3 144.9 137.5 XIII. EXISTENCIA DE ORO Y DIVISAS (1) (En millones de $us.) 116.1 123.5 183.2 187.8 281.4 204.9 303.1 200.5 268.6 266.4 Oro 31.2 34.2 36.1 37.0 37.9 37.8 37.8 37.9 38.0 38.0 Divisas 84.9 89.3 147.1 150.8 243.5 167.1 265.3 162.6 230.6 228.4 XIV. EXISTENCIA DE ORO Y DIVISAS (En millones de $us. de 1990) (XIII/II x 100) 196.0 195.4 270.7 280.6 407.8 273.7 422.8 262.3 334.2 300.6 XV. AFLUENCIA DE CAPITALES EXTRANJEROS (En millones de $us.)(2) 311.8 398.4 241.9 104.8 166.8 118.5 243.1 274.6 355.6 375.9 Inversión Directa y de cartera 46.5 75.6 31.0 6.9 7.0 9.8 13.0 36.4 30.0 35.0 Desemb. deuda mediano y largo plazo 265.3 322.8 210.9 97.9 159.8 108.7 230.1 238.2 325.6 340.9 XVI. AFLUENCIA DE CAPITALES EXTRANJEROS (En millones de $us. de 1990) (XV/II x 100) 526.3 630.4 357.4 156.6 241.7 158.3 339.1 359.2 442.5 424.1 XVII. CAPACIDAD TOTAL DE PAGOS SOBRE EL EXTERIOR (En millones de $us. de 1990) (X + XIV + XVI) 2,483.4 2,394.3 1,983.3 1,676.5 1,785.7 1,334.3 1,669.2 1,390.4 1,533.5 1,686.4 XVIII. ÍNDICE DE LA CAPACIDAD TOTAL DE PAGOS SOBRE EL EXTERIOR (Base 1990) 149.2 143.9 119.2 100.8 107.3 80.2 100.3 83.6 92.2 101.3 XIX. REMESA DE UTILIDADES E INTERESES (En millones de $us.) 296.0 408.4 444.5 461.5 433.7 442.2 354.9 285.6 283.8 280.3 Utilidades 15.0 30.0 23.5 59.8 36.2 52.8 46.0 12.6 5.2 15.0 Intereses pagados sobre deuda mediano y largo plazo. 281.0 378.4 421.0 401.7 397.5 389.4 308.9 273.0 278.6 265.3 XX. REMESA DE UTILIDADES E INTERESES (En millones de $us. de 1990) (XIX/II X 100) 499.7 646.2 656.8 689.5 628.6 590.8 495.0 373.6 353.1 316.3 XXI. SALIDAS DE CAPITAL EXTRANJERO (En millones de $us.)(3) Amortizaciones pagadas sobre deuda mediano y largo plazo 126.3 108.7 107.5 101.4 141.9 159.3 139.0 81.8 139.1 140.6 XXII. SALIDAS DE CAPITAL EXTRANJERO (En millones de $us. de 1990) (XXI/II x 100) 213.2 172.0 158.8 151.5 205.7 212.8 193.9 107.0 173.1 158.6 XXIII. CAPACIDAD PARA IMPORTAR (En millones de $us. de 1990) (XVII - XX - XXII) 1,770.5 1,576.1 1,167.7 835.5 951.5 530.6 980.3 909.8 1,007.3 1,211.5 XXIV. ÍNDICE DE LA CAPACIDAD PARA IMPORTAR (Base 1990) 139.5 124.2 92.0 65.8 75.0 41.8 77.3 71.7 79.4 95.5 (p) preliminar Continúa... (1) No incluyen reexportaciones (2) Saldos a fin de período. (3) No se cuenta con datos del movimiento de capital a corto plazo. FUENTE: Instituto Nacional de Estadística y Banco Central de Bolivia.
  • 3. CAPÍTULO II Sector Externo CUADRO No. 2.6.1 RESUMEN DE INDICADORES DE COMERCIO EXTERIOR (Base 1990) 1990 1991 1992 1993 1994 1995 1996 1997 1998 1999 I. ÍNDICE DE PRECIOS DE LAS EXPORTACIONES a. Según Productos Productos tradicionales 100.0 90.6 78.3 65.4 69.6 73.4 73.6 71.4 62.9 61.1 Minerales 100.0 83.4 88.6 77.3 84.0 88.5 88.4 86.8 78.6 76.2 Estaño 100.0 91.8 101.2 86.6 90.2 102.5 102.7 94.0 93.0 88.8 Hidrocarburos 100.0 103.2 58.7 42.6 41.8 44.6 44.9 42.5 32.9 35.7 Gas Natural 100.0 103.2 58.1 42.1 41.1 43.8 44.0 41.6 33.0 29.1 Productos no Tradicionales 100.0 94.8 93.3 97.1 101.2 103.4 103.6 104.3 102.1 91.5 Índice General 100.0 91.9 82.9 74.5 78.6 81.6 81.8 81.0 75.5 71.0 b. Según la CIIU (3) Agric,. caza, silvicultura y pesca 100.0 100.1 93.4 97.9 108.0 113.4 113.3 130.4 115.0 98.5 Explotación de minas y canteras 100.0 90.3 73.9 60.9 64.6 68.6 68.4 70.3 58.9 59.7 Industria Manufacturera 100.0 91.3 94.0 92.2 96.3 98.9 99.3 94.8 94.5 87.0 Índice General 100.0 91.9 82.9 74.5 78.6 81.6 81.8 81.0 75.5 71.0 II. ÍNDICE DE PRECIOS DE LAS IMPORTACIONES Bienes de Consumo 100.0 108.8 108.2 111.0 116.1 118.6 122.3 123.5 124.3 122.5 Materias Primas e Insumos 100.0 102.2 107.3 107.9 109.0 115.4 118.2 115.7 111.2 110.0 Bienes de Capital 100.0 107.9 113.0 117.1 121.6 121.6 124.0 124.8 125.9 125.1 Diversos 100.0 99.5 94.5 98.9 109.7 109.6 110.7 100.0 88.9 86.4 Índice General 100.0 105.5 108.5 110.7 114.1 118.2 121.1 120.0 118.4 117.2 III. ÍNDICE DE LA RELACIÓN DE PRECIOS DEL INTERCAMBIO (I/II x 100) 100.0 87.1 76.3 67.3 68.9 69.0 67.5 67.5 63.7 60.6 IV. ÍNDICE DE VALOR DE LAS EXPORTACIONES a. Según Productos Productos tradicionales 100.0 94.1 80.7 76.5 85.8 104.5 97.6 95.6 83.8 74.4 Minerales 100.0 87.4 92.9 93.8 107.4 125.2 117.2 122.5 106.7 97.4 Estaño 100.0 93.0 91.2 77.9 84.8 83.3 77.6 75.8 61.4 64.4 Hidrocarburos 100.0 106.2 58.9 45.3 47.1 67.3 62.3 47.2 42.6 33.1 Gas Natural 100.0 103.1 54.5 40.0 40.7 41.0 42.0 31.0 24.6 15.8 Productos no Tradicionales 100.0 91.3 75.6 99.3 180.0 156.7 196.6 213.7 190.3 188.2 Índice General 100.0 93.2 79.2 83.9 116.4 121.5 129.7 133.9 118.4 111.4 b. Según la CIIU (3) Agric,. caza, silvicultura y pesca 100.0 74.4 31.0 32.7 87.8 101.5 126.5 143.8 101.4 100.7 Explotación de minas y canteras 100.0 98.1 68.4 49.2 57.6 78.1 75.2 76.6 66.9 59.5 Industria Manufacturera 100.0 92.7 113.3 155.5 216.1 194.8 213.5 217.2 202.8 194.2 Índice General 100.0 93.2 79.2 83.9 116.4 121.5 129.7 133.9 118.4 111.4 V. ÍNDICE DE VOLUMEN DE LAS EXPORTACIONES a. Según Productos Productos tradicionales 100.0 103.9 103.1 116.9 123.4 142.3 132.7 133.9 133.2 121.9 Minerales 100.0 104.8 104.8 121.4 127.9 141.6 132.7 141.1 135.8 127.7 Estaño 100.0 101.4 90.2 90.1 94.0 81.2 75.5 80.6 66.0 72.5 Hidrocarburos 100.0 102.9 100.5 106.4 112.7 151.0 139.0 111.2 129.7 92.9 Gas Natural 100.0 99.9 93.8 95.2 98.9 93.6 95.3 74.5 74.6 54.2 Productos no Tradicionales 100.0 96.3 81.0 102.3 177.9 151.6 189.7 205.0 186.3 205.6 Índice General 100.0 101.4 95.5 112.7 148.1 148.9 158.6 165.4 156.9 156.9 b. Según la CIIU (3) Agric,. caza, silvicultura y pesca 100.0 74.3 33.2 33.4 81.3 89.5 111.7 110.3 88.2 102.2 Explotación de minas y canteras 100.0 108.7 92.6 80.8 89.1 113.9 110.0 109.0 113.6 99.7 Industria Manufacturera 100.0 101.5 120.6 168.5 224.4 197.0 214.9 229.1 214.7 223.2 Índice General 100.0 101.4 95.5 112.7 148.1 148.9 158.6 165.4 156.9 156.9 VI. ÍNDICE DE VALOR DE LAS IMPORTACIONES Bienes de Consumo 100.0 140.1 134.8 147.8 191.2 193.4 235.6 268.5 345.2 283.6 Materias Primas e Insumos 100.0 134.9 159.0 168.1 181.7 216.0 221.0 263.9 325.6 264.4 Bienes de Capital 100.0 146.2 175.4 185.0 156.9 220.3 276.7 314.0 419.2 384.2 Diversos 100.0 301.4 322.8 185.9 135.3 121.0 421.0 451.5 496.7 245.1 Índice General 100.0 142.5 162.2 170.1 173.9 211.2 247.4 285.9 366.6 312.3 VII. ÍNDICE DE VOLUMEN DE LAS IMPORTACIONES Bienes de Consumo 100.0 128.8 124.7 133.2 164.6 163.0 192.6 217.4 277.8 231.6 Materias Primas e Insumos 100.0 132.0 148.2 155.8 166.8 187.3 187.1 228.0 292.7 240.4 Bienes de Capital 100.0 135.5 155.2 158.0 129.0 181.1 223.0 251.7 333.1 307.0 Diversos 100.0 303.0 341.7 188.0 123.4 110.4 380.5 451.6 559.0 283.6 Índice General 100.0 135.1 149.4 153.6 152.4 178.7 204.3 238.3 309.6 266.4 (p) preliminar Continúa... (1) No incluyen reexportaciones (2) Saldos a fin de período. (3) No se cuenta con datos del movimiento de capital a corto plazo. FUENTE: Instituto Nacional de Estadística y Banco Central de Bolivia.
  • 4. CAPÍTULO II Sector Externo CUADRO No. 2.6.1 RESUMEN DE INDICADORES DE COMERCIO EXTERIOR (Base 1990) 1990 1991 1992 1993 1994 1995 1996 1997 1998 1999 VIII. VALOR OFICIAL DE LAS EXPORTACIONES (1) (En millones de $us.) 955.7 895.3 773.8 808.9 1,124.2 1,181.2 1,295.3 1,272.1 1,324.7 1,405.4 IX. VALOR DE LAS EXPORTACIONES (En millones de $us. de 1990) (VIII/I x 100) 955.7 974.2 933.9 1,086.1 1,430.5 1,447.7 1,584.0 1,571.1 1,755.6 1,978.3 X. PODER DE COMPRA DE LAS EXPORTACIONES (En millones de $us. de 1990) (IX x III/100) 955.7 848.9 713.0 730.5 985.1 999.0 1,069.3 1,060.1 1,118.8 1,199.2 XI. ÍNDICE DE PODER DE COMPRA DE LAS EXPORTACIONES (Base 1990) 100.0 88.8 74.6 76.4 103.1 104.5 111.9 110.9 117.1 125.5 XII. EFECTO DE LA RELACIÓN DE PRECIOS DEL INTERCAMBIO (En millones de $us. de 1990) (X-IX) 0.0 -125.3 -221.0 -355.6 -445.4 -448.7 -514.7 -511.0 -636.7 -779.0 XIII. EXISTENCIA DE ORO Y DIVISAS (2) (En millones de $us.) 307.3 286.9 326.7 417.5 597.2 734.4 1,047.5 1,134.2 1,145.4 1,175.3 Oro 37.9 39.5 39.5 39.7 39.7 39.6 39.6 39.6 256.9 260.0 Divisas 269.4 247.4 287.2 377.8 557.5 694.8 1,007.9 1,094.6 888.5 915.3 XIV. EXISTENCIA DE ORO Y DIVISAS (En millones de $us. de 1990) (XIII/II x 100) 307.3 272.0 301.0 377.0 523.3 621.1 864.7 945.2 967.3 1,002.9 XV. AFLUENCIA DE CAPITALES EXTRANJEROS (En millones de $us.)(2) 401.1 393.6 504.8 440.8 492.5 802.7 817.2 969.7 1,269.1 1,227.2 Inversión Directa y de cartera 65.9 93.7 120.1 121.6 128.0 372.3 471.9 598.9 948.9 946.7 Desemb. deuda mediano y largo plazo 335.2 299.9 384.7 319.2 364.5 430.4 345.3 370.8 320.2 280.5 XVI. AFLUENCIA DE CAPITALES EXTRANJEROS (En millones de $us. de 1990) (XV/II x 100) 401.1 373.2 465.1 398.1 431.6 678.9 674.6 808.1 1,071.9 1,047.2 XVII. CAPACIDAD TOTAL DE PAGOS SOBRE EL EXTERIOR (En millones de $us. de 1990) (X + XIV + XVI) 1,664.1 1,494.1 1,479.1 1,505.6 1,939.9 2,299.0 2,608.6 2,813.3 3,158.1 3,249.3 XVIII. ÍNDICE DE LA CAPACIDAD TOTAL DE PAGOS SOBRE EL EXTERIOR (Base 1990) 100.0 89.8 88.9 90.5 116.6 138.2 156.8 169.1 189.8 195.3 XIX. REMESA DE UTILIDADES E INTERESES (En millones de $us.) 256.8 246.5 227.3 235.5 213.4 252.8 293.7 253.3 251.4 269.9 Utilidades (Renta de Interés) 17.3 13.0 19.0 20.1 20.4 25.2 70.8 44.1 107.1 144.0 Intereses pagados sobre deuda mediano y largo plazo. 239.5 233.5 208.3 215.4 193.0 227.6 222.9 209.2 144.3 125.9 XX. REMESA DE UTILIDADES E INTERESES (En millones de $us. de 1990) (XIX/II X 100) 256.5 238.5 210.3 217.1 186.6 213.0 217.0 241.2 212.3 230.3 XXI. SALIDAS DE CAPITAL EXTRANJERO (En millones de $us.)(3) Amortizaciones pagadas sobre deuda mediano y largo plazo 138.7 91.2 106.9 119.5 138.9 139.9 148.9 165.7 229.0 167.0 XXII. SALIDAS DE CAPITAL EXTRANJERO (En millones de $us. de 1990) (XXI/II x 100) 138.7 86.5 98.5 107.9 121.7 118.3 122.9 138.1 193.4 142.5 XXIII. CAPACIDAD PARA IMPORTAR (En millones de $us. de 1990) (XVII - XX - XXII) 1,268.9 1,169.2 1,170.2 1,180.6 1,631.6 1,967.7 2,268.7 2,434.0 2,752.3 2,876.5 XXIV. ÍNDICE DE LA CAPACIDAD PARA IMPORTAR (Base 1990) 100.0 92.1 92.2 93.0 128.6 155.1 178.8 191.8 216.9 226.7 (p) preliminar Continúa... (1) No incluyen reexportaciones (2) Saldos a fin de período. (3) No se cuenta con datos del movimiento de capital a corto plazo. FUENTE: Instituto Nacional de Estadística y Banco Central de Bolivia.
  • 5. CAPÍTULO II Sector Externo CUADRO No. 2.6.1 RESUMEN DE INDICADORES DE COMERCIO EXTERIOR (Base 1990) 2000 2001 2002 2003 2004 2005 2006 2007(p) I. ÍNDICE DE PRECIOS DE LAS EXPORTACIONES a. Según Productos Productos tradicionales 67.9 61.8 60.6 66.9 84.2 102.2 137.4 152.9 Minerales 77.7 67.6 66.4 72.1 101.6 110.2 156.5 182.8 Estaño 90.4 80.9 74.4 84.9 131.7 132.4 140.8 216.2 Hidrocarburos 56.7 57.1 55.9 62.7 73.4 98.5 128.1 138.2 Gas Natural 54.5 57.9 56.1 63.7 63.9 81.2 108.7 142.8 Productos no Tradicionales 90.4 87.8 91.3 95.0 113.7 115.8 120.4 130.3 Índice General 74.1 70.0 70.6 75.8 95.7 108.0 124.7 137.2 b. Según la CIIU (3) Agric,. caza, silvicultura y pesca 98.2 95.7 94.2 93.9 108.0 114.2 111.0 120.1 Explotación de minas y canteras 69.4 63.1 60.5 66.4 80.0 95.4 149.9 183.4 Industria Manufacturera 86.6 83.3 87.1 92.6 115.1 118.3 125.6 147.7 Índice General 74.1 70.0 70.6 75.8 95.7 108.0 124.7 137.2 II. ÍNDICE DE PRECIOS DE LAS IMPORTACIONES Bienes de Consumo 121.8 118.9 117.3 117.1 127.7 156.6 183.7 222.5 Materias Primas e Insumos 113.4 111.5 112.8 114.7 124.8 148.9 176.1 210.9 Bienes de Capital 125.0 125.4 125.6 126.8 140.4 160.1 190.5 219.7 Diversos 88.4 87.7 89.4 98.0 100.6 97.1 98.7 109.5 Índice General 118.6 116.9 117.3 118.7 129.5 156.0 184.0 219.7 III. ÍNDICE DE LA RELACIÓN DE PRECIOS DEL INTERCAMBIO (I/II x 100) 62.5 59.9 60.2 63.9 73.9 69.2 67.7 62.5 IV. ÍNDICE DE VALOR DE LAS EXPORTACIONES a. Según Productos Productos tradicionales 95.1 101.4 109.3 137.9 206.2 313.5 492.0 579.1 Minerales 104.2 83.4 85.1 90.6 112.1 133.8 260.4 339.7 Estaño 71.1 52.1 54.0 69.3 136.7 116.9 134.9 201.0 Hidrocarburos 78.9 133.9 152.8 222.9 375.3 636.6 908.6 1,009.6 Gas Natural 53.9 106.2 118.2 172.9 275.1 482.3 740.3 875.1 Productos no Tradicionales 212.2 192.4 206.9 236.2 292.7 290.1 319.2 369.5 Índice General 133.2 131.1 141.1 169.9 234.4 306.1 436.4 511.6 b. Según la CIIU (3) Agric,. caza, silvicultura y pesca 92.2 44.1 50.7 77.9 109.0 142.4 133.6 155.1 Explotación de minas y canteras 86.0 97.5 108.2 145.3 227.4 356.4 571.5 672.2 Industria Manufacturera 220.1 214.7 224.7 241.4 291.8 291.0 344.5 401.2 Índice General 133.2 131.1 141.1 169.9 234.4 306.1 436.4 511.6 V. ÍNDICE DE VOLUMEN DE LAS EXPORTACIONES a. Según Productos Productos tradicionales 140.2 164.1 180.4 206.0 244.7 304.7 359.4 376.6 Minerales 134.1 123.3 128.2 125.6 110.6 121.3 165.8 185.4 Estaño 78.6 64.3 72.7 81.7 105.6 87.9 95.6 90.4 Hidrocarburos 139.1 234.4 273.5 355.6 511.4 641.1 713.8 731.0 Gas Natural 98.8 183.4 210.7 271.4 430.5 589.2 687.1 613.6 Productos no Tradicionales 236.0 219.2 226.6 248.7 257.3 249.8 264.9 282.5 Índice General 180.3 187.3 199.9 224.1 244.8 282.1 349.4 370.9 b. Según la CIIU (3) Agric,. caza, silvicultura y pesca 93.9 46.1 53.9 83.0 98.7 125.4 120.6 128.5 Explotación de minas y canteras 123.9 154.4 178.7 218.9 284.4 370.7 382.7 364.8 Industria Manufacturera 255.3 257.8 258.0 260.7 253.5 245.6 274.1 270.2 Índice General 180.3 187.3 199.9 224.1 244.8 282.1 349.4 370.9 VI. ÍNDICE DE VALOR DE LAS IMPORTACIONES Bienes de Consumo 323.5 283.8 259.4 248.0 280.4 366.4 341.8 559.5 Materias Primas e Insumos 339.3 319.5 338.0 318.4 372.1 480.7 551.0 650.5 Bienes de Capital 252.5 174.1 220.1 190.3 209.5 254.0 393.9 373.3 Diversos 118.0 109.0 82.1 124.4 166.6 236.8 206.1 253.2 Índice General 300.7 255.2 273.8 253.3 289.5 369.0 443.2 523.4 VII. ÍNDICE DE VOLUMEN DE LAS IMPORTACIONES Bienes de Consumo 265.7 238.7 221.1 211.8 219.6 232.3 185.7 250.7 Materias Primas e Insumos 299.1 286.5 299.7 277.5 297.0 321.7 313.4 307.2 Bienes de Capital 202.1 138.8 175.2 150.1 149.0 158.3 207.4 169.7 Diversos 133.6 124.3 91.9 126.9 165.3 243.5 208.9 230.3 Índice General 253.6 218.2 233.4 213.4 223.0 235.6 241.1 237.4 (p) preliminar Continúa... (1) No incluyen reexportaciones (2) Saldos a fin de período. (3) No se cuenta con datos del movimiento de capital a corto plazo. FUENTE: Instituto Nacional de Estadística y Banco Central de Bolivia.
  • 6. CAPÍTULO II Sector Externo CUADRO No. 2.6.1 RESUMEN DE INDICADORES DE COMERCIO EXTERIOR (Base 1990) 2000 2001 2002 2003 2004 2005 (p) 2006 (p) 2007(p) VIII. VALOR OFICIAL DE LAS EXPORTACIONES (1) (En millones de $us.) 1,475.0 1,229.2 1,322.5 1,592.3 2,197.1 2,870.0 4,090.6 4,796.3 IX. VALOR DE LAS EXPORTACIONES (En millones de $us. de 1990) (VIII/I x 100) 1,990.9 1,755.9 1,873.8 2,100.5 2,296.0 2,656.7 3,281.4 3,494.7 X. PODER DE COMPRA DE LAS EXPORTACIONES (En millones de $us. de 1990) (IX x III/100) 1,244.1 1,051.3 1,127.4 1,341.5 1,696.9 1,839.2 2,222.7 2,182.7 XI. ÍNDICE DE PODER DE COMPRA DE LAS EXPORTACIONES (Base 1990) 130.2 110.0 118.0 140.4 177.6 192.5 232.6 228.4 XII. EFECTO DE LA RELACIÓN DE PRECIOS DEL INTERCAMBIO (En millones de $us. de 1990) (X-IX) -746.8 -704.6 -746.4 -758.9 -599.1 -817.6 -1,058.7 -1,311.9 XIII. EXISTENCIA DE ORO Y DIVISAS (2) (En millones de $us.) 1,114.1 1,084.9 837.7 1,042.7 1,216.7 1,747.3 3,138.8 5,262.0 Oro 244.8 259.6 316.4 379.4 399.4 470.6 577.6 764.3 Divisas 869.3 825.3 521.2 663.3 817.3 1,276.7 2,561.2 4,497.7 XIV. EXISTENCIA DE ORO Y DIVISAS (En millones de $us. de 1990) (XIII/II x 100) 939.7 927.9 714.0 878.4 939.7 1,119.7 1,705.5 2,394.6 XV. AFLUENCIA DE CAPITALES EXTRANJEROS (En millones de $us.)(2) 1,094.4 1,165.6 1,197.1 828.5 579.4 53.2 574.8 513.0 Inversión Directa y de cartera 789.4 680.2 654.7 126.8 27.2 -395.0 317.8 190.7 Desemb. deuda mediano y largo plazo 305.0 485.4 542.4 701.6 552.2 448.2 256.9 322.3 XVI. AFLUENCIA DE CAPITALES EXTRANJEROS (En millones de $us. de 1990) (XV/II x 100) 923.1 996.9 1,020.4 698.0 447.5 34.1 312.3 233.5 XVII. CAPACIDAD TOTAL DE PAGOS SOBRE EL EXTERIOR (En millones de $us. de 1990) (X + XIV + XVI) 3,106.9 2,976.1 2,861.8 2,918.0 3,084.1 2,993.0 4,240.5 4,810.8 XVIII. ÍNDICE DE LA CAPACIDAD TOTAL DE PAGOS SOBRE EL EXTERIOR (Base 1990) 186.7 178.8 172.0 175.4 185.3 179.9 254.8 289.1 XIX. REMESA DE UTILIDADES E INTERESES (En millones de $us.) 282.9 290.8 278.5 335.5 391.8 396.9 518.9 430.3 Utilidades (Renta de Interés) 153.0 174.6 180.4 230.7 289.1 267.7 388.5 324.4 Intereses pagados sobre deuda mediano y largo plazo. 129.9 116.2 98.1 104.8 102.7 129.1 130.4 105.9 XX. REMESA DE UTILIDADES E INTERESES (En millones de $us. de 1990) (XIX/II X 100) 238.6 248.7 237.4 282.7 302.6 254.3 281.9 195.8 XXI. SALIDAS DE CAPITAL EXTRANJERO (En millones de $us.)(3) Amortizaciones pagadas sobre deuda mediano y largo plazo 180.0 173.8 223.3 220.9 222.5 262.2 1,823.3 1,391.3 XXII. SALIDAS DE CAPITAL EXTRANJERO (En millones de $us. de 1990) (XXI/II x 100) 151.8 148.6 190.3 186.1 171.8 168.0 990.7 633.1 XXIII. CAPACIDAD PARA IMPORTAR (En millones de $us. de 1990) (XVII - XX - XXII) 2,704.1 2,485.7 2,421.3 2,374.1 2,567.2 2,661.2 3,139.9 3,981.9 XXIV. ÍNDICE DE LA CAPACIDAD PARA IMPORTAR (Base 1990) 213.1 195.9 190.8 187.1 202.3 209.7 247.5 172.0 (p) preliminar (1) No incluyen reexportaciones (2) Saldos a fin de período. (3) No se cuenta con datos del movimiento de capital a corto plazo. FUENTE: Instituto Nacional de Estadística y Banco Central de Bolivia.