SlideShare una empresa de Scribd logo
1 de 11
Cause and Effect Analysis
Amit Shrivastava
Hyderabad, India.
History
 Cause and Effect Analysis was devised by
professor Kaoru Ishikawa, a pioneer of
quality management, in the 1960s. The
technique was then published in his 1990
book, "Introduction to Quality Control.“
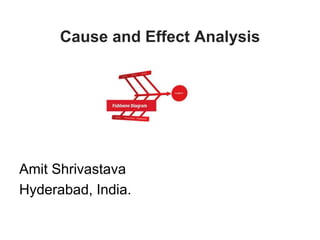
 The diagrams that we create, are known
as Ishikawa Diagrams or Fishbone
Diagrams
This is used to:
 Discover the root cause of a problem
 Uncover bottlenecks in the process
 Identify where and why the process isn't
working
Key Points
The technique uses a diagram-based
approach for thinking through all of the
possible causes of a problem. This helps to
carry out a thorough analysis of the
situation.
Steps to use this Tool
 Identify the Problems
 Work out the Major Factors Involved
 Identify Possible Causes
 Analyze the Diagram
Step 1: Identify the Problem
 Write down the exact problem we face,
i.e., the “EFFECT" to be diagrammed
 Draw a box around the effect with an
arrow heading to it
EFFECT
Step 2: Work Out the Major Factors
Involved
 Identify the factors that may be the part of
the problem
 Write down all the factors on the diagram
Instructions Duplicates
Commercials Listening
Step 3: Identify Possible Causes
 For each of the factors, brainstorm
possible causes of the problem that may
be related to the factor
 Show these possible causes coming off
the "bones" of the diagram
Step 4: Analyze the Diagram
 We have a diagram, that shows all of the
possible causes of the problem that we
can think of
 We can now investigate the most likely
causes further
Cause and effect analysis

Más contenido relacionado

La actualidad más candente

Root cause analysis
Root cause analysisRoot cause analysis
Root cause analysisSimmy Sharma
 
Mini-Training: Using root-cause analysis for problem management
Mini-Training: Using root-cause analysis for problem managementMini-Training: Using root-cause analysis for problem management
Mini-Training: Using root-cause analysis for problem managementBetclic Everest Group Tech Team
 
Ishikawa's Fish Bone
Ishikawa's Fish BoneIshikawa's Fish Bone
Ishikawa's Fish BonePrithvi Ghag
 
Fishbone analysis (edited)
Fishbone analysis (edited)Fishbone analysis (edited)
Fishbone analysis (edited)Izzah Ros
 
Root Cause Analysis - Tools, Tips and Tricks to Get to the Bottom of Root Cause
Root Cause Analysis - Tools, Tips and Tricks to Get to the Bottom of Root CauseRoot Cause Analysis - Tools, Tips and Tricks to Get to the Bottom of Root Cause
Root Cause Analysis - Tools, Tips and Tricks to Get to the Bottom of Root CauseCraig Thornton
 
Root cause analysis apr 2010
Root cause analysis apr 2010Root cause analysis apr 2010
Root cause analysis apr 2010Michael Sahota
 
Pareto analysis
Pareto analysisPareto analysis
Pareto analysisHimanshu
 
5 Why Training Slides Oct 14, 2009
5 Why Training Slides Oct 14, 20095 Why Training Slides Oct 14, 2009
5 Why Training Slides Oct 14, 2009ExerciseLeanLLC
 
5 why analysis training presentaion
5 why analysis training presentaion5 why analysis training presentaion
5 why analysis training presentaionDharmesh Panchal
 
8D Problem Solving - Automotive Industry
8D Problem Solving - Automotive Industry8D Problem Solving - Automotive Industry
8D Problem Solving - Automotive IndustryGestion Projet Auto
 
Measure phase lean six sigma tollgate template
Measure phase   lean six sigma tollgate templateMeasure phase   lean six sigma tollgate template
Measure phase lean six sigma tollgate templateSteven Bonacorsi
 

La actualidad más candente (20)

Root cause analysis
Root cause analysisRoot cause analysis
Root cause analysis
 
Mini-Training: Using root-cause analysis for problem management
Mini-Training: Using root-cause analysis for problem managementMini-Training: Using root-cause analysis for problem management
Mini-Training: Using root-cause analysis for problem management
 
Root Cause Analysis
Root Cause AnalysisRoot Cause Analysis
Root Cause Analysis
 
Root Cause Analysis ( RCA )
Root Cause Analysis ( RCA )Root Cause Analysis ( RCA )
Root Cause Analysis ( RCA )
 
Ishikawa's Fish Bone
Ishikawa's Fish BoneIshikawa's Fish Bone
Ishikawa's Fish Bone
 
Fishbone analysis (edited)
Fishbone analysis (edited)Fishbone analysis (edited)
Fishbone analysis (edited)
 
Six sigma
Six sigmaSix sigma
Six sigma
 
Root Cause Analysis - Tools, Tips and Tricks to Get to the Bottom of Root Cause
Root Cause Analysis - Tools, Tips and Tricks to Get to the Bottom of Root CauseRoot Cause Analysis - Tools, Tips and Tricks to Get to the Bottom of Root Cause
Root Cause Analysis - Tools, Tips and Tricks to Get to the Bottom of Root Cause
 
Root cause analysis apr 2010
Root cause analysis apr 2010Root cause analysis apr 2010
Root cause analysis apr 2010
 
Pareto analysis
Pareto analysisPareto analysis
Pareto analysis
 
5 Why Training Slides Oct 14, 2009
5 Why Training Slides Oct 14, 20095 Why Training Slides Oct 14, 2009
5 Why Training Slides Oct 14, 2009
 
Why why analysis
Why why analysisWhy why analysis
Why why analysis
 
Root Cause Analysis (RCA)
Root Cause Analysis (RCA)Root Cause Analysis (RCA)
Root Cause Analysis (RCA)
 
5 why analysis training presentaion
5 why analysis training presentaion5 why analysis training presentaion
5 why analysis training presentaion
 
8D Problem Solving - Automotive Industry
8D Problem Solving - Automotive Industry8D Problem Solving - Automotive Industry
8D Problem Solving - Automotive Industry
 
Root Cause Analysis Presentation
Root Cause Analysis PresentationRoot Cause Analysis Presentation
Root Cause Analysis Presentation
 
Measure phase lean six sigma tollgate template
Measure phase   lean six sigma tollgate templateMeasure phase   lean six sigma tollgate template
Measure phase lean six sigma tollgate template
 
Fish Bone Diagram
Fish Bone DiagramFish Bone Diagram
Fish Bone Diagram
 
Poka yoke
Poka yokePoka yoke
Poka yoke
 
Root cause analysis
Root cause analysisRoot cause analysis
Root cause analysis
 

Destacado

Cause & effect analysis part 2
Cause & effect analysis part 2Cause & effect analysis part 2
Cause & effect analysis part 2Stephen Parsons
 
Cause & effect analysis part 1
Cause & effect analysis part 1Cause & effect analysis part 1
Cause & effect analysis part 1Stephen Parsons
 
Cause and-effect diagram
Cause and-effect diagramCause and-effect diagram
Cause and-effect diagramYasoda Kumar
 
Cause & effect analysis
Cause & effect analysisCause & effect analysis
Cause & effect analysisPramget Kaur
 
Gerlach instituut; jaar 2, les 5 argumenteren
Gerlach instituut; jaar 2, les 5 argumenterenGerlach instituut; jaar 2, les 5 argumenteren
Gerlach instituut; jaar 2, les 5 argumenterenMartin Van Rooij
 
Omgaan met tegenwerpingen in onderhandelingen
Omgaan met tegenwerpingen in onderhandelingenOmgaan met tegenwerpingen in onderhandelingen
Omgaan met tegenwerpingen in onderhandelingenarjan broere
 
09. Argument mapping
09. Argument mapping09. Argument mapping
09. Argument mappingLawrie Hunter
 
Cause and effect diagram
Cause and effect diagramCause and effect diagram
Cause and effect diagramCOEPD HR
 
Visual metaphors as cognitive scalpel: Cutting through the language disguise
Visual metaphors as cognitive scalpel: Cutting through the language disguiseVisual metaphors as cognitive scalpel: Cutting through the language disguise
Visual metaphors as cognitive scalpel: Cutting through the language disguiseLawrie Hunter
 
Marktonderzoek in rechte lijn deel 2 2014
Marktonderzoek in rechte lijn deel 2 2014Marktonderzoek in rechte lijn deel 2 2014
Marktonderzoek in rechte lijn deel 2 2014DeBoeckHoger
 
Novakian mapping for argument work
Novakian mapping for argument workNovakian mapping for argument work
Novakian mapping for argument workLawrie Hunter
 
HISTORISCH DENKEN EN REDENEREN
HISTORISCH DENKEN EN REDENERENHISTORISCH DENKEN EN REDENEREN
HISTORISCH DENKEN EN REDENERENJos Meuwissen
 
[Idm e] informatievisualisatie 2
[Idm e] informatievisualisatie 2[Idm e] informatievisualisatie 2
[Idm e] informatievisualisatie 2Klaas Jan Mollema
 
Argmenterenles1 3
Argmenterenles1 3Argmenterenles1 3
Argmenterenles1 3AnoukLebeau
 
Cause & Effect Diagram Use for H&S System Hazard Identification
Cause & Effect Diagram Use for H&S System Hazard IdentificationCause & Effect Diagram Use for H&S System Hazard Identification
Cause & Effect Diagram Use for H&S System Hazard IdentificationPECB
 
Workshop 2 ppt probleemanalyse[1][1]
Workshop 2  ppt probleemanalyse[1][1]Workshop 2  ppt probleemanalyse[1][1]
Workshop 2 ppt probleemanalyse[1][1]vri
 

Destacado (20)

Cause & effect analysis part 2
Cause & effect analysis part 2Cause & effect analysis part 2
Cause & effect analysis part 2
 
Cause & effect analysis part 1
Cause & effect analysis part 1Cause & effect analysis part 1
Cause & effect analysis part 1
 
Cause and-effect diagram
Cause and-effect diagramCause and-effect diagram
Cause and-effect diagram
 
Cause And Effect Analysis
Cause And Effect AnalysisCause And Effect Analysis
Cause And Effect Analysis
 
Cause & effect analysis
Cause & effect analysisCause & effect analysis
Cause & effect analysis
 
Gerlach instituut; jaar 2, les 5 argumenteren
Gerlach instituut; jaar 2, les 5 argumenterenGerlach instituut; jaar 2, les 5 argumenteren
Gerlach instituut; jaar 2, les 5 argumenteren
 
Omgaan met tegenwerpingen in onderhandelingen
Omgaan met tegenwerpingen in onderhandelingenOmgaan met tegenwerpingen in onderhandelingen
Omgaan met tegenwerpingen in onderhandelingen
 
09. Argument mapping
09. Argument mapping09. Argument mapping
09. Argument mapping
 
Cause and effect diagram
Cause and effect diagramCause and effect diagram
Cause and effect diagram
 
Visual metaphors as cognitive scalpel: Cutting through the language disguise
Visual metaphors as cognitive scalpel: Cutting through the language disguiseVisual metaphors as cognitive scalpel: Cutting through the language disguise
Visual metaphors as cognitive scalpel: Cutting through the language disguise
 
Marktonderzoek in rechte lijn deel 2 2014
Marktonderzoek in rechte lijn deel 2 2014Marktonderzoek in rechte lijn deel 2 2014
Marktonderzoek in rechte lijn deel 2 2014
 
Novakian mapping for argument work
Novakian mapping for argument workNovakian mapping for argument work
Novakian mapping for argument work
 
Root cause analysis
Root cause analysisRoot cause analysis
Root cause analysis
 
HISTORISCH DENKEN EN REDENEREN
HISTORISCH DENKEN EN REDENERENHISTORISCH DENKEN EN REDENEREN
HISTORISCH DENKEN EN REDENEREN
 
[Idm e] informatievisualisatie 2
[Idm e] informatievisualisatie 2[Idm e] informatievisualisatie 2
[Idm e] informatievisualisatie 2
 
Argmenterenles1 3
Argmenterenles1 3Argmenterenles1 3
Argmenterenles1 3
 
Argument Mapping overview
Argument Mapping overviewArgument Mapping overview
Argument Mapping overview
 
Innovateppt
InnovatepptInnovateppt
Innovateppt
 
Cause & Effect Diagram Use for H&S System Hazard Identification
Cause & Effect Diagram Use for H&S System Hazard IdentificationCause & Effect Diagram Use for H&S System Hazard Identification
Cause & Effect Diagram Use for H&S System Hazard Identification
 
Workshop 2 ppt probleemanalyse[1][1]
Workshop 2  ppt probleemanalyse[1][1]Workshop 2  ppt probleemanalyse[1][1]
Workshop 2 ppt probleemanalyse[1][1]
 

Similar a Cause and effect analysis

Seven Statistical tools for Quality Management
Seven Statistical tools for Quality ManagementSeven Statistical tools for Quality Management
Seven Statistical tools for Quality ManagementShilpi Arora
 
steps to problem solvingproblem solving.pptx
steps to problem solvingproblem solving.pptxsteps to problem solvingproblem solving.pptx
steps to problem solvingproblem solving.pptxkalahasthijwalahimab
 
TQM UNIT 2.pptx presentation with images
TQM UNIT 2.pptx presentation with imagesTQM UNIT 2.pptx presentation with images
TQM UNIT 2.pptx presentation with imagesPradeep482741
 
Cause & Effect Diagram.pdf
Cause & Effect Diagram.pdfCause & Effect Diagram.pdf
Cause & Effect Diagram.pdfSarvesh Kumar
 
7 qc tools[1] to print
7 qc tools[1] to print7 qc tools[1] to print
7 qc tools[1] to printJitesh Gaurav
 
9 basic seven tools of quality
9 basic seven tools of quality9 basic seven tools of quality
9 basic seven tools of qualitygoldenbull268
 
THE 5 DIMENSIONS OF PROBLEM SOLVING USING DINNA: CASE STUDY IN THE ELECTRONIC...
THE 5 DIMENSIONS OF PROBLEM SOLVING USING DINNA: CASE STUDY IN THE ELECTRONIC...THE 5 DIMENSIONS OF PROBLEM SOLVING USING DINNA: CASE STUDY IN THE ELECTRONIC...
THE 5 DIMENSIONS OF PROBLEM SOLVING USING DINNA: CASE STUDY IN THE ELECTRONIC...IJDKP
 
Cause & Effect Diagrams
Cause & Effect DiagramsCause & Effect Diagrams
Cause & Effect DiagramsNat Evans
 
ОКСАНА ГОРОЩУК «Improving Quality Through Root Cause Analysis»
ОКСАНА ГОРОЩУК «Improving Quality Through Root Cause Analysis»ОКСАНА ГОРОЩУК «Improving Quality Through Root Cause Analysis»
ОКСАНА ГОРОЩУК «Improving Quality Through Root Cause Analysis»GoQA
 
PROBLEM kbfb3nrioqmkandc jnojnkoj j.pptx
PROBLEM kbfb3nrioqmkandc jnojnkoj j.pptxPROBLEM kbfb3nrioqmkandc jnojnkoj j.pptx
PROBLEM kbfb3nrioqmkandc jnojnkoj j.pptxmonisha2312
 

Similar a Cause and effect analysis (20)

Ishikawa
IshikawaIshikawa
Ishikawa
 
Seven Statistical tools for Quality Management
Seven Statistical tools for Quality ManagementSeven Statistical tools for Quality Management
Seven Statistical tools for Quality Management
 
Apollo Introduction
Apollo IntroductionApollo Introduction
Apollo Introduction
 
Fishbone Diagram
Fishbone DiagramFishbone Diagram
Fishbone Diagram
 
steps to problem solvingproblem solving.pptx
steps to problem solvingproblem solving.pptxsteps to problem solvingproblem solving.pptx
steps to problem solvingproblem solving.pptx
 
TQM UNIT 2.pptx presentation with images
TQM UNIT 2.pptx presentation with imagesTQM UNIT 2.pptx presentation with images
TQM UNIT 2.pptx presentation with images
 
Cause & Effect Diagram.pdf
Cause & Effect Diagram.pdfCause & Effect Diagram.pdf
Cause & Effect Diagram.pdf
 
7QC Tools
7QC Tools7QC Tools
7QC Tools
 
7 qc tools[1] to print
7 qc tools[1] to print7 qc tools[1] to print
7 qc tools[1] to print
 
9 basic seven tools of quality
9 basic seven tools of quality9 basic seven tools of quality
9 basic seven tools of quality
 
Fishbone Diagram.pptx
Fishbone Diagram.pptxFishbone Diagram.pptx
Fishbone Diagram.pptx
 
Cause & Effect Diagrams
Cause & Effect DiagramsCause & Effect Diagrams
Cause & Effect Diagrams
 
Run Chart
Run ChartRun Chart
Run Chart
 
THE 5 DIMENSIONS OF PROBLEM SOLVING USING DINNA: CASE STUDY IN THE ELECTRONIC...
THE 5 DIMENSIONS OF PROBLEM SOLVING USING DINNA: CASE STUDY IN THE ELECTRONIC...THE 5 DIMENSIONS OF PROBLEM SOLVING USING DINNA: CASE STUDY IN THE ELECTRONIC...
THE 5 DIMENSIONS OF PROBLEM SOLVING USING DINNA: CASE STUDY IN THE ELECTRONIC...
 
Quality Circles
Quality CirclesQuality Circles
Quality Circles
 
Cause & Effect Diagrams
Cause & Effect DiagramsCause & Effect Diagrams
Cause & Effect Diagrams
 
Cause & effect diagrams
Cause & effect diagramsCause & effect diagrams
Cause & effect diagrams
 
Cause & effect diagrams
Cause & effect diagramsCause & effect diagrams
Cause & effect diagrams
 
ОКСАНА ГОРОЩУК «Improving Quality Through Root Cause Analysis»
ОКСАНА ГОРОЩУК «Improving Quality Through Root Cause Analysis»ОКСАНА ГОРОЩУК «Improving Quality Through Root Cause Analysis»
ОКСАНА ГОРОЩУК «Improving Quality Through Root Cause Analysis»
 
PROBLEM kbfb3nrioqmkandc jnojnkoj j.pptx
PROBLEM kbfb3nrioqmkandc jnojnkoj j.pptxPROBLEM kbfb3nrioqmkandc jnojnkoj j.pptx
PROBLEM kbfb3nrioqmkandc jnojnkoj j.pptx
 

Último

B.COM Unit – 4 ( CORPORATE SOCIAL RESPONSIBILITY ( CSR ).pptx
B.COM Unit – 4 ( CORPORATE SOCIAL RESPONSIBILITY ( CSR ).pptxB.COM Unit – 4 ( CORPORATE SOCIAL RESPONSIBILITY ( CSR ).pptx
B.COM Unit – 4 ( CORPORATE SOCIAL RESPONSIBILITY ( CSR ).pptxpriyanshujha201
 
VIP Call Girls Gandi Maisamma ( Hyderabad ) Phone 8250192130 | ₹5k To 25k Wit...
VIP Call Girls Gandi Maisamma ( Hyderabad ) Phone 8250192130 | ₹5k To 25k Wit...VIP Call Girls Gandi Maisamma ( Hyderabad ) Phone 8250192130 | ₹5k To 25k Wit...
VIP Call Girls Gandi Maisamma ( Hyderabad ) Phone 8250192130 | ₹5k To 25k Wit...Suhani Kapoor
 
Call Girls Pune Just Call 9907093804 Top Class Call Girl Service Available
Call Girls Pune Just Call 9907093804 Top Class Call Girl Service AvailableCall Girls Pune Just Call 9907093804 Top Class Call Girl Service Available
Call Girls Pune Just Call 9907093804 Top Class Call Girl Service AvailableDipal Arora
 
MONA 98765-12871 CALL GIRLS IN LUDHIANA LUDHIANA CALL GIRL
MONA 98765-12871 CALL GIRLS IN LUDHIANA LUDHIANA CALL GIRLMONA 98765-12871 CALL GIRLS IN LUDHIANA LUDHIANA CALL GIRL
MONA 98765-12871 CALL GIRLS IN LUDHIANA LUDHIANA CALL GIRLSeo
 
A305_A2_file_Batkhuu progress report.pdf
A305_A2_file_Batkhuu progress report.pdfA305_A2_file_Batkhuu progress report.pdf
A305_A2_file_Batkhuu progress report.pdftbatkhuu1
 
Pharma Works Profile of Karan Communications
Pharma Works Profile of Karan CommunicationsPharma Works Profile of Karan Communications
Pharma Works Profile of Karan Communicationskarancommunications
 
Regression analysis: Simple Linear Regression Multiple Linear Regression
Regression analysis:  Simple Linear Regression Multiple Linear RegressionRegression analysis:  Simple Linear Regression Multiple Linear Regression
Regression analysis: Simple Linear Regression Multiple Linear RegressionRavindra Nath Shukla
 
Unlocking the Secrets of Affiliate Marketing.pdf
Unlocking the Secrets of Affiliate Marketing.pdfUnlocking the Secrets of Affiliate Marketing.pdf
Unlocking the Secrets of Affiliate Marketing.pdfOnline Income Engine
 
9599632723 Top Call Girls in Delhi at your Door Step Available 24x7 Delhi
9599632723 Top Call Girls in Delhi at your Door Step Available 24x7 Delhi9599632723 Top Call Girls in Delhi at your Door Step Available 24x7 Delhi
9599632723 Top Call Girls in Delhi at your Door Step Available 24x7 DelhiCall Girls in Delhi
 
Progress Report - Oracle Database Analyst Summit
Progress  Report - Oracle Database Analyst SummitProgress  Report - Oracle Database Analyst Summit
Progress Report - Oracle Database Analyst SummitHolger Mueller
 
Best Basmati Rice Manufacturers in India
Best Basmati Rice Manufacturers in IndiaBest Basmati Rice Manufacturers in India
Best Basmati Rice Manufacturers in IndiaShree Krishna Exports
 
Mondelez State of Snacking and Future Trends 2023
Mondelez State of Snacking and Future Trends 2023Mondelez State of Snacking and Future Trends 2023
Mondelez State of Snacking and Future Trends 2023Neil Kimberley
 
Enhancing and Restoring Safety & Quality Cultures - Dave Litwiller - May 2024...
Enhancing and Restoring Safety & Quality Cultures - Dave Litwiller - May 2024...Enhancing and Restoring Safety & Quality Cultures - Dave Litwiller - May 2024...
Enhancing and Restoring Safety & Quality Cultures - Dave Litwiller - May 2024...Dave Litwiller
 
M.C Lodges -- Guest House in Jhang.
M.C Lodges --  Guest House in Jhang.M.C Lodges --  Guest House in Jhang.
M.C Lodges -- Guest House in Jhang.Aaiza Hassan
 
7.pdf This presentation captures many uses and the significance of the number...
7.pdf This presentation captures many uses and the significance of the number...7.pdf This presentation captures many uses and the significance of the number...
7.pdf This presentation captures many uses and the significance of the number...Paul Menig
 
Ensure the security of your HCL environment by applying the Zero Trust princi...
Ensure the security of your HCL environment by applying the Zero Trust princi...Ensure the security of your HCL environment by applying the Zero Trust princi...
Ensure the security of your HCL environment by applying the Zero Trust princi...Roland Driesen
 
Cracking the Cultural Competence Code.pptx
Cracking the Cultural Competence Code.pptxCracking the Cultural Competence Code.pptx
Cracking the Cultural Competence Code.pptxWorkforce Group
 
Mysore Call Girls 8617370543 WhatsApp Number 24x7 Best Services
Mysore Call Girls 8617370543 WhatsApp Number 24x7 Best ServicesMysore Call Girls 8617370543 WhatsApp Number 24x7 Best Services
Mysore Call Girls 8617370543 WhatsApp Number 24x7 Best ServicesDipal Arora
 
Monthly Social Media Update April 2024 pptx.pptx
Monthly Social Media Update April 2024 pptx.pptxMonthly Social Media Update April 2024 pptx.pptx
Monthly Social Media Update April 2024 pptx.pptxAndy Lambert
 

Último (20)

B.COM Unit – 4 ( CORPORATE SOCIAL RESPONSIBILITY ( CSR ).pptx
B.COM Unit – 4 ( CORPORATE SOCIAL RESPONSIBILITY ( CSR ).pptxB.COM Unit – 4 ( CORPORATE SOCIAL RESPONSIBILITY ( CSR ).pptx
B.COM Unit – 4 ( CORPORATE SOCIAL RESPONSIBILITY ( CSR ).pptx
 
VIP Call Girls Gandi Maisamma ( Hyderabad ) Phone 8250192130 | ₹5k To 25k Wit...
VIP Call Girls Gandi Maisamma ( Hyderabad ) Phone 8250192130 | ₹5k To 25k Wit...VIP Call Girls Gandi Maisamma ( Hyderabad ) Phone 8250192130 | ₹5k To 25k Wit...
VIP Call Girls Gandi Maisamma ( Hyderabad ) Phone 8250192130 | ₹5k To 25k Wit...
 
Call Girls Pune Just Call 9907093804 Top Class Call Girl Service Available
Call Girls Pune Just Call 9907093804 Top Class Call Girl Service AvailableCall Girls Pune Just Call 9907093804 Top Class Call Girl Service Available
Call Girls Pune Just Call 9907093804 Top Class Call Girl Service Available
 
MONA 98765-12871 CALL GIRLS IN LUDHIANA LUDHIANA CALL GIRL
MONA 98765-12871 CALL GIRLS IN LUDHIANA LUDHIANA CALL GIRLMONA 98765-12871 CALL GIRLS IN LUDHIANA LUDHIANA CALL GIRL
MONA 98765-12871 CALL GIRLS IN LUDHIANA LUDHIANA CALL GIRL
 
A305_A2_file_Batkhuu progress report.pdf
A305_A2_file_Batkhuu progress report.pdfA305_A2_file_Batkhuu progress report.pdf
A305_A2_file_Batkhuu progress report.pdf
 
Pharma Works Profile of Karan Communications
Pharma Works Profile of Karan CommunicationsPharma Works Profile of Karan Communications
Pharma Works Profile of Karan Communications
 
Regression analysis: Simple Linear Regression Multiple Linear Regression
Regression analysis:  Simple Linear Regression Multiple Linear RegressionRegression analysis:  Simple Linear Regression Multiple Linear Regression
Regression analysis: Simple Linear Regression Multiple Linear Regression
 
Unlocking the Secrets of Affiliate Marketing.pdf
Unlocking the Secrets of Affiliate Marketing.pdfUnlocking the Secrets of Affiliate Marketing.pdf
Unlocking the Secrets of Affiliate Marketing.pdf
 
VVVIP Call Girls In Greater Kailash ➡️ Delhi ➡️ 9999965857 🚀 No Advance 24HRS...
VVVIP Call Girls In Greater Kailash ➡️ Delhi ➡️ 9999965857 🚀 No Advance 24HRS...VVVIP Call Girls In Greater Kailash ➡️ Delhi ➡️ 9999965857 🚀 No Advance 24HRS...
VVVIP Call Girls In Greater Kailash ➡️ Delhi ➡️ 9999965857 🚀 No Advance 24HRS...
 
9599632723 Top Call Girls in Delhi at your Door Step Available 24x7 Delhi
9599632723 Top Call Girls in Delhi at your Door Step Available 24x7 Delhi9599632723 Top Call Girls in Delhi at your Door Step Available 24x7 Delhi
9599632723 Top Call Girls in Delhi at your Door Step Available 24x7 Delhi
 
Progress Report - Oracle Database Analyst Summit
Progress  Report - Oracle Database Analyst SummitProgress  Report - Oracle Database Analyst Summit
Progress Report - Oracle Database Analyst Summit
 
Best Basmati Rice Manufacturers in India
Best Basmati Rice Manufacturers in IndiaBest Basmati Rice Manufacturers in India
Best Basmati Rice Manufacturers in India
 
Mondelez State of Snacking and Future Trends 2023
Mondelez State of Snacking and Future Trends 2023Mondelez State of Snacking and Future Trends 2023
Mondelez State of Snacking and Future Trends 2023
 
Enhancing and Restoring Safety & Quality Cultures - Dave Litwiller - May 2024...
Enhancing and Restoring Safety & Quality Cultures - Dave Litwiller - May 2024...Enhancing and Restoring Safety & Quality Cultures - Dave Litwiller - May 2024...
Enhancing and Restoring Safety & Quality Cultures - Dave Litwiller - May 2024...
 
M.C Lodges -- Guest House in Jhang.
M.C Lodges --  Guest House in Jhang.M.C Lodges --  Guest House in Jhang.
M.C Lodges -- Guest House in Jhang.
 
7.pdf This presentation captures many uses and the significance of the number...
7.pdf This presentation captures many uses and the significance of the number...7.pdf This presentation captures many uses and the significance of the number...
7.pdf This presentation captures many uses and the significance of the number...
 
Ensure the security of your HCL environment by applying the Zero Trust princi...
Ensure the security of your HCL environment by applying the Zero Trust princi...Ensure the security of your HCL environment by applying the Zero Trust princi...
Ensure the security of your HCL environment by applying the Zero Trust princi...
 
Cracking the Cultural Competence Code.pptx
Cracking the Cultural Competence Code.pptxCracking the Cultural Competence Code.pptx
Cracking the Cultural Competence Code.pptx
 
Mysore Call Girls 8617370543 WhatsApp Number 24x7 Best Services
Mysore Call Girls 8617370543 WhatsApp Number 24x7 Best ServicesMysore Call Girls 8617370543 WhatsApp Number 24x7 Best Services
Mysore Call Girls 8617370543 WhatsApp Number 24x7 Best Services
 
Monthly Social Media Update April 2024 pptx.pptx
Monthly Social Media Update April 2024 pptx.pptxMonthly Social Media Update April 2024 pptx.pptx
Monthly Social Media Update April 2024 pptx.pptx
 

Cause and effect analysis

  • 1. Cause and Effect Analysis Amit Shrivastava Hyderabad, India.
  • 2. History  Cause and Effect Analysis was devised by professor Kaoru Ishikawa, a pioneer of quality management, in the 1960s. The technique was then published in his 1990 book, "Introduction to Quality Control.“  The diagrams that we create, are known as Ishikawa Diagrams or Fishbone Diagrams
  • 3. This is used to:  Discover the root cause of a problem  Uncover bottlenecks in the process  Identify where and why the process isn't working
  • 4. Key Points The technique uses a diagram-based approach for thinking through all of the possible causes of a problem. This helps to carry out a thorough analysis of the situation.
  • 5. Steps to use this Tool  Identify the Problems  Work out the Major Factors Involved  Identify Possible Causes  Analyze the Diagram
  • 6. Step 1: Identify the Problem  Write down the exact problem we face, i.e., the “EFFECT" to be diagrammed  Draw a box around the effect with an arrow heading to it EFFECT
  • 7. Step 2: Work Out the Major Factors Involved  Identify the factors that may be the part of the problem  Write down all the factors on the diagram Instructions Duplicates Commercials Listening
  • 8. Step 3: Identify Possible Causes  For each of the factors, brainstorm possible causes of the problem that may be related to the factor  Show these possible causes coming off the "bones" of the diagram
  • 9.
  • 10. Step 4: Analyze the Diagram  We have a diagram, that shows all of the possible causes of the problem that we can think of  We can now investigate the most likely causes further