SlideShare una empresa de Scribd logo
1 de 17
Course 3, Lesson 4-5
Use the make a table strategy to solve Exercises 1 and 2.
1. Karl is going to increase the number of jumping jacks he does
each week by 5. If in the sixth week he is doing 85 jumping jacks,
how many jumping jacks will he do in the third week?
2. Anna has $25 in her piggy bank. She is planning on adding $2.50
to her bank each week. In how many weeks will she have saved
$42.50?
3. Neil has already collected a certain number of canned goods.
Each day he plans to collect 15 more cans. If by the fifth day he
has collected 165 cans, how many cans did he originally collect?
Course 3, Lesson 4-5
ANSWERS
1. 70
2. 7 weeks
3. 90
HOW can we model relationships
between quantities?
Functions
Course 3, Lesson 4-5
Course 3, Lesson 4-5 Common Core State Standards © Copyright 2010. National Governors Association Center for Best Practices and Council
of Chief State School Officers. All rights reserved.
Functions
• 8.F.2
Compare properties of two functions each represented in a different way
(algebraically, graphically, numerically in tables, or by verbal
descriptions).
• 8.F.4
Construct a function to model linear relationship between two quantities.
Determine the rate of change and initial value of the function from a
description of a relationship or from two (x, y) values, including reading
these from a table or from a graph. Interpret the rate of change and initial
value of a linear function in terms of the situation it models, and in terms
of its graph or a table of values.
Course 3, Lesson 4-5 Common Core State Standards © Copyright 2010. National Governors Association Center for Best Practices and
Council of Chief State School Officers. All rights reserved.
Functions
Mathematical Practices
1 Make sense of problems and persevere in solving them.
2 Reason abstractly and quantitatively.
3 Construct viable arguments and critique the reasoning of others.
4 Model with mathematics.
To
• compare two functions
represented in different forms
Course 3, Lesson 4-5
Functions
1
Need Another Example?
2
3
4
5
Step-by-Step Example
1. A zebra’s main predator is a lion. Lions can
run at a speed of 53 feet per second over
short distances. The graph at the right shows
the speed of a zebra. Compare their speeds.
To compare their speeds, compare the rates of change.
A zebra can travel at a rate of 59 feet per second. Since 59 > 53,
the speed of a zebra is greater than the speed of a lion.
A lion can travel at a rate of 53 feet per second.
To find the rate of change for a zebra, choose two points
on the line and find the rate of change between them.
Answer
Need Another Example?
The flow rate of water in a water
garden is 52 gallons per minute.
The graph shows the flow rate of
water in a Koi pond. Compare
the functions by comparing their
rates of change.
The water garden has a flow rate of 52 gallons
per minute and the Koi pond has flow rate of 60
gallons per minute. The water in the Koi pond
has a greater rate of change.
1
Need Another Example?
2
3
4
5 6
Step-by-Step Example
2. The function m = 140h, where m is the miles traveled in h hours,
represents the speed of the first Japanese high speed train. The
speed of a high speed train operating today in China is shown in the
table. Assume the relationship between the two quantities is linear.
Compare the y-intercepts.
Since 217 > 140, the function representing the Chinese high speed
train has a greater rate of change than the function representing the
Japanese high speed train.
Compare the rates of change.
Use the table to find the speed of the Chinese train.
a. Compare the functions’ y-intercepts and rates of change.
The speed of the Chinese train is or 217 miles per hour.
Find the distance on the
Japanese train.
m = 140h
m = 140(5)
m = 140h
Write the function.
Replace h with 5.
Simplify.
b. If you ride each train for 5 hours, how far will you travel on each?
7 You will travel 700 miles in 5 hours on the Japanese train.
Find the distance on the Chinese train by extending the table.
You will travel 1,085 miles in 5 hours on the Chinese train.
At 0 hours, no distance has been covered.
So, the y-intercepts are the same, 0.
The speed of the Japanese train is 140 miles per hour.
Answer
Need Another Example?
A bowling alley offers different birthday party
packages. Package A is represented by the
function c = 7p + 5, where c is the total cost
and p is the number of people. Package B is
represented in the table to the right.
a.
b.
Compare the functions by comparing their
y-intercepts and rates of change.
How much more will Package B cost than
Package A if there are 12 people at the
birthday party?
The function for Package A has a y-intercept of 5
and the function for Package B has a y-intercept
of 0. Package A costs $7 per person and
Package B costs $9 per person. The rate of
change for Package B is greater.
$19 more
1
Need Another Example?
2
3
4
5
6
Step-by-Step Example
3. Financial Literacy Angela and Benjamin each have a monthly
cell phone bill. Angela’s monthly cell phone bill is represented
by the function y = 0.15x + 49, where x represents the minutes
and y represents the cost. Benjamin’s monthly cost is shown
in the graph.
The rate of change for Angela’s monthly bill is $0.15 per minute.
Find the rate of change for Benjamin's bill.
a. Compare the y-intercepts and rates of change.
Angela’s monthly cost is represented by y = 0.15x + 49.
At 200 minutes, Angela will pay 0.15(200) + 49 or $79.
b. If you ride each train for 5 hours, how far will you travel on each?
The rate of change for Benjamin’s bill is $0.10 per minute.
So, Angela pays more per minute than Benjamin.
Use the graph to find Benjamin's cost. At 200 minutes,
Benjamin will pay $80.
The function for Angela’s bill has a y-intercept of 49. You can see from the graph that the
function for Benjamin’s bill has a y-intercept of 60. So, Benjamin has a greater initial cost.
Answer
Need Another Example?
The total cost c to rent any number of
movies m from an online movie rental
company is represented by the function
c = 1.5m + 5. The cost to rent movies
from a different online rental company is
shown in the graph.
a.
b.
Compare the y-intercepts and rates of change.
What will be the cost from each company
if 15 movies are rented in one month?
The function for the first company has a y-intercept of 5
and a rate of change of 1.5. The function for the second
company has a y-intercept of 4 and a rate of change of
2. The y-intercept for the first company is greater than
the y-intercept for the second company but the rate of
change for the first company is less than the rate of
change for the second company.
first company: $27.50; second company: $34
1
Need Another Example?
2
3
4
Step-by-Step Example
4. Financial Literacy Lorena’s mother
needs to rent a truck to move some
furniture. The cost to rent a truck
from two different companies is
shown in the table and graph.
Which company should she use
to rent the truck for 40 miles?
After 40 miles, the cost will be $75 + $25 or $100.
Find the cost of renting a truck from
Ron’s Rentals by extending the table.
The equation y = 0.5x + 30 where y represents the total cost and x represents
the miles driven can be used to find the total cost of renting the truck. After 40
miles, the cost will be 0.5(40) + 30 or $50. So, Cross Town Movers would cost
less for 40 miles.
10 25
20 50
30 75
The slope or rate of change is or 0.5.
Find the cost of renting a truck from Cross Town Movers by
analyzing the graph. The y-intercept of the graph is 30.
Answer
Need Another Example?
The eighth grade class is selling pizzas and
subs for a fundraiser. The amount of money they
earn selling pizzas is shown in the table below.
The amount of money they earn selling sub
sandwiches can be represented by the function
m = 4s, where m is the total amount of money
earned and s is the number of sub sandwiches
sold. Which food will the students earn more
money selling if they sell 100 of each item?
pizzas; The students will receive 4(100) or $400
for selling 100 subs, but will earn $500 for selling
100 pizzas.
How did what you learned
today help you answer the
HOW can we model relationships
between quantities?
Course 3, Lesson 4-5
Functions
How did what you learned
today help you answer the
HOW can we model relationships
between quantities?
Course 3, Lesson 4-5
Functions
Sample answers:
• Functions that are represented in different ways (table,
graph, equation, or words) can be compared.
• You can find the slopes of the different functions to
compare their rates of change.
• You can find the y-intercepts of different functions to
compare their initial values.
Create a table of data that
has a constant rate of change.
Find another table of data in
your book. Then compare your
function with the one in the
book by comparing their rates
of change.
Ratios and Proportional RelationshipsFunctions
Course 3, Lesson 4-5

Más contenido relacionado

La actualidad más candente

Guía+torque,+momentum+y+trabajo
Guía+torque,+momentum+y+trabajoGuía+torque,+momentum+y+trabajo
Guía+torque,+momentum+y+trabajozatrah17
 
Ecuaciones Diferenciales Un Método Numérico
Ecuaciones Diferenciales Un Método NuméricoEcuaciones Diferenciales Un Método Numérico
Ecuaciones Diferenciales Un Método NuméricoByron Ochoa
 
Teorema do valor intermediário - Análise Real
Teorema do valor intermediário - Análise RealTeorema do valor intermediário - Análise Real
Teorema do valor intermediário - Análise RealZaqueu Oliveira
 
Similarity of Figures-COT.pptx
Similarity of Figures-COT.pptxSimilarity of Figures-COT.pptx
Similarity of Figures-COT.pptxjoemarpangue1
 
(8) Lesson 7.5 - Similar Triangles and Indirect measurement
(8) Lesson 7.5 - Similar Triangles and Indirect measurement(8) Lesson 7.5 - Similar Triangles and Indirect measurement
(8) Lesson 7.5 - Similar Triangles and Indirect measurementwzuri
 
Guia semejanza, thales y euclides
Guia semejanza, thales y euclidesGuia semejanza, thales y euclides
Guia semejanza, thales y euclidescardiaz129
 
Area of a trapezoid
Area of a trapezoidArea of a trapezoid
Area of a trapezoidNCVPS
 
Demostración Propiedades de determinantes
Demostración Propiedades de determinantesDemostración Propiedades de determinantes
Demostración Propiedades de determinantesVictor Abundio
 
Math 6 - Application of Percent (Commission, Simple Interest, Percent of Incr...
Math 6 - Application of Percent (Commission, Simple Interest, Percent of Incr...Math 6 - Application of Percent (Commission, Simple Interest, Percent of Incr...
Math 6 - Application of Percent (Commission, Simple Interest, Percent of Incr...menchreo
 
Limits Quiz ReVIEW SOLUTION KEY.pdf
Limits Quiz ReVIEW SOLUTION KEY.pdfLimits Quiz ReVIEW SOLUTION KEY.pdf
Limits Quiz ReVIEW SOLUTION KEY.pdfCharlize26
 
Teselados en distintos campos del saber
Teselados en distintos campos del saberTeselados en distintos campos del saber
Teselados en distintos campos del saberloscuentosdenora
 
Solving Problems Involving Measures of Position (Quartiles).docx
Solving Problems Involving Measures of Position (Quartiles).docxSolving Problems Involving Measures of Position (Quartiles).docx
Solving Problems Involving Measures of Position (Quartiles).docxNelsonNelson56
 
Lista de exercícios racionalização e semelhança de triângulos
Lista de exercícios racionalização e semelhança de triângulosLista de exercícios racionalização e semelhança de triângulos
Lista de exercícios racionalização e semelhança de triângulosMichele Boulanger
 
48 potencias, ecuación exponencial, función exponencial
48 potencias, ecuación exponencial, función exponencial48 potencias, ecuación exponencial, función exponencial
48 potencias, ecuación exponencial, función exponencialMarcelo Calderón
 

La actualidad más candente (20)

Guía+torque,+momentum+y+trabajo
Guía+torque,+momentum+y+trabajoGuía+torque,+momentum+y+trabajo
Guía+torque,+momentum+y+trabajo
 
Ecuaciones Diferenciales Un Método Numérico
Ecuaciones Diferenciales Un Método NuméricoEcuaciones Diferenciales Un Método Numérico
Ecuaciones Diferenciales Un Método Numérico
 
Teorema do valor intermediário - Análise Real
Teorema do valor intermediário - Análise RealTeorema do valor intermediário - Análise Real
Teorema do valor intermediário - Análise Real
 
Actividad n 01 mecanica1
Actividad n 01 mecanica1Actividad n 01 mecanica1
Actividad n 01 mecanica1
 
Similarity of Figures-COT.pptx
Similarity of Figures-COT.pptxSimilarity of Figures-COT.pptx
Similarity of Figures-COT.pptx
 
(8) Lesson 7.5 - Similar Triangles and Indirect measurement
(8) Lesson 7.5 - Similar Triangles and Indirect measurement(8) Lesson 7.5 - Similar Triangles and Indirect measurement
(8) Lesson 7.5 - Similar Triangles and Indirect measurement
 
Guia semejanza, thales y euclides
Guia semejanza, thales y euclidesGuia semejanza, thales y euclides
Guia semejanza, thales y euclides
 
MRU Y MRUA.pptx
MRU Y MRUA.pptxMRU Y MRUA.pptx
MRU Y MRUA.pptx
 
Equação geral da reta
Equação geral da retaEquação geral da reta
Equação geral da reta
 
Area of a trapezoid
Area of a trapezoidArea of a trapezoid
Area of a trapezoid
 
Demostración Propiedades de determinantes
Demostración Propiedades de determinantesDemostración Propiedades de determinantes
Demostración Propiedades de determinantes
 
Math 6 - Application of Percent (Commission, Simple Interest, Percent of Incr...
Math 6 - Application of Percent (Commission, Simple Interest, Percent of Incr...Math 6 - Application of Percent (Commission, Simple Interest, Percent of Incr...
Math 6 - Application of Percent (Commission, Simple Interest, Percent of Incr...
 
Ecuaciones exponenciales
Ecuaciones exponencialesEcuaciones exponenciales
Ecuaciones exponenciales
 
Limits Quiz ReVIEW SOLUTION KEY.pdf
Limits Quiz ReVIEW SOLUTION KEY.pdfLimits Quiz ReVIEW SOLUTION KEY.pdf
Limits Quiz ReVIEW SOLUTION KEY.pdf
 
Teselados en distintos campos del saber
Teselados en distintos campos del saberTeselados en distintos campos del saber
Teselados en distintos campos del saber
 
ALEACIONES Y MEZCLAS
ALEACIONES Y MEZCLASALEACIONES Y MEZCLAS
ALEACIONES Y MEZCLAS
 
Solving Problems Involving Measures of Position (Quartiles).docx
Solving Problems Involving Measures of Position (Quartiles).docxSolving Problems Involving Measures of Position (Quartiles).docx
Solving Problems Involving Measures of Position (Quartiles).docx
 
23 ángulos y triangulos
23 ángulos y triangulos23 ángulos y triangulos
23 ángulos y triangulos
 
Lista de exercícios racionalização e semelhança de triângulos
Lista de exercícios racionalização e semelhança de triângulosLista de exercícios racionalização e semelhança de triângulos
Lista de exercícios racionalização e semelhança de triângulos
 
48 potencias, ecuación exponencial, función exponencial
48 potencias, ecuación exponencial, función exponencial48 potencias, ecuación exponencial, función exponencial
48 potencias, ecuación exponencial, función exponencial
 

Similar a (8) Lesson 4.5

(8) Chapter 4 Study Guide
(8) Chapter 4 Study Guide(8) Chapter 4 Study Guide
(8) Chapter 4 Study Guidewzuri
 
(7) Lesson 1.7 - Constant Rate of Change
(7) Lesson 1.7 - Constant Rate of Change(7) Lesson 1.7 - Constant Rate of Change
(7) Lesson 1.7 - Constant Rate of Changewzuri
 
(8) Lesson 4.1
(8) Lesson 4.1(8) Lesson 4.1
(8) Lesson 4.1wzuri
 
Module 3 linear functions
Module 3   linear functionsModule 3   linear functions
Module 3 linear functionsdionesioable
 
© K12 Inc. Assignment Shopping List Using Multi-Step Eq.docx
© K12 Inc. Assignment Shopping List Using Multi-Step Eq.docx© K12 Inc. Assignment Shopping List Using Multi-Step Eq.docx
© K12 Inc. Assignment Shopping List Using Multi-Step Eq.docxLynellBull52
 
(8) Lesson 4.6
(8) Lesson 4.6(8) Lesson 4.6
(8) Lesson 4.6wzuri
 
Proportionality and percentage
Proportionality and percentageProportionality and percentage
Proportionality and percentageEducación
 
Proportionality and percentage
Proportionality and percentageProportionality and percentage
Proportionality and percentageEducación
 
G6 m1-c-lesson 17-t
G6 m1-c-lesson 17-tG6 m1-c-lesson 17-t
G6 m1-c-lesson 17-tmlabuski
 
Algebra 1 Honors Chaper 4
Algebra 1 Honors Chaper 4Algebra 1 Honors Chaper 4
Algebra 1 Honors Chaper 4guest8c77631
 
(8) Lesson 3.3
(8) Lesson 3.3(8) Lesson 3.3
(8) Lesson 3.3wzuri
 
(7) Lesson 1.8 - Slope
(7) Lesson 1.8 - Slope(7) Lesson 1.8 - Slope
(7) Lesson 1.8 - Slopewzuri
 
(7) Lesson 1.3 - Convert Unit Rates
(7) Lesson 1.3 - Convert Unit Rates(7) Lesson 1.3 - Convert Unit Rates
(7) Lesson 1.3 - Convert Unit Rateswzuri
 
(8) Lesson 4.9
(8) Lesson 4.9(8) Lesson 4.9
(8) Lesson 4.9wzuri
 
(7) Lesson 1.4 - Proportional and Nonproportional Relationships
(7) Lesson 1.4 - Proportional and Nonproportional Relationships(7) Lesson 1.4 - Proportional and Nonproportional Relationships
(7) Lesson 1.4 - Proportional and Nonproportional Relationshipswzuri
 
Chapter 3
Chapter 3Chapter 3
Chapter 3wzuri
 
Lively Applications Examples
Lively Applications ExamplesLively Applications Examples
Lively Applications ExamplesReva Narasimhan
 
NCV 3 Mathematical Literacy Hands-On Support Slide Show - Module 3
NCV 3 Mathematical Literacy Hands-On Support Slide Show - Module 3NCV 3 Mathematical Literacy Hands-On Support Slide Show - Module 3
NCV 3 Mathematical Literacy Hands-On Support Slide Show - Module 3Future Managers
 
(8) Lesson 4.7
(8) Lesson 4.7(8) Lesson 4.7
(8) Lesson 4.7wzuri
 

Similar a (8) Lesson 4.5 (20)

(8) Chapter 4 Study Guide
(8) Chapter 4 Study Guide(8) Chapter 4 Study Guide
(8) Chapter 4 Study Guide
 
(7) Lesson 1.7 - Constant Rate of Change
(7) Lesson 1.7 - Constant Rate of Change(7) Lesson 1.7 - Constant Rate of Change
(7) Lesson 1.7 - Constant Rate of Change
 
(8) Lesson 4.1
(8) Lesson 4.1(8) Lesson 4.1
(8) Lesson 4.1
 
Module 3 linear functions
Module 3   linear functionsModule 3   linear functions
Module 3 linear functions
 
© K12 Inc. Assignment Shopping List Using Multi-Step Eq.docx
© K12 Inc. Assignment Shopping List Using Multi-Step Eq.docx© K12 Inc. Assignment Shopping List Using Multi-Step Eq.docx
© K12 Inc. Assignment Shopping List Using Multi-Step Eq.docx
 
(8) Lesson 4.6
(8) Lesson 4.6(8) Lesson 4.6
(8) Lesson 4.6
 
Proportionality and percentage
Proportionality and percentageProportionality and percentage
Proportionality and percentage
 
Proportionality and percentage
Proportionality and percentageProportionality and percentage
Proportionality and percentage
 
G6 m1-c-lesson 17-t
G6 m1-c-lesson 17-tG6 m1-c-lesson 17-t
G6 m1-c-lesson 17-t
 
Algebra 1 Honors Chaper 4
Algebra 1 Honors Chaper 4Algebra 1 Honors Chaper 4
Algebra 1 Honors Chaper 4
 
(8) Lesson 3.3
(8) Lesson 3.3(8) Lesson 3.3
(8) Lesson 3.3
 
(7) Lesson 1.8 - Slope
(7) Lesson 1.8 - Slope(7) Lesson 1.8 - Slope
(7) Lesson 1.8 - Slope
 
(7) Lesson 1.3 - Convert Unit Rates
(7) Lesson 1.3 - Convert Unit Rates(7) Lesson 1.3 - Convert Unit Rates
(7) Lesson 1.3 - Convert Unit Rates
 
(8) Lesson 4.9
(8) Lesson 4.9(8) Lesson 4.9
(8) Lesson 4.9
 
(7) Lesson 1.4 - Proportional and Nonproportional Relationships
(7) Lesson 1.4 - Proportional and Nonproportional Relationships(7) Lesson 1.4 - Proportional and Nonproportional Relationships
(7) Lesson 1.4 - Proportional and Nonproportional Relationships
 
Chapter 3
Chapter 3Chapter 3
Chapter 3
 
Math 116 pres. 4
Math 116 pres. 4Math 116 pres. 4
Math 116 pres. 4
 
Lively Applications Examples
Lively Applications ExamplesLively Applications Examples
Lively Applications Examples
 
NCV 3 Mathematical Literacy Hands-On Support Slide Show - Module 3
NCV 3 Mathematical Literacy Hands-On Support Slide Show - Module 3NCV 3 Mathematical Literacy Hands-On Support Slide Show - Module 3
NCV 3 Mathematical Literacy Hands-On Support Slide Show - Module 3
 
(8) Lesson 4.7
(8) Lesson 4.7(8) Lesson 4.7
(8) Lesson 4.7
 

Más de wzuri

Chapter 2 inquiry_lab_presentation_course_3 (1)
Chapter 2 inquiry_lab_presentation_course_3 (1)Chapter 2 inquiry_lab_presentation_course_3 (1)
Chapter 2 inquiry_lab_presentation_course_3 (1)wzuri
 
Chapter 2 Review
Chapter 2 ReviewChapter 2 Review
Chapter 2 Reviewwzuri
 
Chapter 2 lesson_4_presentation_course_3
Chapter 2 lesson_4_presentation_course_3Chapter 2 lesson_4_presentation_course_3
Chapter 2 lesson_4_presentation_course_3wzuri
 
Chapter 5
Chapter 5Chapter 5
Chapter 5wzuri
 
Lesson 5.1
Lesson 5.1Lesson 5.1
Lesson 5.1wzuri
 
Lesson 1.8 grade 8
Lesson 1.8   grade 8Lesson 1.8   grade 8
Lesson 1.8 grade 8wzuri
 
Chapter 7
Chapter 7Chapter 7
Chapter 7wzuri
 
Lesson 7.4
Lesson 7.4Lesson 7.4
Lesson 7.4wzuri
 
Lesson 7.3 (8)
Lesson 7.3 (8)Lesson 7.3 (8)
Lesson 7.3 (8)wzuri
 
Lesson 7.2
Lesson 7.2Lesson 7.2
Lesson 7.2wzuri
 
Pat05 ppt 0201
Pat05 ppt 0201Pat05 ppt 0201
Pat05 ppt 0201wzuri
 
Chapter 6
Chapter 6Chapter 6
Chapter 6wzuri
 
Pat05 ppt 0106
Pat05 ppt 0106Pat05 ppt 0106
Pat05 ppt 0106wzuri
 
Pat05 ppt 0105
Pat05 ppt 0105Pat05 ppt 0105
Pat05 ppt 0105wzuri
 
Chapter 1 Review
Chapter 1 ReviewChapter 1 Review
Chapter 1 Reviewwzuri
 
Lesson 1.10 grade 8
Lesson 1.10   grade 8Lesson 1.10   grade 8
Lesson 1.10 grade 8wzuri
 
Lesson 1.9 grade 8
Lesson 1.9   grade 8Lesson 1.9   grade 8
Lesson 1.9 grade 8wzuri
 
Lesson 1.7 grade 8
Lesson 1.7   grade 8Lesson 1.7   grade 8
Lesson 1.7 grade 8wzuri
 
Lesson 1.7 grade 8
Lesson 1.7   grade 8Lesson 1.7   grade 8
Lesson 1.7 grade 8wzuri
 
Lesson 1.6 (8)
Lesson 1.6 (8)Lesson 1.6 (8)
Lesson 1.6 (8)wzuri
 

Más de wzuri (20)

Chapter 2 inquiry_lab_presentation_course_3 (1)
Chapter 2 inquiry_lab_presentation_course_3 (1)Chapter 2 inquiry_lab_presentation_course_3 (1)
Chapter 2 inquiry_lab_presentation_course_3 (1)
 
Chapter 2 Review
Chapter 2 ReviewChapter 2 Review
Chapter 2 Review
 
Chapter 2 lesson_4_presentation_course_3
Chapter 2 lesson_4_presentation_course_3Chapter 2 lesson_4_presentation_course_3
Chapter 2 lesson_4_presentation_course_3
 
Chapter 5
Chapter 5Chapter 5
Chapter 5
 
Lesson 5.1
Lesson 5.1Lesson 5.1
Lesson 5.1
 
Lesson 1.8 grade 8
Lesson 1.8   grade 8Lesson 1.8   grade 8
Lesson 1.8 grade 8
 
Chapter 7
Chapter 7Chapter 7
Chapter 7
 
Lesson 7.4
Lesson 7.4Lesson 7.4
Lesson 7.4
 
Lesson 7.3 (8)
Lesson 7.3 (8)Lesson 7.3 (8)
Lesson 7.3 (8)
 
Lesson 7.2
Lesson 7.2Lesson 7.2
Lesson 7.2
 
Pat05 ppt 0201
Pat05 ppt 0201Pat05 ppt 0201
Pat05 ppt 0201
 
Chapter 6
Chapter 6Chapter 6
Chapter 6
 
Pat05 ppt 0106
Pat05 ppt 0106Pat05 ppt 0106
Pat05 ppt 0106
 
Pat05 ppt 0105
Pat05 ppt 0105Pat05 ppt 0105
Pat05 ppt 0105
 
Chapter 1 Review
Chapter 1 ReviewChapter 1 Review
Chapter 1 Review
 
Lesson 1.10 grade 8
Lesson 1.10   grade 8Lesson 1.10   grade 8
Lesson 1.10 grade 8
 
Lesson 1.9 grade 8
Lesson 1.9   grade 8Lesson 1.9   grade 8
Lesson 1.9 grade 8
 
Lesson 1.7 grade 8
Lesson 1.7   grade 8Lesson 1.7   grade 8
Lesson 1.7 grade 8
 
Lesson 1.7 grade 8
Lesson 1.7   grade 8Lesson 1.7   grade 8
Lesson 1.7 grade 8
 
Lesson 1.6 (8)
Lesson 1.6 (8)Lesson 1.6 (8)
Lesson 1.6 (8)
 

Último

Z Score,T Score, Percential Rank and Box Plot Graph
Z Score,T Score, Percential Rank and Box Plot GraphZ Score,T Score, Percential Rank and Box Plot Graph
Z Score,T Score, Percential Rank and Box Plot GraphThiyagu K
 
Industrial Policy - 1948, 1956, 1973, 1977, 1980, 1991
Industrial Policy - 1948, 1956, 1973, 1977, 1980, 1991Industrial Policy - 1948, 1956, 1973, 1977, 1980, 1991
Industrial Policy - 1948, 1956, 1973, 1977, 1980, 1991RKavithamani
 
Introduction to ArtificiaI Intelligence in Higher Education
Introduction to ArtificiaI Intelligence in Higher EducationIntroduction to ArtificiaI Intelligence in Higher Education
Introduction to ArtificiaI Intelligence in Higher Educationpboyjonauth
 
A Critique of the Proposed National Education Policy Reform
A Critique of the Proposed National Education Policy ReformA Critique of the Proposed National Education Policy Reform
A Critique of the Proposed National Education Policy ReformChameera Dedduwage
 
Student login on Anyboli platform.helpin
Student login on Anyboli platform.helpinStudent login on Anyboli platform.helpin
Student login on Anyboli platform.helpinRaunakKeshri1
 
Interactive Powerpoint_How to Master effective communication
Interactive Powerpoint_How to Master effective communicationInteractive Powerpoint_How to Master effective communication
Interactive Powerpoint_How to Master effective communicationnomboosow
 
Activity 01 - Artificial Culture (1).pdf
Activity 01 - Artificial Culture (1).pdfActivity 01 - Artificial Culture (1).pdf
Activity 01 - Artificial Culture (1).pdfciinovamais
 
The basics of sentences session 2pptx copy.pptx
The basics of sentences session 2pptx copy.pptxThe basics of sentences session 2pptx copy.pptx
The basics of sentences session 2pptx copy.pptxheathfieldcps1
 
Sanyam Choudhary Chemistry practical.pdf
Sanyam Choudhary Chemistry practical.pdfSanyam Choudhary Chemistry practical.pdf
Sanyam Choudhary Chemistry practical.pdfsanyamsingh5019
 
Nutritional Needs Presentation - HLTH 104
Nutritional Needs Presentation - HLTH 104Nutritional Needs Presentation - HLTH 104
Nutritional Needs Presentation - HLTH 104misteraugie
 
Contemporary philippine arts from the regions_PPT_Module_12 [Autosaved] (1).pptx
Contemporary philippine arts from the regions_PPT_Module_12 [Autosaved] (1).pptxContemporary philippine arts from the regions_PPT_Module_12 [Autosaved] (1).pptx
Contemporary philippine arts from the regions_PPT_Module_12 [Autosaved] (1).pptxRoyAbrique
 
Q4-W6-Restating Informational Text Grade 3
Q4-W6-Restating Informational Text Grade 3Q4-W6-Restating Informational Text Grade 3
Q4-W6-Restating Informational Text Grade 3JemimahLaneBuaron
 
Presentation by Andreas Schleicher Tackling the School Absenteeism Crisis 30 ...
Presentation by Andreas Schleicher Tackling the School Absenteeism Crisis 30 ...Presentation by Andreas Schleicher Tackling the School Absenteeism Crisis 30 ...
Presentation by Andreas Schleicher Tackling the School Absenteeism Crisis 30 ...EduSkills OECD
 
Beyond the EU: DORA and NIS 2 Directive's Global Impact
Beyond the EU: DORA and NIS 2 Directive's Global ImpactBeyond the EU: DORA and NIS 2 Directive's Global Impact
Beyond the EU: DORA and NIS 2 Directive's Global ImpactPECB
 
Employee wellbeing at the workplace.pptx
Employee wellbeing at the workplace.pptxEmployee wellbeing at the workplace.pptx
Employee wellbeing at the workplace.pptxNirmalaLoungPoorunde1
 
Arihant handbook biology for class 11 .pdf
Arihant handbook biology for class 11 .pdfArihant handbook biology for class 11 .pdf
Arihant handbook biology for class 11 .pdfchloefrazer622
 
Organic Name Reactions for the students and aspirants of Chemistry12th.pptx
Organic Name Reactions  for the students and aspirants of Chemistry12th.pptxOrganic Name Reactions  for the students and aspirants of Chemistry12th.pptx
Organic Name Reactions for the students and aspirants of Chemistry12th.pptxVS Mahajan Coaching Centre
 
Paris 2024 Olympic Geographies - an activity
Paris 2024 Olympic Geographies - an activityParis 2024 Olympic Geographies - an activity
Paris 2024 Olympic Geographies - an activityGeoBlogs
 

Último (20)

Z Score,T Score, Percential Rank and Box Plot Graph
Z Score,T Score, Percential Rank and Box Plot GraphZ Score,T Score, Percential Rank and Box Plot Graph
Z Score,T Score, Percential Rank and Box Plot Graph
 
Industrial Policy - 1948, 1956, 1973, 1977, 1980, 1991
Industrial Policy - 1948, 1956, 1973, 1977, 1980, 1991Industrial Policy - 1948, 1956, 1973, 1977, 1980, 1991
Industrial Policy - 1948, 1956, 1973, 1977, 1980, 1991
 
Introduction to ArtificiaI Intelligence in Higher Education
Introduction to ArtificiaI Intelligence in Higher EducationIntroduction to ArtificiaI Intelligence in Higher Education
Introduction to ArtificiaI Intelligence in Higher Education
 
A Critique of the Proposed National Education Policy Reform
A Critique of the Proposed National Education Policy ReformA Critique of the Proposed National Education Policy Reform
A Critique of the Proposed National Education Policy Reform
 
Student login on Anyboli platform.helpin
Student login on Anyboli platform.helpinStudent login on Anyboli platform.helpin
Student login on Anyboli platform.helpin
 
Interactive Powerpoint_How to Master effective communication
Interactive Powerpoint_How to Master effective communicationInteractive Powerpoint_How to Master effective communication
Interactive Powerpoint_How to Master effective communication
 
Activity 01 - Artificial Culture (1).pdf
Activity 01 - Artificial Culture (1).pdfActivity 01 - Artificial Culture (1).pdf
Activity 01 - Artificial Culture (1).pdf
 
The basics of sentences session 2pptx copy.pptx
The basics of sentences session 2pptx copy.pptxThe basics of sentences session 2pptx copy.pptx
The basics of sentences session 2pptx copy.pptx
 
Sanyam Choudhary Chemistry practical.pdf
Sanyam Choudhary Chemistry practical.pdfSanyam Choudhary Chemistry practical.pdf
Sanyam Choudhary Chemistry practical.pdf
 
Nutritional Needs Presentation - HLTH 104
Nutritional Needs Presentation - HLTH 104Nutritional Needs Presentation - HLTH 104
Nutritional Needs Presentation - HLTH 104
 
Contemporary philippine arts from the regions_PPT_Module_12 [Autosaved] (1).pptx
Contemporary philippine arts from the regions_PPT_Module_12 [Autosaved] (1).pptxContemporary philippine arts from the regions_PPT_Module_12 [Autosaved] (1).pptx
Contemporary philippine arts from the regions_PPT_Module_12 [Autosaved] (1).pptx
 
Mattingly "AI & Prompt Design: Structured Data, Assistants, & RAG"
Mattingly "AI & Prompt Design: Structured Data, Assistants, & RAG"Mattingly "AI & Prompt Design: Structured Data, Assistants, & RAG"
Mattingly "AI & Prompt Design: Structured Data, Assistants, & RAG"
 
Q4-W6-Restating Informational Text Grade 3
Q4-W6-Restating Informational Text Grade 3Q4-W6-Restating Informational Text Grade 3
Q4-W6-Restating Informational Text Grade 3
 
Presentation by Andreas Schleicher Tackling the School Absenteeism Crisis 30 ...
Presentation by Andreas Schleicher Tackling the School Absenteeism Crisis 30 ...Presentation by Andreas Schleicher Tackling the School Absenteeism Crisis 30 ...
Presentation by Andreas Schleicher Tackling the School Absenteeism Crisis 30 ...
 
Beyond the EU: DORA and NIS 2 Directive's Global Impact
Beyond the EU: DORA and NIS 2 Directive's Global ImpactBeyond the EU: DORA and NIS 2 Directive's Global Impact
Beyond the EU: DORA and NIS 2 Directive's Global Impact
 
Employee wellbeing at the workplace.pptx
Employee wellbeing at the workplace.pptxEmployee wellbeing at the workplace.pptx
Employee wellbeing at the workplace.pptx
 
TataKelola dan KamSiber Kecerdasan Buatan v022.pdf
TataKelola dan KamSiber Kecerdasan Buatan v022.pdfTataKelola dan KamSiber Kecerdasan Buatan v022.pdf
TataKelola dan KamSiber Kecerdasan Buatan v022.pdf
 
Arihant handbook biology for class 11 .pdf
Arihant handbook biology for class 11 .pdfArihant handbook biology for class 11 .pdf
Arihant handbook biology for class 11 .pdf
 
Organic Name Reactions for the students and aspirants of Chemistry12th.pptx
Organic Name Reactions  for the students and aspirants of Chemistry12th.pptxOrganic Name Reactions  for the students and aspirants of Chemistry12th.pptx
Organic Name Reactions for the students and aspirants of Chemistry12th.pptx
 
Paris 2024 Olympic Geographies - an activity
Paris 2024 Olympic Geographies - an activityParis 2024 Olympic Geographies - an activity
Paris 2024 Olympic Geographies - an activity
 

(8) Lesson 4.5

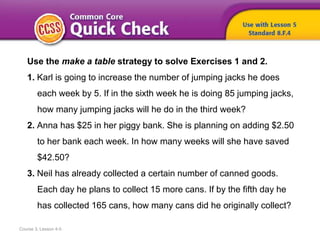
  • 1. Course 3, Lesson 4-5 Use the make a table strategy to solve Exercises 1 and 2. 1. Karl is going to increase the number of jumping jacks he does each week by 5. If in the sixth week he is doing 85 jumping jacks, how many jumping jacks will he do in the third week? 2. Anna has $25 in her piggy bank. She is planning on adding $2.50 to her bank each week. In how many weeks will she have saved $42.50? 3. Neil has already collected a certain number of canned goods. Each day he plans to collect 15 more cans. If by the fifth day he has collected 165 cans, how many cans did he originally collect?
  • 2. Course 3, Lesson 4-5 ANSWERS 1. 70 2. 7 weeks 3. 90
  • 3. HOW can we model relationships between quantities? Functions Course 3, Lesson 4-5
  • 4. Course 3, Lesson 4-5 Common Core State Standards © Copyright 2010. National Governors Association Center for Best Practices and Council of Chief State School Officers. All rights reserved. Functions • 8.F.2 Compare properties of two functions each represented in a different way (algebraically, graphically, numerically in tables, or by verbal descriptions). • 8.F.4 Construct a function to model linear relationship between two quantities. Determine the rate of change and initial value of the function from a description of a relationship or from two (x, y) values, including reading these from a table or from a graph. Interpret the rate of change and initial value of a linear function in terms of the situation it models, and in terms of its graph or a table of values.
  • 5. Course 3, Lesson 4-5 Common Core State Standards © Copyright 2010. National Governors Association Center for Best Practices and Council of Chief State School Officers. All rights reserved. Functions Mathematical Practices 1 Make sense of problems and persevere in solving them. 2 Reason abstractly and quantitatively. 3 Construct viable arguments and critique the reasoning of others. 4 Model with mathematics.
  • 6. To • compare two functions represented in different forms Course 3, Lesson 4-5 Functions
  • 7. 1 Need Another Example? 2 3 4 5 Step-by-Step Example 1. A zebra’s main predator is a lion. Lions can run at a speed of 53 feet per second over short distances. The graph at the right shows the speed of a zebra. Compare their speeds. To compare their speeds, compare the rates of change. A zebra can travel at a rate of 59 feet per second. Since 59 > 53, the speed of a zebra is greater than the speed of a lion. A lion can travel at a rate of 53 feet per second. To find the rate of change for a zebra, choose two points on the line and find the rate of change between them.
  • 8. Answer Need Another Example? The flow rate of water in a water garden is 52 gallons per minute. The graph shows the flow rate of water in a Koi pond. Compare the functions by comparing their rates of change. The water garden has a flow rate of 52 gallons per minute and the Koi pond has flow rate of 60 gallons per minute. The water in the Koi pond has a greater rate of change.
  • 9. 1 Need Another Example? 2 3 4 5 6 Step-by-Step Example 2. The function m = 140h, where m is the miles traveled in h hours, represents the speed of the first Japanese high speed train. The speed of a high speed train operating today in China is shown in the table. Assume the relationship between the two quantities is linear. Compare the y-intercepts. Since 217 > 140, the function representing the Chinese high speed train has a greater rate of change than the function representing the Japanese high speed train. Compare the rates of change. Use the table to find the speed of the Chinese train. a. Compare the functions’ y-intercepts and rates of change. The speed of the Chinese train is or 217 miles per hour. Find the distance on the Japanese train. m = 140h m = 140(5) m = 140h Write the function. Replace h with 5. Simplify. b. If you ride each train for 5 hours, how far will you travel on each? 7 You will travel 700 miles in 5 hours on the Japanese train. Find the distance on the Chinese train by extending the table. You will travel 1,085 miles in 5 hours on the Chinese train. At 0 hours, no distance has been covered. So, the y-intercepts are the same, 0. The speed of the Japanese train is 140 miles per hour.
  • 10. Answer Need Another Example? A bowling alley offers different birthday party packages. Package A is represented by the function c = 7p + 5, where c is the total cost and p is the number of people. Package B is represented in the table to the right. a. b. Compare the functions by comparing their y-intercepts and rates of change. How much more will Package B cost than Package A if there are 12 people at the birthday party? The function for Package A has a y-intercept of 5 and the function for Package B has a y-intercept of 0. Package A costs $7 per person and Package B costs $9 per person. The rate of change for Package B is greater. $19 more
  • 11. 1 Need Another Example? 2 3 4 5 6 Step-by-Step Example 3. Financial Literacy Angela and Benjamin each have a monthly cell phone bill. Angela’s monthly cell phone bill is represented by the function y = 0.15x + 49, where x represents the minutes and y represents the cost. Benjamin’s monthly cost is shown in the graph. The rate of change for Angela’s monthly bill is $0.15 per minute. Find the rate of change for Benjamin's bill. a. Compare the y-intercepts and rates of change. Angela’s monthly cost is represented by y = 0.15x + 49. At 200 minutes, Angela will pay 0.15(200) + 49 or $79. b. If you ride each train for 5 hours, how far will you travel on each? The rate of change for Benjamin’s bill is $0.10 per minute. So, Angela pays more per minute than Benjamin. Use the graph to find Benjamin's cost. At 200 minutes, Benjamin will pay $80. The function for Angela’s bill has a y-intercept of 49. You can see from the graph that the function for Benjamin’s bill has a y-intercept of 60. So, Benjamin has a greater initial cost.
  • 12. Answer Need Another Example? The total cost c to rent any number of movies m from an online movie rental company is represented by the function c = 1.5m + 5. The cost to rent movies from a different online rental company is shown in the graph. a. b. Compare the y-intercepts and rates of change. What will be the cost from each company if 15 movies are rented in one month? The function for the first company has a y-intercept of 5 and a rate of change of 1.5. The function for the second company has a y-intercept of 4 and a rate of change of 2. The y-intercept for the first company is greater than the y-intercept for the second company but the rate of change for the first company is less than the rate of change for the second company. first company: $27.50; second company: $34
  • 13. 1 Need Another Example? 2 3 4 Step-by-Step Example 4. Financial Literacy Lorena’s mother needs to rent a truck to move some furniture. The cost to rent a truck from two different companies is shown in the table and graph. Which company should she use to rent the truck for 40 miles? After 40 miles, the cost will be $75 + $25 or $100. Find the cost of renting a truck from Ron’s Rentals by extending the table. The equation y = 0.5x + 30 where y represents the total cost and x represents the miles driven can be used to find the total cost of renting the truck. After 40 miles, the cost will be 0.5(40) + 30 or $50. So, Cross Town Movers would cost less for 40 miles. 10 25 20 50 30 75 The slope or rate of change is or 0.5. Find the cost of renting a truck from Cross Town Movers by analyzing the graph. The y-intercept of the graph is 30.
  • 14. Answer Need Another Example? The eighth grade class is selling pizzas and subs for a fundraiser. The amount of money they earn selling pizzas is shown in the table below. The amount of money they earn selling sub sandwiches can be represented by the function m = 4s, where m is the total amount of money earned and s is the number of sub sandwiches sold. Which food will the students earn more money selling if they sell 100 of each item? pizzas; The students will receive 4(100) or $400 for selling 100 subs, but will earn $500 for selling 100 pizzas.
  • 15. How did what you learned today help you answer the HOW can we model relationships between quantities? Course 3, Lesson 4-5 Functions
  • 16. How did what you learned today help you answer the HOW can we model relationships between quantities? Course 3, Lesson 4-5 Functions Sample answers: • Functions that are represented in different ways (table, graph, equation, or words) can be compared. • You can find the slopes of the different functions to compare their rates of change. • You can find the y-intercepts of different functions to compare their initial values.
  • 17. Create a table of data that has a constant rate of change. Find another table of data in your book. Then compare your function with the one in the book by comparing their rates of change. Ratios and Proportional RelationshipsFunctions Course 3, Lesson 4-5