Poster10: Population genetic structure of common bean (Phaseolus vulgris L) Landraces from Ethiopoia and Kenya

This document summarizes a study on the population genetic structure of common bean (Phaseolus vulgaris L.) landraces from Ethiopia and Kenya. The study analyzed 110 accessions from Ethiopia and 95 from Kenya using morphological traits and SSR markers. Results showed considerable diversity represented by both Andean and Mesoamerican gene pools. Beans from Eastern Africa clustered by country of origin, indicating distinct germplasm, but low gene flow between countries. Genetic diversity was slightly higher in Ethiopian than Kenyan accessions. Within Kenya, Andean types were more diverse than Mesoamerican, while the opposite was found in Ethiopia. The observed diversity provides valuable genes for breeding programs to develop varieties adapted to marginal
Recomendados

Recomendados
Más contenido relacionado
Más de CIAT
Más de CIAT (20)
Último
Último (20)
Poster10: Population genetic structure of common bean (Phaseolus vulgris L) Landraces from Ethiopoia and Kenya
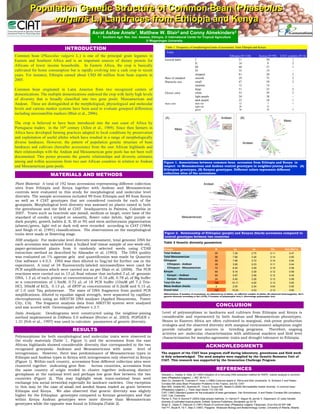
- 1. Population Genetic Structure of Common Bean (Phaseolus vulgaris L.) Landraces from Ethiopia and Kenya Asrat Asfaw Amele1, Matthew W. Blair2 and Conny Almekinders3 1 / Southern Agri. Res. Inst. Awassa, Ethiopia, 2/ International Center for Tropical Agriculture 3/ Wageningen University INTRODUCTION Table 1. Frequency of morphological traits of accessions from Ethiopia and Kenya Traits Common bean (Phaseolus vulgaris L.) is one of the principal grain legumes in Ethiopia (N=110) Kenya (N=95) CIAT controls (N=4) Eastern and Southern Africa and is an important sources of dietary protein for Growth habit I 21 30 1 II 14 9 2 Africans of lower income households. In Eastern Africa, the crop is basically III 40 37 1 cultivated for home consumption but is rapidly evolving into a cash crop in recent IV 35 19 - years. For instance, Ethiopia earned about USD 60 million from bean exports in stripped 81 20 2 Base of standard smooth 29 75 2 2005. Bracteole size small 47 59 2 medium 12 14 - Common bean originated in Latin America from two recognized centers of large 51 22 2 Flower color white 53 39 3 domestications. The multiple domestications endowed the crop with fairly high levels light purple 24 38 - of diversity that is broadly classified into two gene pools: Mesoamerican and dark purple 23 18 1 Andean. These are distinguished at the morphological, physiological and molecular Stem color dark red 12 7 1 light red 20 12 - levels and various marker systems have been used to evaluate genepool differences green 78 76 3 including microsatellite markers (Blair et al., 2006). (A) Andean (B) Meso The crop is believed to have been introduced into the east coast of Africa by Portuguese traders in the 16th century (Allen et al., 1989). Since then farmers in Meso Africa have developed farming practices adapted to local conditions by preservation and exploitation of useful alleles which have resulted in a range of morphologically diverse landraces. However, the pattern of population genetic structure of bean Andean landraces and cultivars (hereafter accessions) from the east African highlands and their relationships with the Andean and Mesoamerican gene pools has not been well documented. This poster presents the genetic relationships and diversity estimates among and within accessions from two east African countries in relation to Andean Figure 1. Associations between common bean accession from Ethiopia and Kenya in and Mesoamerican gene pools. respect to Mesoamerican and Andean control genotypes in neighbor-joining analysis. (A) Ethiopian genotypes, (B) Kenyan genotypes. Different colors represents different MATERIALS AND METHODS collection sites of the accessions. Plant Material: A total of 192 bean accessions representing different collection Andean sites from Ethiopia and Kenya together with Andean and Mesoamerican controls were evaluated in this study for morphological and molecular level diversity. The sample accessions included 99 from Ethiopia and 89 from Kenya as well as 4 CIAT genotypes that are considered controls for each of the genepools. Morphological level diversity was assessed on plants raised in both the greenhouse and the field at CIAT headquarters in Palmira, Colombia in 2007. Traits such as bracteole size (small, medium or large), outer base of the standard of corolla ( striped or smooth), flower color (white, light purple or Mesoamerican dark purple), growth habits (I, II, III or IV) and stem anthocyanin pigmentation (absent/green, light red or dark red) were recorded according to CIAT (1984) and Singh et al. (1991) classifications. The observations on the morphological traits were made at flowering stage. Figure 2. Relationship of Ethiopian (purple) and Kenyan (black) accessions compared to control genotypes between two countries SSR analysis: For molecular level diversity assessment, total genomic DNA for Table 2 Genetic diversity parameters each accession was isolated from a bulked leaf tissue sample of one-week-old, paper-germinated plants from 6 randomly selected seeds using CTAB Groups N na ne Ho Het (Nei's) extraction method as described by Afanador et al. (1993). The DNA quality Total Andean 95 7.26 2.75 0.11 0.47 was evaluated on 1% agarose gels and quantification was made by Quantity Total Mesoamerican 96 7.66 3.28 0.14 0.60 One software v.4.0.3. DNA was then diluted to 5ng/ml for further use in the Ethiopean 99 7.68 3.72 0.14 0.64 experiment. A total of 34 fluorescently-labeled microsatellites were used for Ethiopean ‐ Andean 28 3.95 2.23 0.11 0.44 Ethiopean ‐ Mesoamerican 70 6.45 3.09 0.15 0.59 PCR amplifications which were carried out as per Blair et al. (2006). The PCR Kenyan 89 8.16 3.39 0.12 0.59 reactions were carried out in 13 µL final volume that included 3 µL of genomic Kenyan – Andean 65 5.97 2.56 0.12 0.45 DNA, 1.5 µL of each primer at concentrations of 0.16 µM, 0.78 µL of Mg buffer Kenyan ‐ Mesoamerican 24 5.40 3.28 0.13 0.59 at a concentration of 1.5mM, 0.72 µL of 1X PCR buffer (10mM pH 7.2 Tris- Total Eth‐Ken 188 10.11 4.00 0.13 0.65 HCl, 50mM of KCl), 0.13 µL of dNTP at concentration of 0.2mM and 0.15 µL Meso‐Andean checks 4 2.55 2.34 0.04 0.50 of 1.0 unit Taq polymerase. The sizes of DNA fragments from pooled PCR Grand total 192 10.24 4.03 0.13 0.65 amplifications, diluted to equalize signal strength, were separated by capillary Abbreviations: N (number of accessions), na (observed no of alleles, ne (effective number of alleles, Ho (observed heterozygosity, Nei’s (genetic diversity according to Nei (1978), P (number of polymorphic loci),% (Percentage polymorphic loci) electrophoresis using an ABI3730 DNA analyzer (Applied Biosystems, Foster City, CA). The fragment analysis data from ABI3730 system were analyzed and size scored with Genemapper software v.3.7. CONCLUSION Data Analysis: Dendrograms were constructed using the neighbor-joining Level of polymorphism in landraces and cultivars from Ethiopia and Kenya is method implemented in DARwin 5.0 software (Perrier et al. 2003). POPGEN v. considerable and represented by both Andean and Mesoamerican phenotypes. 1.31 (Yeh et al., 1997) was used to calculate parameters of genetic diversity. Beans in Eastern Africa are often cultivated in marginal, risk-prone production ecologies and the observed diversity with marginal environment adaptation might RESULTS provide valuable gene sources in breeding programs. Therefore, ongoing activites are: molecular characterization with additional markers and field level Polymorphism for both morphological and molecular traits were observed in characterization for morpho-agronomic traits and drought tolerance in Ethiopia. the study materials (Table 1, Figure 1) and the accessions from the east African highlands showed considerable diversity that corresponded to the two ACKNOWLEDGMENTS recognized genepools: Andeans and Mesoamericans with some level of introgression. However, there was predominance of Mesoamerican types in The support of the CIAT bean program staff during laboratory, greenhouse and field work Ethiopia and Andean types in Kenya with introgression only observed in Kenya is duly acknowledged. The seed samples were supplied by the Genetic Resource Unit of CIAT. This research was supported by the Generation Challenge Program. (Figure 1). Within each country, accessions from different collection sites were clustered together indicating gene flow. Across countries, accessions from the same country of origin tended to cluster together indicating distinct REFERENCES germplasm at the national level and perhaps low gene flow between the two Afanador L, Hadley S, Kelly JD (1993) Adoption of a mini-prep DNA extraction method for RAPD marker analysis in common countries (Figure 2). This may highlight weak trans-national bean seed bean (Phaseolus vulgaris L.). BIC 36:10-11. Allen DJ, Dessert M, Trutmann P, Voss J (1989) Common beans in Africa and thier constriants. In: Schwarz F and Pastor- exchange (via social networks) especially for landrace varieties. One exception Corrales MA (eds) Bean Production Problems in the Tropics. 2nd Ed. CIAT to this may be the case of small red seeded beans traded as grain between Blair MW, Giraldo MC, Buendia HF, Tova E, Duque MC, Beebe S (2006) Microsatellite marker diverstiy in common bean (Phaseolus vulgaris L.). Theor Appl Genet 113:100-109 Ethiopia and Kenya. We also observed that genetic diversity was slightly CIAT (1987) Standard system for the evaluation of bean germplasm. Van Schoohoven, A and Pastor-Corrales MA (compilers). higher for the Ethiopian genotypes compared to Kenyan genotypes and that CIAT, Cali, Colombia. within Kenya Andean genotypes were more diverse than Mesoamerican Perrier X, Flori A, Bonnot F (2003) Data anlysis methods. In: Hamon P, Seguin M, perrier X, Glaszmann JC (eds) Genetic diversity of cultivated tropical plants. Enfield, Science Publishers, Montpelier pp 43-76 genotypes while the opposite was found in Ethiopia (Table 2). Singh S., Gepts P, Debouck D (1991) Races of common bean (Phaseolus vulgaris, Fabaceae). Econ Bot 45:397-396 Yeh FY, Boyle R, Ye T, Mao Z (1997). Popgene. Molecular Biology and Biotechnology Center, University of Alberta, Alberta