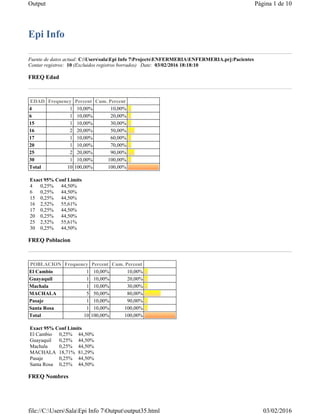
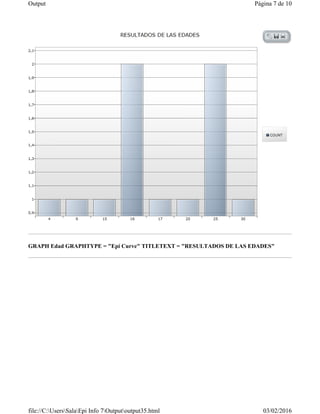
El documento presenta estadísticas sobre 10 pacientes que incluyen edad, población y nombre. Muestra tablas de frecuencias y porcentajes para cada variable, así como tablas cruzadas analizando las relaciones entre ellas. Adicionalmente, incluye gráficos de diferentes tipos para visualizar los resultados.
ROMPECABEZAS DE ECUACIONES DE PRIMER GRADO OLIMPIADA DE PARÍS 2024. Por JAVIE...JAVIER SOLIS NOYOLA
El Mtro. JAVIER SOLIS NOYOLA crea y desarrolla el “ROMPECABEZAS DE ECUACIONES DE 1ER. GRADO OLIMPIADA DE PARÍS 2024”. Esta actividad de aprendizaje propone retos de cálculo algebraico mediante ecuaciones de 1er. grado, y viso-espacialidad, lo cual dará la oportunidad de formar un rompecabezas. La intención didáctica de esta actividad de aprendizaje es, promover los pensamientos lógicos (convergente) y creativo (divergente o lateral), mediante modelos mentales de: atención, memoria, imaginación, percepción (Geométrica y conceptual), perspicacia, inferencia, viso-espacialidad. Esta actividad de aprendizaje es de enfoques lúdico y transversal, ya que integra diversas áreas del conocimiento, entre ellas: matemático, artístico, lenguaje, historia, y las neurociencias.
ACERTIJO DE CARRERA OLÍMPICA DE SUMA DE LABERINTOS. Por JAVIER SOLIS NOYOLAJAVIER SOLIS NOYOLA
El Mtro. JAVIER SOLIS NOYOLA, crea y desarrolla ACERTIJO: «CARRERA OLÍMPICA DE SUMA DE LABERINTOS». Esta actividad de aprendizaje lúdico que implica de cálculo aritmético y motricidad fina, promueve los pensamientos lógico y creativo; ya que contempla procesos mentales de: PERCEPCIÓN, ATENCIÓN, MEMORIA, IMAGINACIÓN, PERSPICACIA, LÓGICA LINGUISTICA, VISO-ESPACIAL, INFERENCIA, ETCÉTERA. Didácticamente, es una actividad de aprendizaje transversal que integra áreas de: Matemáticas, Neurociencias, Arte, Lenguaje y comunicación, etcétera.
4. MEANS Edad
GRAPH Edad GRAPHTYPE = "Area" TITLETEXT = "RESULTADOS DE LAS EDADES"
GRAPH Edad GRAPHTYPE = "Bar" TITLETEXT = "RESULTADOS DE LAS EDADES"
Obs Total Mean Variance Std Dev
10,0000 174,0000 17,4000 66,7111 8,1677
Minimum 25% Median 75% Maximum Mode
4,0000 15,0000 16,5000 25,0000 30,0000 16,0000
Página 4 de 10Output
03/02/2016file://C:UsersSalaEpi Info 7Outputoutput35.html
5. GRAPH Edad GRAPHTYPE = "Bubble" TITLETEXT = "RESULTADOS DE LAS EDADES"
Página 5 de 10Output
03/02/2016file://C:UsersSalaEpi Info 7Outputoutput35.html
6. GRAPH Edad GRAPHTYPE = "Column" TITLETEXT = "RESULTADOS DE LAS EDADES"
Página 6 de 10Output
03/02/2016file://C:UsersSalaEpi Info 7Outputoutput35.html
7. GRAPH Edad GRAPHTYPE = "Epi Curve" TITLETEXT = "RESULTADOS DE LAS EDADES"
Página 7 de 10Output
03/02/2016file://C:UsersSalaEpi Info 7Outputoutput35.html
8. GRAPH Edad GRAPHTYPE = "Line" TITLETEXT = "RESULTADOS DE LAS EDADES"
Página 8 de 10Output
03/02/2016file://C:UsersSalaEpi Info 7Outputoutput35.html
9. GRAPH Edad GRAPHTYPE = "Pie" TITLETEXT = "RESULTADOS DE LAS EDADES"
Página 9 de 10Output
03/02/2016file://C:UsersSalaEpi Info 7Outputoutput35.html
10. Página 10 de 10Output
03/02/2016file://C:UsersSalaEpi Info 7Outputoutput35.html